
EB Daily Market Report - Thursday, January 12, 2023
Upcoming EB Tools Webinar This Saturday
I will be leading a virtual event on Saturday morning at 10:00am ET to discuss the EB.com platform. We've developed a large list of ChartLists designed to help our members find high quality trades and investments. On Saturday, I plan to show everyone why these ChartLists were developed, what they are, and how you can use them to find better trading opportunities. We've been mired in a a nasty bear market for most of the last year, so it's been difficult to use them for profit. Instead, we've been in a market where we've needed to remain persistent in protecting our capital. I believe that's beginning to change. We'll need to grow more aggressive and I plan to show everyone how to do that on Saturday. We'll send out room instructions later this week and we'll record the event for those unable to attend live.
MarketVision 2023 and Webinar Special
Today's the last day to take advantage of our annual special discussed last week at our MarketVision 2023 event. If you move from a trial member or monthly member to an annual membership, you'll get 14 months that includes 2 bonus months, for $997. You'll also receive any unused part of your 30-day trial. I also want to mention that existing annual members can also use this special to extend for 14 months. If you're interested, please write in to us at "[email protected]" and we'll get everything taken care of for you.
This special ends at midnight TONIGHT, so be sure to act NOW!
Executive Market Summary
- Futures were fairly flat overnight as traders awaited the December CPI report this morning
- Unlike the previous several CPI reports, this one came in exactly on consensus estimates - at least at the Core CPI level
- We've seen a bit of volatility, but the trend higher remains in play as our key indices have printed higher daily highs and higher daily lows
- Cryptocurrencies have caught fire of late and that continues today, with bitcoin ($BTCUSD, +5.18%) and etherium ($ETHUSD, +2.82%) surging
- The 10-year treasury yield ($TNX) has dropped 11 basis points to 3.45% as bond traders accumulate bonds
- Energy (XLE, +1.99%) is leading today, while communication services (XLC, +1.02%) strengthens as well
- Consumer staples (XLP, -0.76%) and utilities (XLU, -0.49%), two defensive groups, are the worst-performing sectors
- The airlines ($DJUSAR, +4.34%) are "flying" again today, this time breaking out to a level not seen since early June
Market Outlook
One week ago, I indicated that the Volatility Index ($VIX) and S&P 500 were showing positive correlation as both were moving lower. That positive correlation is very rare and typically foreshadows a reversal in the S&P 500. At that time, I suggested we would see a short-term rally, which we have. I also indicated that these types of signals tell us to consider more risk - if we're so inclined. Trading leveraged ETFs make more sense, because of the increased odds of a rally. If you're still in any leveraged ETFs, I'm okay continuing to hold. There are two "stop" areas you could consider. The first would be any lower daily low on the underlying index that is being tracked. For instance, the QLD tracks the NASDAQ 100 ($NDX) at a 2 to 1 clip, while the TQQQ tracks that same index at a 3 to 1 clip. If the NDX prints a lower daily low, I'd consider switching from the leveraged ETF back to the QQQ (which tracks the NDX at a 1 to 1 clip). I typically like to trade leveraged ETFs when I'm at a major support OR in a confirmed uptrend. The second option for a stop would be the rising 20-day EMA. If the NDX closes back beneath that key moving average, I'd consider selling any leveraged products. These are simply rules I try to live by, but you can feel free to trade these leveraged products as you wish.
Sector/Industry Focus
Electrical components & equipment ($DJUSEC) is yet another group on the verge of joining the bullish party:
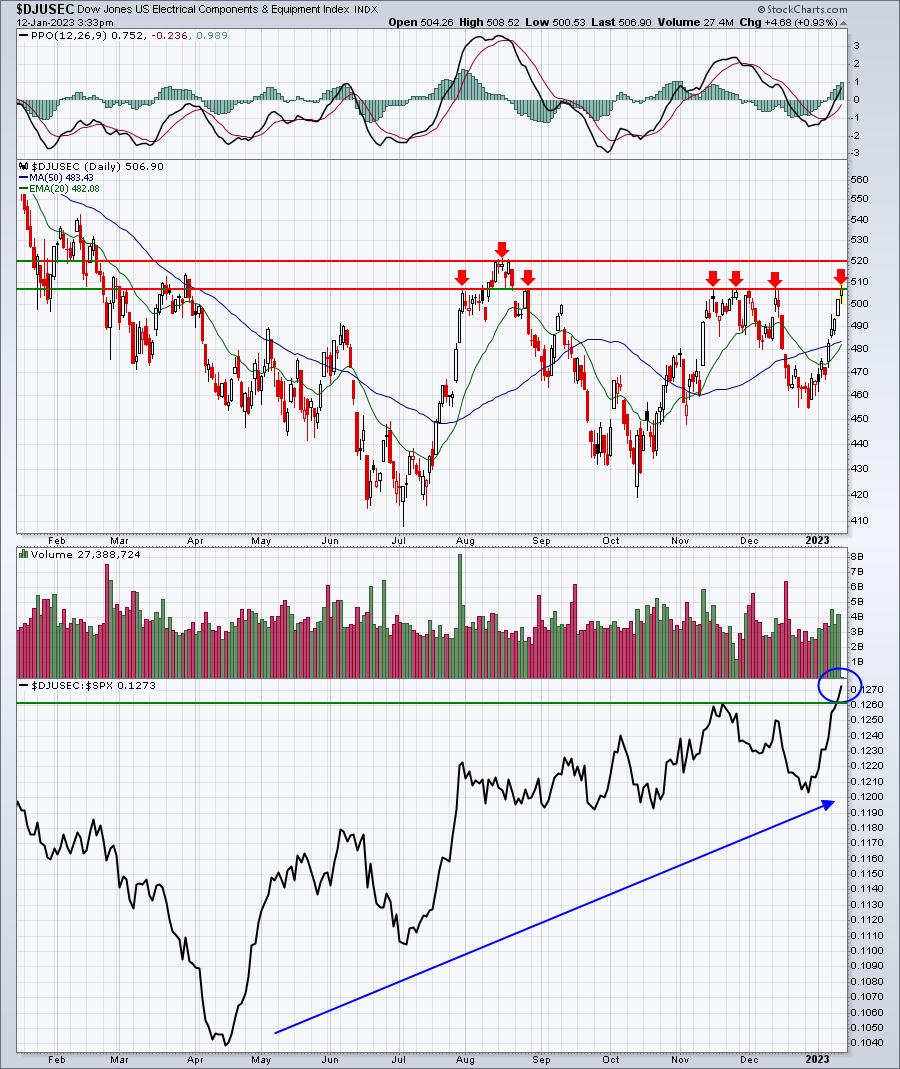
All of those red arrows tell us how important this overhead price resistance range is. Should the DJUSES break above this key price resistance range, it's another part of technology (XLK) that turns from bearish to bullish.
ChartLists/Strategies
Here are a couple more breakouts today, this time from our Raised Guidance ChartList (RGCL):
JBL:
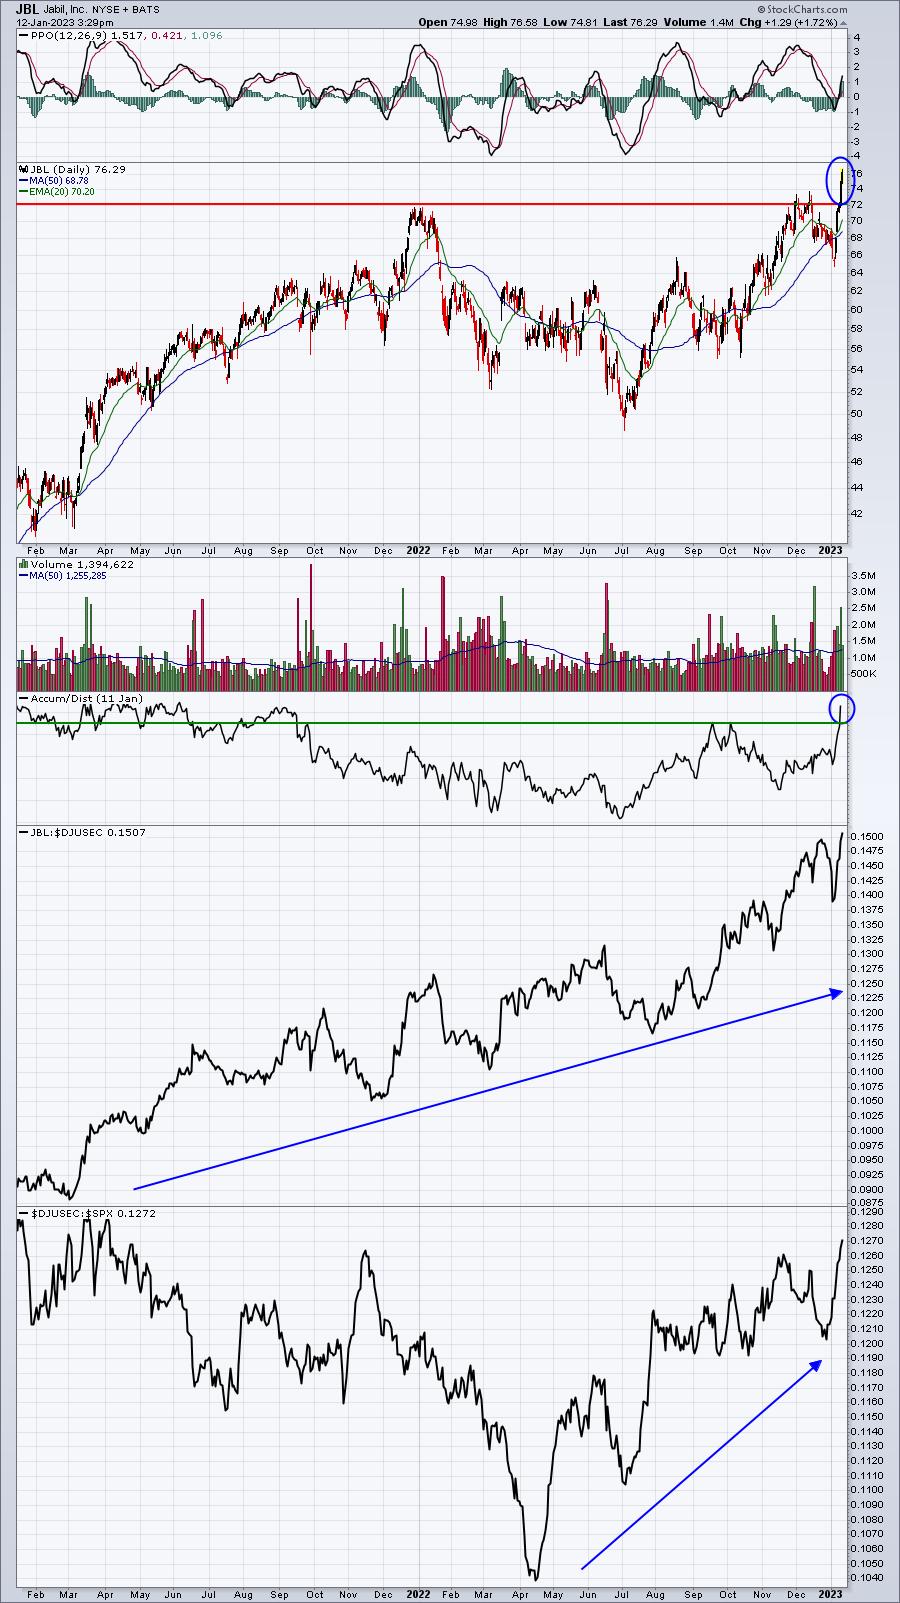
JBL is a leading stock in the electrical components group ($DJUSEC). 2022 appears to be one HUGE cup, with December weakness being the handle. If so, JBL has a measurement ultimately to the 95-96 level.
X:
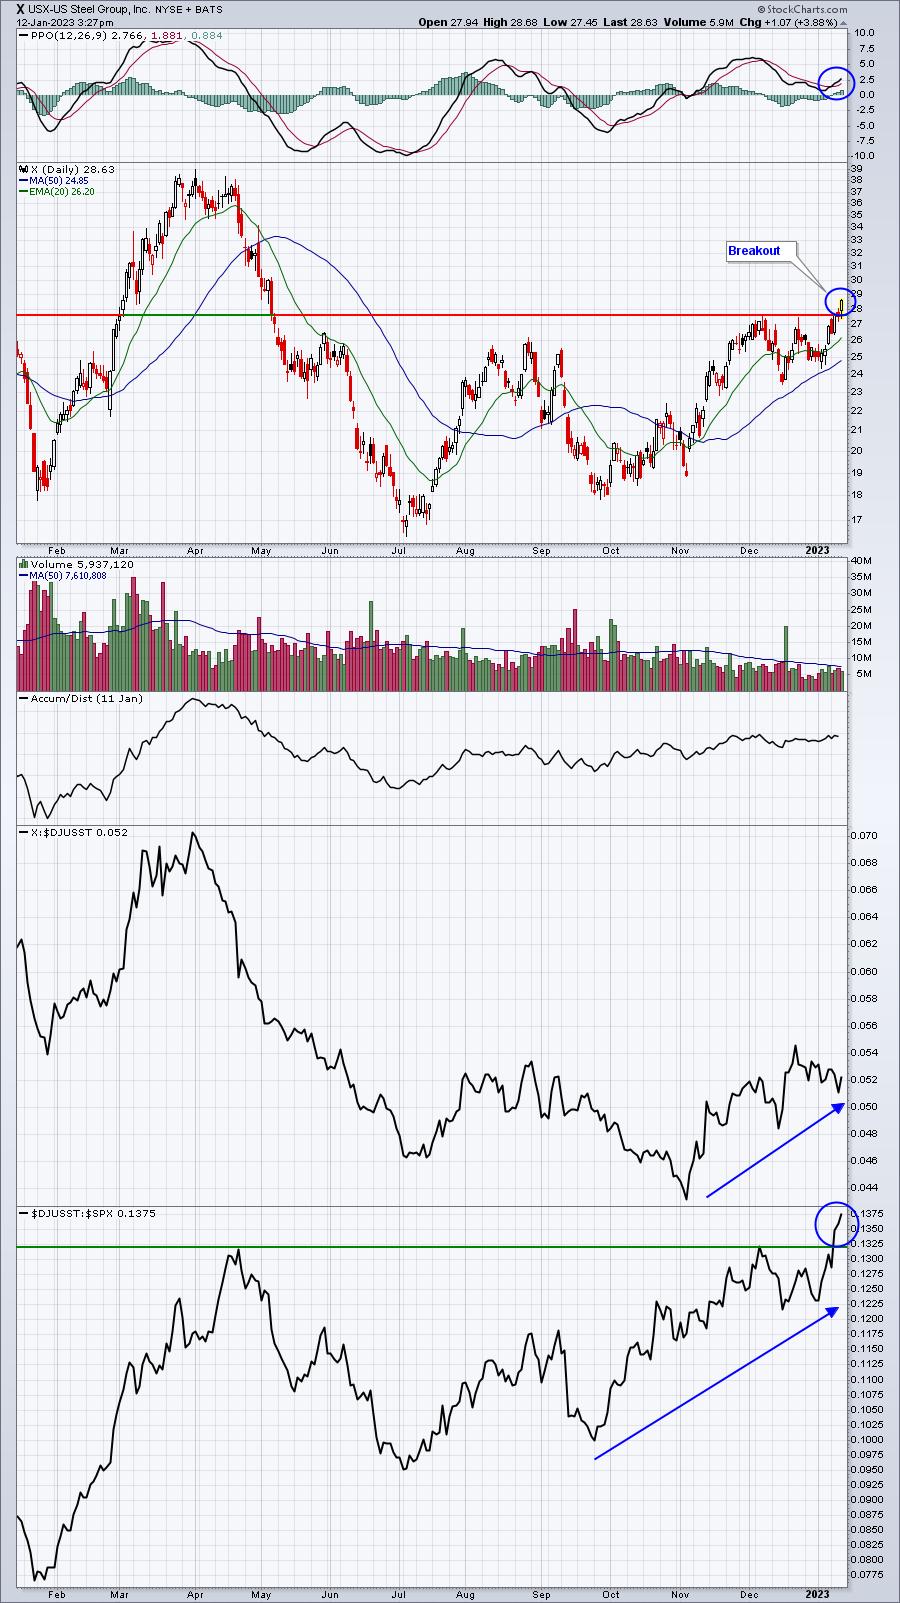
Steel ($DJUSST) has broken out again vs. the benchmark S&P 500 and X has been showing nice relative strength for the past couple months. When you see a leading stock in a leading industry group breaking out, it's typically a very bullish signal.
Earnings Reports
Here are the key earnings reports for the next two days, featuring stocks with market caps of more than $10 billion. I also include several companies with market caps below $10 billion. Finally, any portfolio stocks that will be reporting results are highlighted in BOLD. If you decide to hold a stock into earnings, please understand the significant short-term risk that you are taking. Please be sure to check for earnings dates for any companies you own or are considering owning.
Thursday, January 12:
TSM, INFY
Friday, January 13:
UNH, JPM, BAC, WFC, BLK, C, BK, WIT, DAL, FRC
Economic Reports
December CPI: -0.1% (actual) vs. +0.0% (estimate)
December Core CPI: +0.3% (actual) vs. +0.3% (estimate)
Happy trading!
Tom