
EB Daily Market Report - Wednesday, January 18, 2023
Model ETF Draft Today!
Later this afternoon, we'll be hosting our latest reveal of the Model ETFs that will comprise our Model ETF Portfolio for the next 3 months. I'll be discussing the methodology behind our selection process, current market themes considered, and I'll unveil this quarter's ETFs. It all starts at 5:30pm ET and we've recently sent out separate room instructions. I hope you can join me!
If you can't make the live session today, it'll be recorded, and we'll make sure you get a copy to view at your leisure.
Executive Market Summary
- Futures were higher overnight and our major indices began the day in positive territory
- After 30 minutes of market strength, selling kicked in and all of our major indices are now in the red
- Economic reports have been particularly weak between yesterday and today and that could be weighing on equities
- It's certainly impacting the bond market, where the 10-year treasury yield ($TNX) is down 11 basis points to 3.42% after printing an intraday low of 3.37% - the lowest TNX level since September 2022
- Options expire on Friday and during our Max Pain session yesterday, I pointed out that both the SPY and QQQ suggested our short-term direction could be lower
- Cryptocurrencies are down significantly (mostly 4-6%) as some profit taking kicks in
- Crude oil ($WTIC, +1.76%) is continuing its rally as the price has surged past $81 per barrel
- All 11 sectors are lower, led by the defensive consumer staples (XLP, -1.75%) and utilities (XLU, -1.54%)
Market Outlook
The growth vs. value ratios that I like to see perform well during a secular bull market advance are beginning to work again in 2023, which is a very bullish signal. But, for the most part, these ratios were extremely weak to close out 2022, so one relative bounce is nice, but it in no way guarantees us of a further advance. We'll need much more from the growth stocks, but this is at least a start:
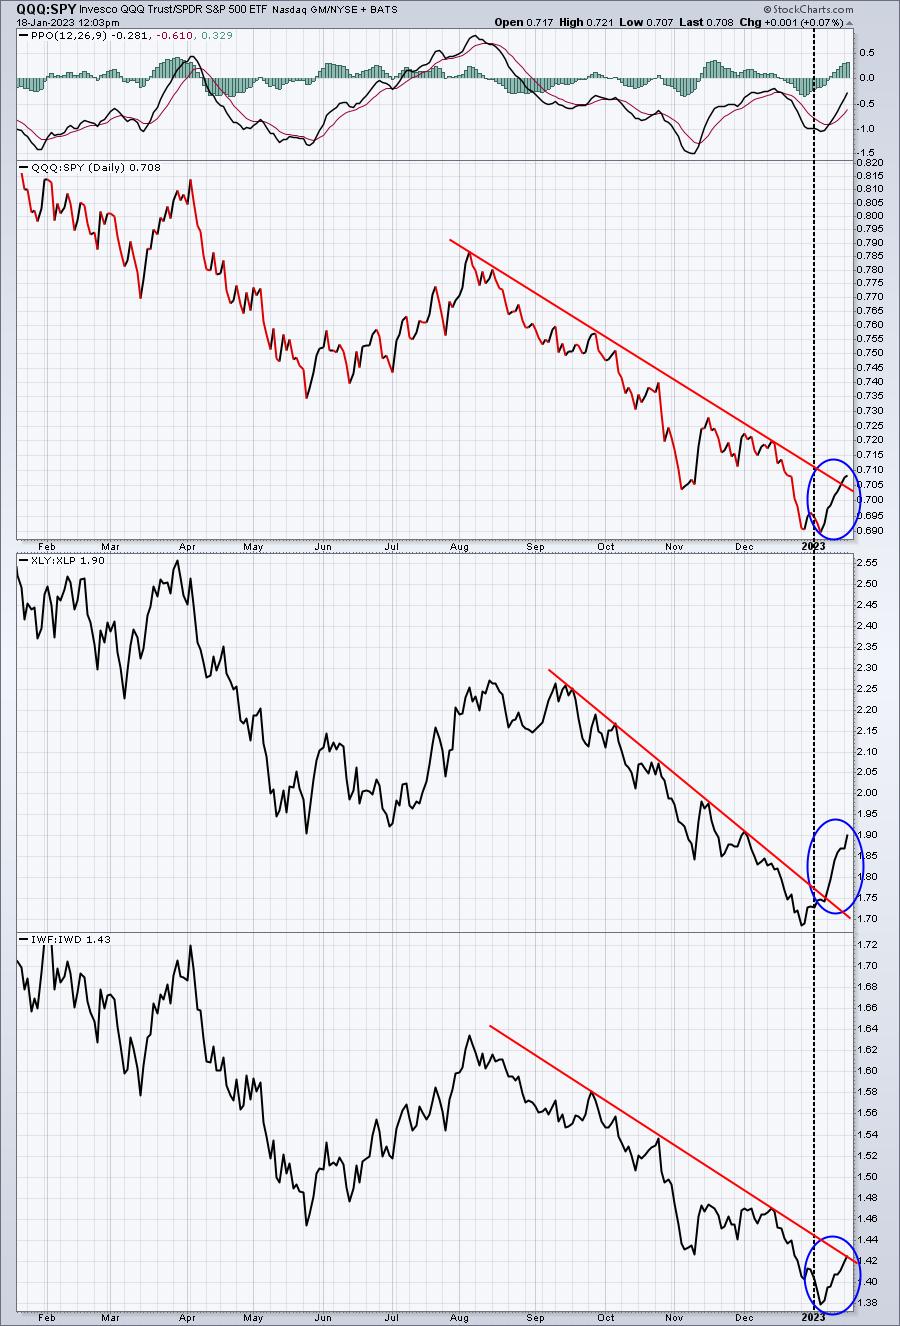
In addition to moving higher to support this market rally to start 2023, all three of the above ratios are attempting to clear brutal relative downtrend lines. While we're seeing weakness today in our major indices, all 3 of these ratios are positive on the session. I'm watching closely, because very important rotation in the market could be taking place right before our eyes.
Sector/Industry Focus
Banks ($DJUSBK) had a nice pre-earnings run up and many earnings reports in this industry group have been strong, including JP Morgan's (JPM) from last Friday. But now that the "rumors" of solid results are behind us, the actual "news" is being accompanied by profit taking. My initial question for the DJUSBK is, "can we hold the rising 20-day EMA?"
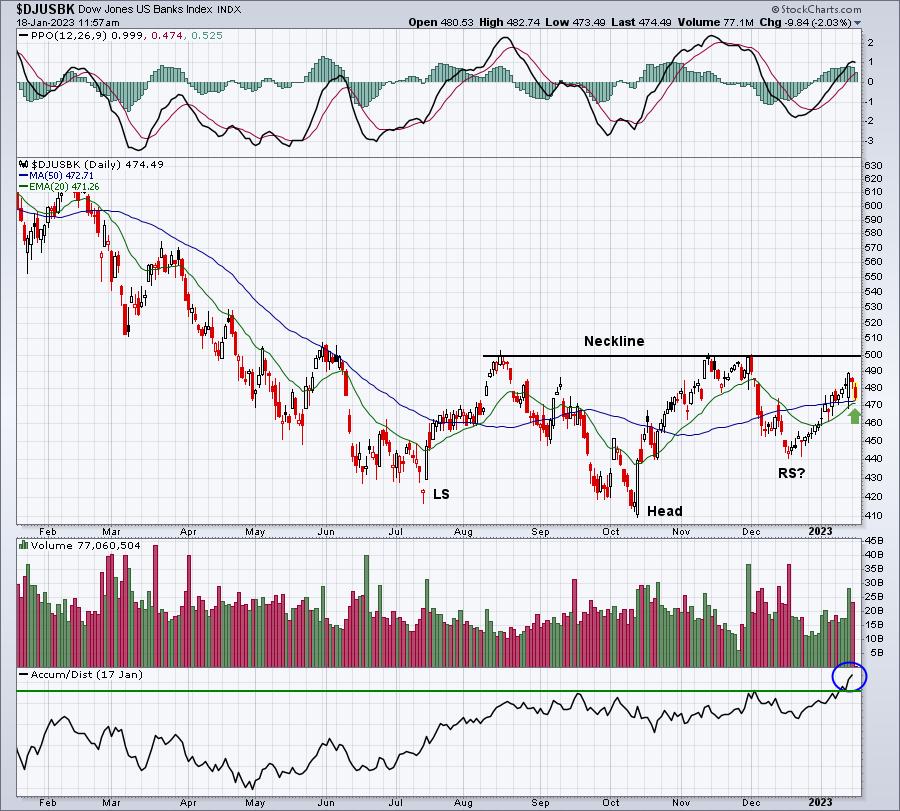
I highlighted this potentially bullish pattern last week. It becomes much more bullish if we see confirmation of a neckline breakout. Until then, it's nice to see the AD line breaking to fresh new highs. Also, the DJUSBK is trending above its rising 20-day EMA. I'd like to see that hold.
ChartLists/Strategies
From our Strong Earnings ChartList (SECL), here is a very strong stock that could offer up a great trading opportunity:
ARRY:
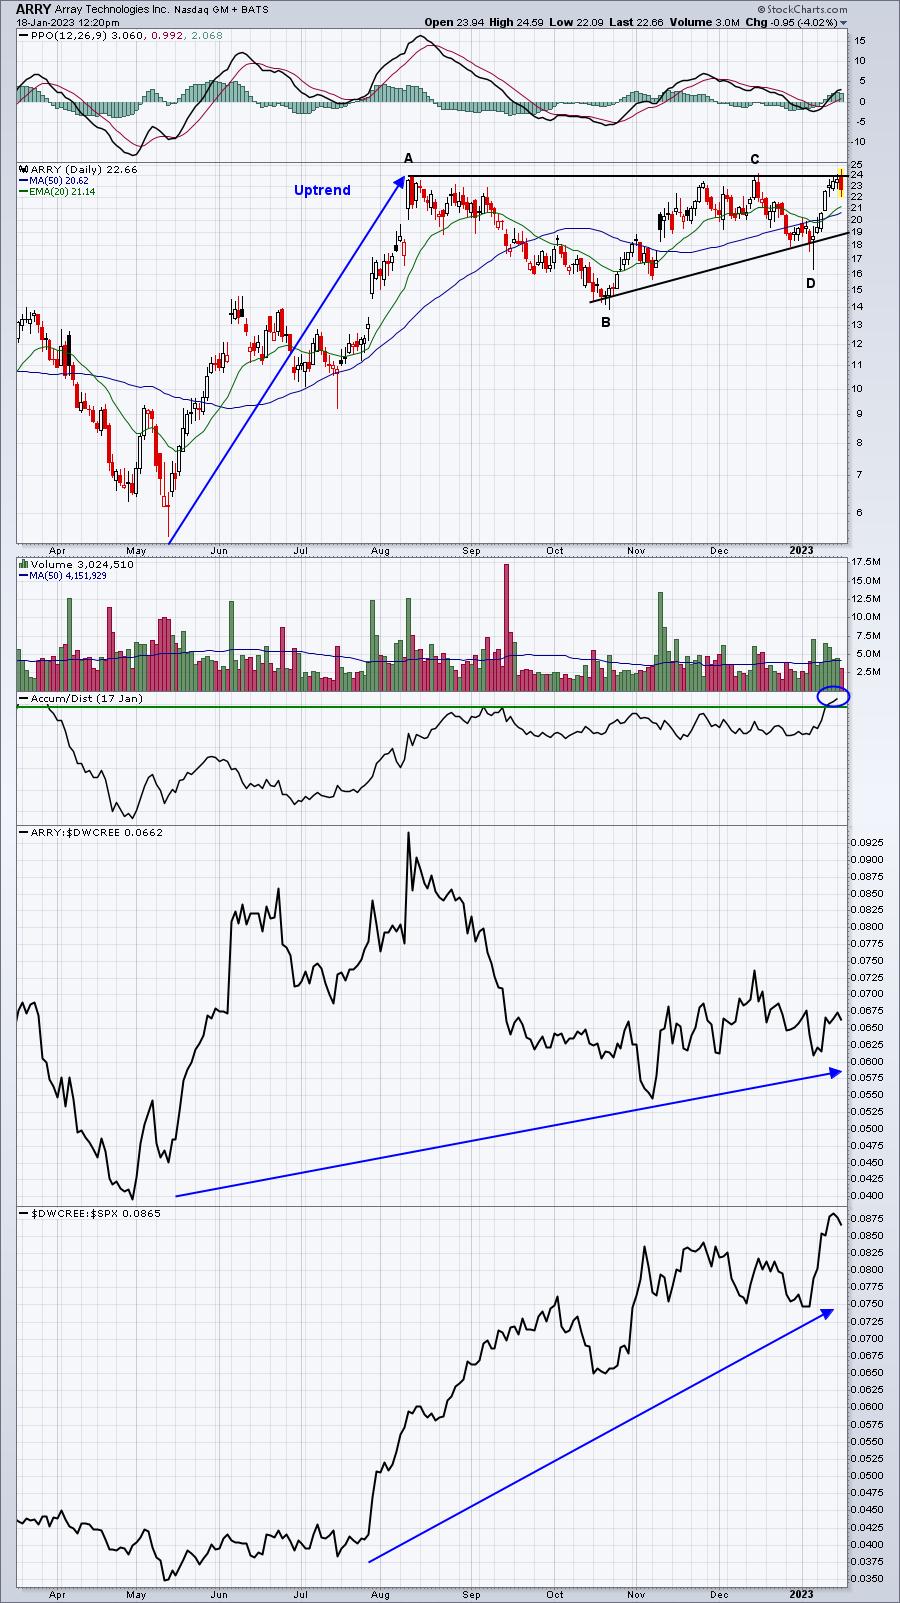
A pullback to test its rising 20-day EMA would be one possible signal for entry. To the upside, I would LOVE a breakout of this classic A-B-C-D-E bullish ascending triangle pattern. The only thing missing is the "E", which is the high volume breakout. If we get the breakout, the initial measurement (top triangle resistance line down to Point B) is 10 bucks. The breakout level is 24, so if we add the measurement of 10 bucks, we get an initial target of 34. Achieving that upside target would be a very nice gain. Keep this one on your radar.
Earnings Reports
Here are the key earnings reports for the next two days, featuring stocks with market caps of more than $10 billion. I also include several companies with market caps below $10 billion. Finally, any portfolio stocks that will be reporting results are highlighted in BOLD. If you decide to hold a stock into earnings, please understand the significant short-term risk that you are taking. Please be sure to check for earnings dates for any companies you own or are considering owning.
Wednesday, January 18:
SCHW, PLD, PNC, KMI, DFS, JBHT, FHN, AA, WTFC, FUL
Thursday, January 19:
PG, NFLX, TFC, PPG, FAST, MTB, FITB, NTRS, KEY, SIVB, CMA, CBSH, CNXC, SNV, TAL, OZK
Economic Reports
December PPI: -0.5% (actual) vs. -0.1% (estimate)
December Core PPI: +0.1% (actual) vs. +0.1% (estimate)
December retail sales: -1.1% (actual) vs. -0.8% (estimate)
December retail sales less autos: -1.1% (actual) vs. -0.5% (estimate)
December industrial production: -0.7% (actual) vs. -0.1% (estimate)
December capacity utilization: 78.8% (actual) vs. 79.5% (estimate)
November business inventories: +0.4% (actual) vs. +0.4% (estimate)
January housing market index: 35 (actual) vs. 31 (estimate)
Beige book will be released at 2pm ET
Happy trading!
Tom