
EB Daily Market Report - Tuesday, January 24, 2023
ChartLists Updated
I have updated key ChartLists ahead of our Live Trading Room for later this week. The updated ChartLists are as follows:
- Strong Earnings ChartList (SECL)
- Strong Future Earnings ChartList (SFECL)
- Raised Guidance ChartList (RGCL)
- Bullish Trifecta ChartList (BTCL)
In particular, you'll want to make sure you've downloaded the new RGCL into your StockCharts.com account (if you're a member). I provide the earnings dates for every company in this ChartList and many of them have changed. So if you rely on those earnings dates, then you'll want to make sure you have the latest information.
If you're not a StockCharts.com member, we do provide these charts for other platforms. If you have questions, please reach out to us at "[email protected]".
Live Trading Room
We will be hosting our first-ever LIVE trading room on Friday. It'll all get started, however, on Thursday evening at 7:00pm ET as I show you how I prepare for the trading day ahead. If you're going to trade, you need to be prepared. Too many traders wake up in the morning, look at stocks after the open, and THEN decide where they want to invest their money. At that point, however, I believe it's too late. Emotions take over and you trade based on price action, rather than managing risk by trading ONLY at appropriate price levels.
We'll have market conditions, earnings reports, economic reports, technical breakouts/breakdowns, relative strength, and many other factors to consider on Thursday evening.
This event is FREE to all ANNUAL members of EarningsBeats.com. If you're currently a trial member or a monthly member, you can upgrade to ANNUAL membership at any time prior to Thursday's 7:00pm ET start time and join us at no additional cost. It should be an eye-opening and educational event for sure. I hope to see you there!
If you would like to upgrade and attend, be sure to write us at "[email protected]" and we'll take care of the rest!
Executive Market Summary
- Futures were down slightly overnight and our major indices opened lower
- Trading throughout the day has been relative flat and we have bifurcated action
- The Dow Jones is currently higher, while both the S&P 500 and NASDAQ show modest losses
- Crude oil ($WTIC, -1.97%) has fallen back to $80 per barrel, while natural gas ($NATGAS) drops another 5.6%
- Health care (XLV, -0.71%) and energy (XLE, -0.35%) lag the other sectors; industrials (XLI, +0.73%) is today's leading sector
- Just like the major indices, however, our sectors are bifurcated with 5 higher and 6 lower
- 3M (MMM, -5.68%) is the worst S&P 500 performer after reporting its quarterly results
- Meanwhile, Travelers (TRV, +3.74%) is helping to lift the Dow Jones after reporting its results this morning
Market Outlook
Hourly charts show bullish patterns on both the Dow Jones and NASDAQ 100:
Dow Jones:
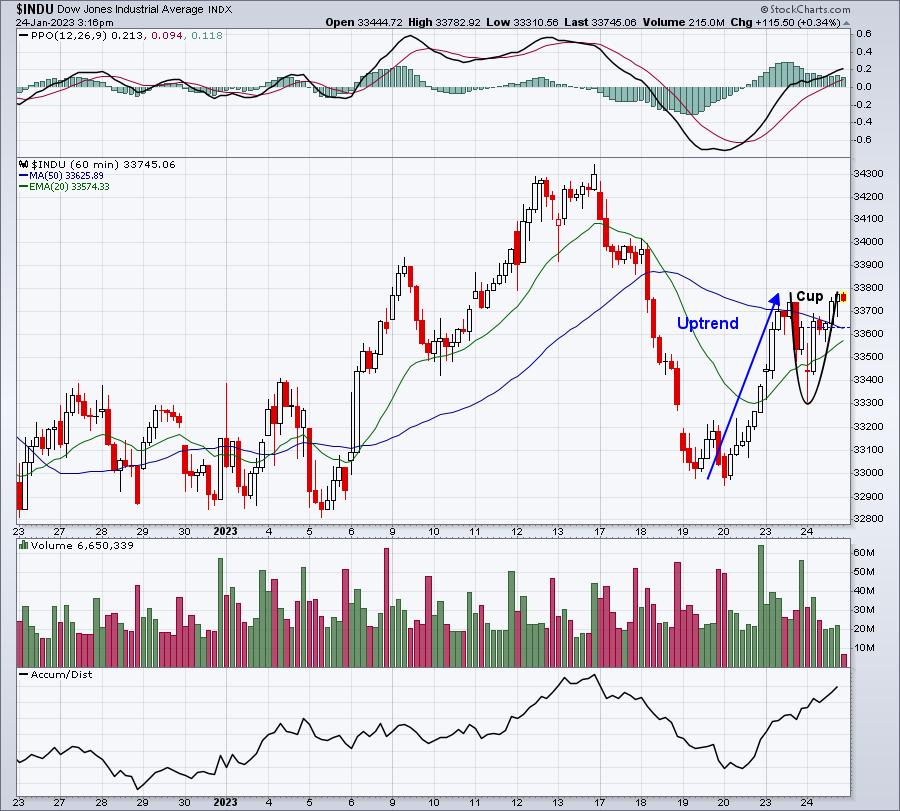
Let's watch to see if a handle forms. If we see the Dow Jones clear 33800, it'd be a bullish signal.
NASDAQ 100:
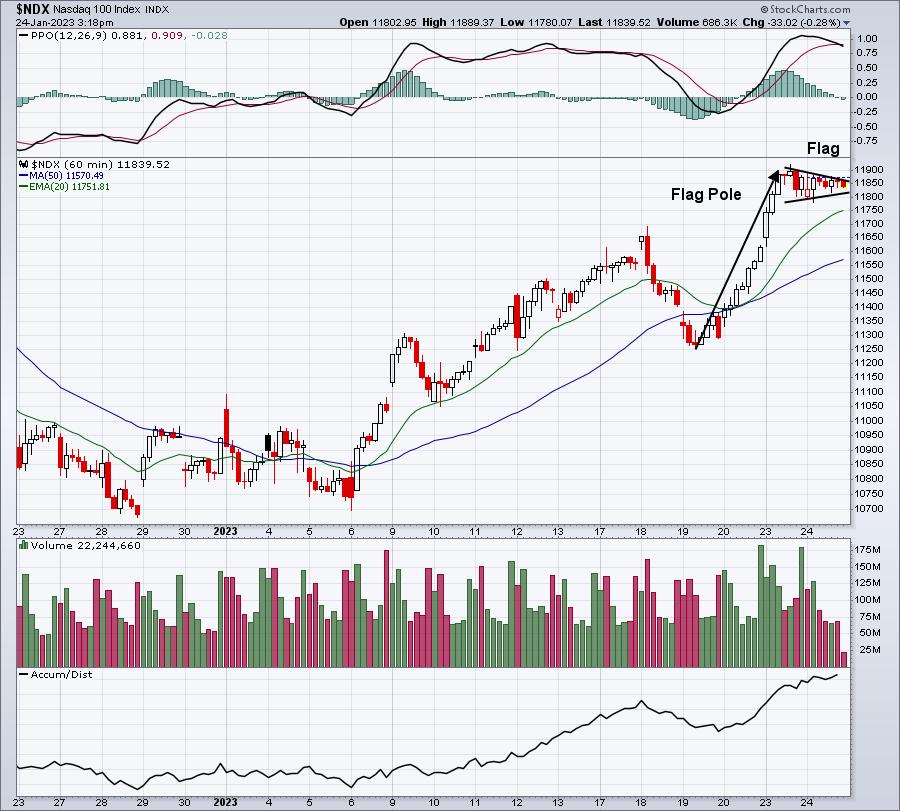
For now, this appears to be a bullish flag after the recent steady advance looks like a flag pole. Like the Dow, a breakout from this pattern would be very bullish.
Sector/Industry Focus
I'm keeping my own equity-only put-call ratio ($CPCE) using the User-Defined Index (UDI) at StockCharts.com. I'm adjusting this ratio for the obvious overstatements relating to daily readings. First, here is what the CPCE looks like without adjustment:
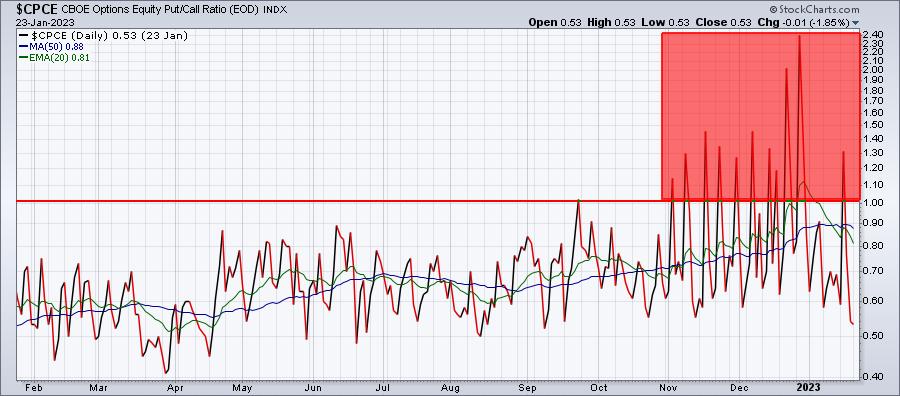
I have studied the CPCE for many, many years. Readings do NOT go above 1.0 unless we're in the midst of a free fall. The highest reading on record prior to Q4 2022 was 1.35 back during the financial crisis in 2008. These routine readings well above 1.0 are not providing us the signals we need, because it's not reflective of the retail trading community. Several recent articles have discussed these high readings, acknowledging that it's the result of institutional put buyers. I don't have perfect numbers, but I believe my UDI more accurately reflects the the psyche of the retail community. Here's what I show:
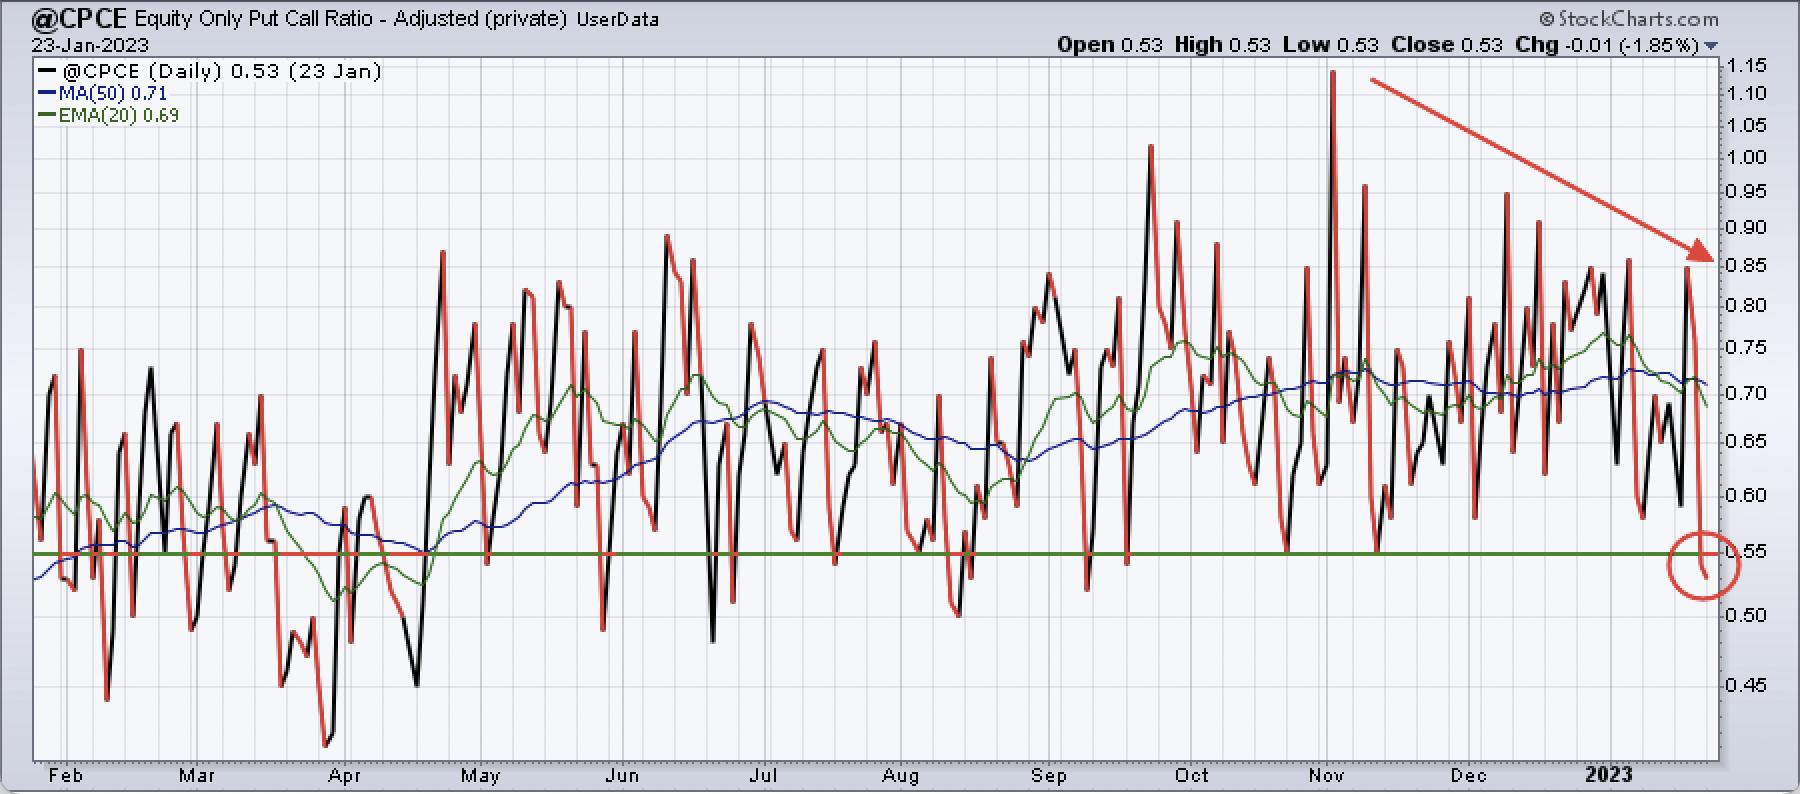
Instead of a rising CPCE, I'm seeing what looks like the beginning of a decline. Yesterday's reading hit 0.53, which is the lowest CPCE reading since September. As this number moves lower and lower, history tells us to be LONG, not SHORT.
ChartLists/Strategies
Earnings will be taking center stage as the number of companies reporting their quarterly results will increase significantly over the next 2-3 weeks. We had our Q4 Earnings webinar yesterday after the market close and I provided 63 companies that I like heading into their earnings reports and 40 that I'd avoid. Here's a sample of each:
FFIV (bearish, reports after the close today):
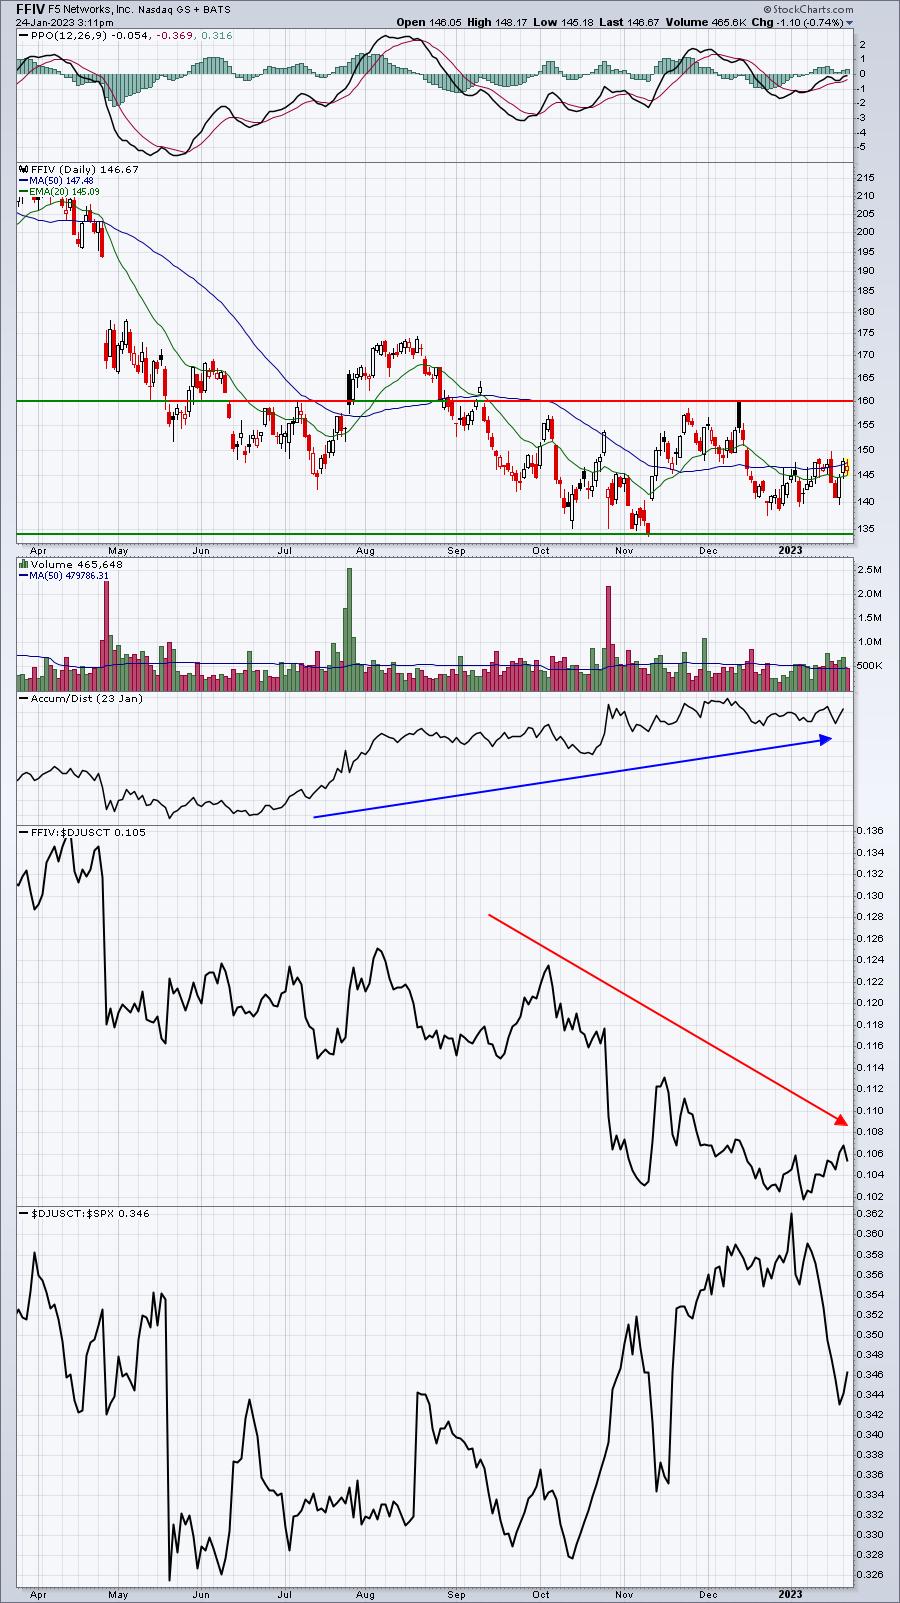
The AD line here looks great, but that is not a primary indicator for me. AD lines are secondary indicators and I use them to confirm or refute what I'm seeing in terms of price. FFIV remains very weak relative to its peers and we may find out why after the close today. A big gap down near price support at 135 might be interesting from a long perspective, especially if we see a false breakdown. For now, however, consider the trading range to be 135-160.
AGYS (bullish, reports after the close today):
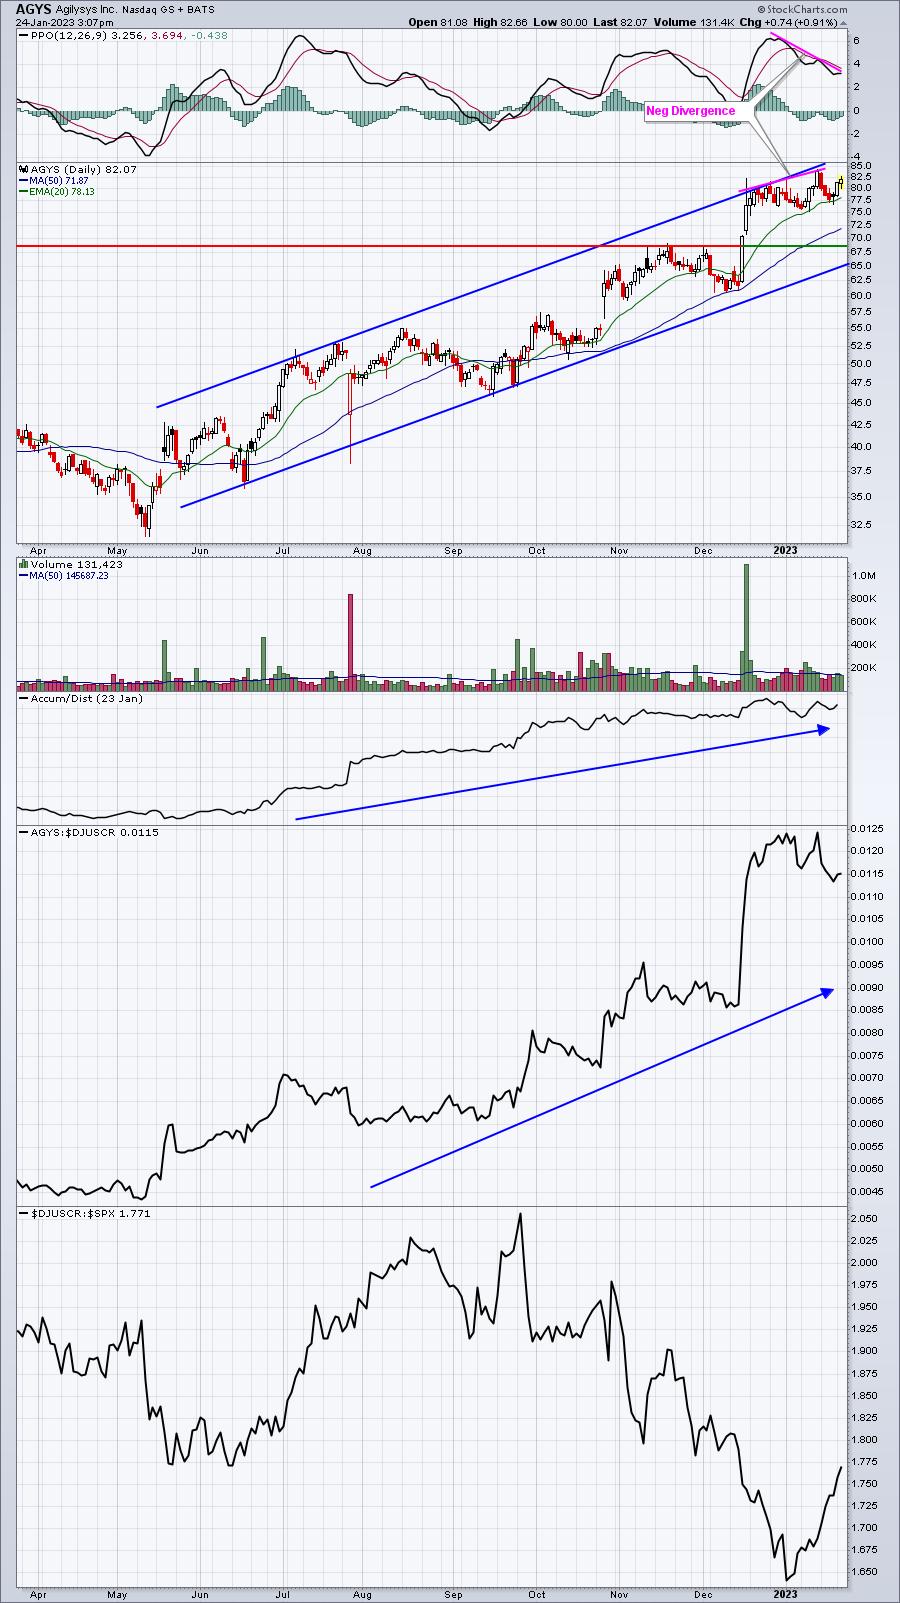
I'm convinced AGYS will report EXCELLENT quarterly results. I'm not so sure that it continues moving higher, though. AGYS has a negative divergence and already trades close to the upper trend line in its channel. It's quite possible that we see AGYS lose 10 bucks or more soon after earnings. I'll have patience, hope to see great results from AGYS and enter much cheaper. AGYS could simply fly higher from here, but the risk of owning it is VERY HIGH.
Earnings Reports
Here are the key earnings reports for the next two days, featuring stocks with market caps of more than $10 billion. I also include several companies with market caps below $10 billion. Finally, any portfolio stocks that will be reporting results are highlighted in BOLD. If you decide to hold a stock into earnings, please understand the significant short-term risk that you are taking. Please be sure to check for earnings dates for any companies you own or are considering owning.
Tuesday, January 24:
MSFT, JNJ, DHR, VZ, TXN, RTX, UNP, LMT, ISRG, GE, CNI, MMM, TRV, COF, HAL, PCAR, DHI, FFIV, IVZ, WAL, SLGN, GATX, NAVI, TRMK, AGYS, MRTN, VBTX, LRN, NXGN
Wednesday, January 25:
TSLA, ASML, ABT, NEE, T, IBM, BA, ELV, ADP, NOW, PGR, USB, CSX, FCX, LRCX, GD, NSC, HES, APH, KMB, LVS, TEL, AMP, NDAQ, URI, RJF, TTM, STLD, TDY, TER, TXT, AZPN, MKTX, PKG, STX, FLEX, WOLF, SEIC, CACI, XM, LEVI, AXTA, HXL, BPOP, AXS, CALX, PLXS, GPI, LBRT, EXTR, SLG, NG, BOOT, RES, CLS, LC
Economic Reports
None
Happy trading!
Tom