
EB Daily Market Report - Wednesday, January 25, 2023
ChartLists
I know many of you have sent in questions to support, asking about the ChartLists that I discussed in yesterday's DMR. They have all been updated on our website now. We apologize for the delay.
Live Trading Room
We will be hosting our first-ever LIVE trading room on Friday. It'll all get started, however, on Thursday evening at 7:00pm ET as I show you how I prepare for the trading day ahead. If you're going to trade, you need to be prepared. Too many traders wake up in the morning, look at stocks after the open, and THEN decide where they want to invest their money. At that point, however, I believe it's too late. Emotions take over and you trade based on price action, rather than managing risk by trading ONLY at appropriate price levels.
We'll have market conditions, earnings reports, economic reports, technical breakouts/breakdowns, relative strength, and many other factors to consider on Thursday evening.
This event is FREE to all ANNUAL members of EarningsBeats.com. If you're currently a trial member or a monthly member, you can upgrade to ANNUAL membership at any time prior to Thursday's 7:00pm ET start time and join us at no additional cost. It should be an eye-opening and educational event for sure. I hope to see you there!
If you would like to upgrade and attend, be sure to write us at "[email protected]" and we'll take care of the rest!
Executive Market Summary
- Futures were down considerably after a slew of not-so-great earnings reports
- All of our major indices opened lower and the selling accelerated in the first hour (amateur hour)
- We have seen a HUGE rally off those morning lows, however, and the Dow Jones and S&P 500 are essentially flat
- The NASDAQ is underperforming, but after being down well over 2% earlier, it's now down just 0.22%
- Small caps ($SML, +0.26%) and mid caps ($MID, +0.30%) are higher on the session
- Financials (XLF, +0.66%) and consumer discretionary (XLY, +0.34%) are leading today
- Commodities are mixed and the 10-year treasury yield ($TNX) is flat at 3.46%
- Microsoft (MSFT, -0.61%) has been extremely volatile over the past 24 hours, initially jumping higher after hours yesterday, before opening more than 3% lower; it's battled back all day long and is nearly even
- MarketAxess Holdings (MKTX, +9.82%) is the best-performing S&P 500 stock after posting its latest quarterly results, beating both revenue and EPS estimates
- Buckle up because Tesla (TSLA, +0.58%) reports after the close today and its relative strength suggests that we be prepared for potentially bad news
Market Outlook
One important signal that I've discussed throughout 2022 and into 2023 is market manipulation. Gaps and early morning selling have routinely been followed by strength later in the trading session. I've also been watching intraday rotation between the QQQ and the SPY. Check out this chart and I'll explain it below:
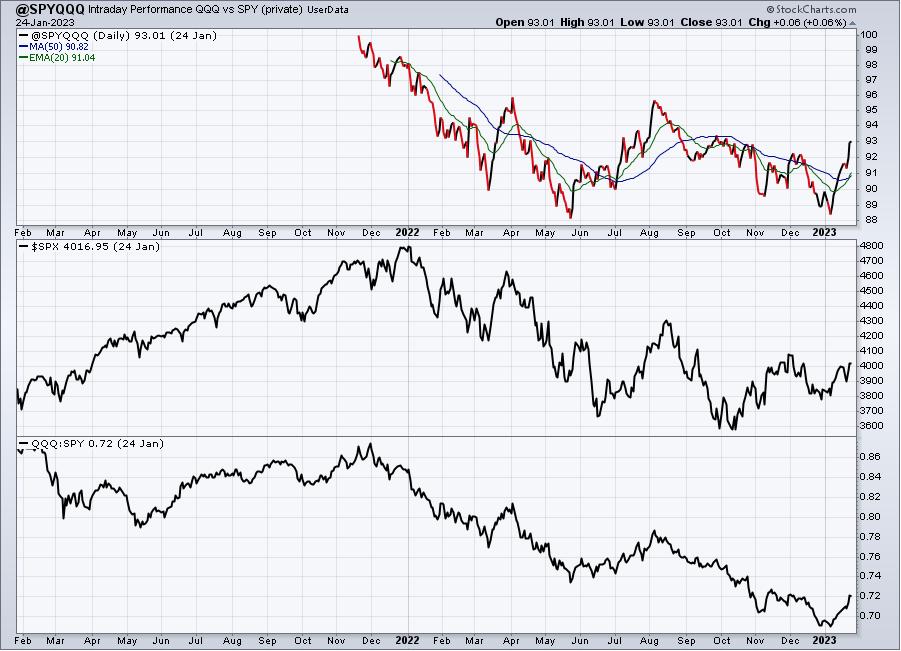
The three panels on this chart, from top to bottom, are as follows:
- The INTRADAY relationship between the QQQ and SPY
- The S&P 500
- The daily relationship between the QQQ and SPY
Let me make one thing perfectly clear. Even though this chart is labeled "@SPYQQQ" at the top left corner, the intraday calculation is that of the QQQ:SPY, but ignoring opening gaps. The purpose is to visualize the rotation that has taken place between the QQQ and SPY during the trading day and ignoring gaps. The thing I find most interesting on this chart is that the QQQ:SPY daily ratio (bottom panel) has seen two lower lows since the May 2022 low. But in the top panel, the intraday QQQ:SPY has not moved below that May 2022 low. I have argued since mid-year that money is rotating into the more aggressive stocks and that is a signal that things are going to improve. It's just one signal, but it's an important one, in my view.
The second point here is that the intraday QQQ vs. SPY chart (again, top panel) is soaring this month. Money is POURING into the more aggressive QQQ and January tends to be an excellent barometer for the entire year's performance. I like what I'm seeing.
Sector/Industry Focus
Hotels ($DJUSLG) are a part of the consumer discretionary sector (XLY) and the group is making a significant breakout today:
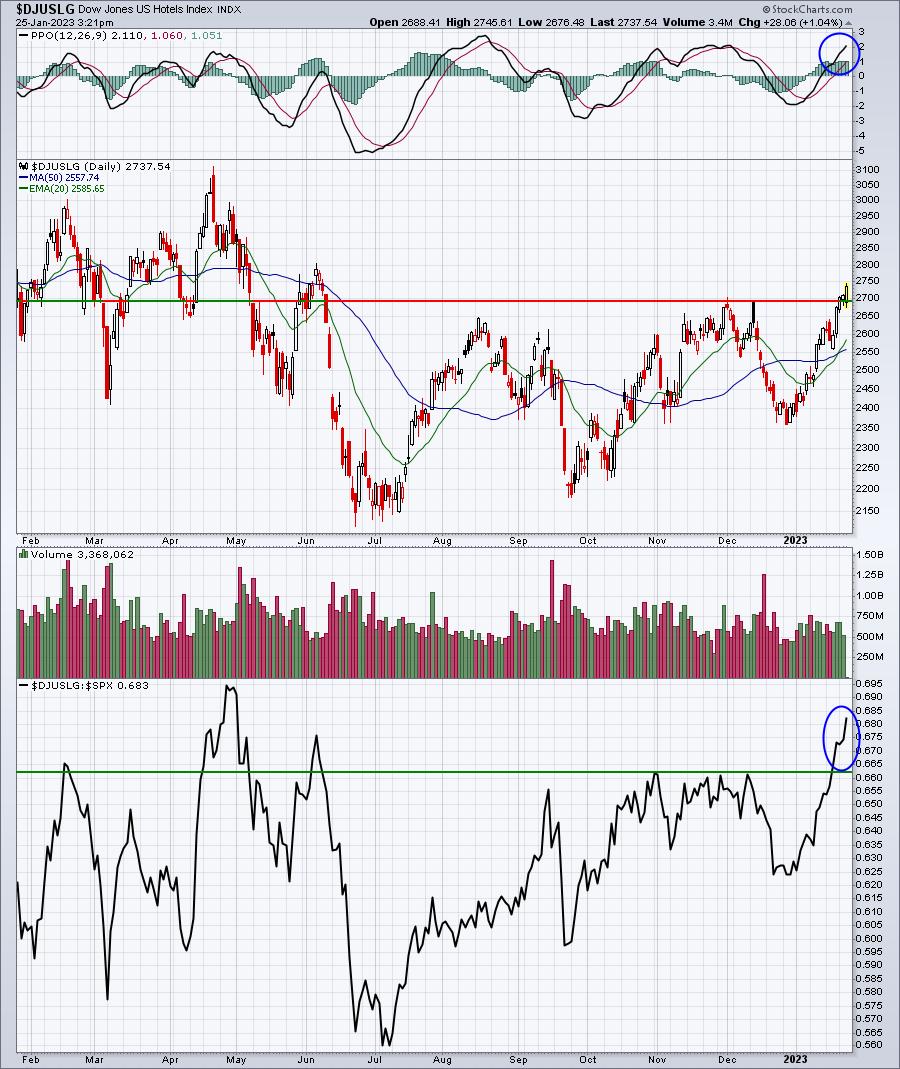
If you're a short-term trader, I cannot overemphasize how important relative strength is. At our live trading session on Friday, I'll be specifically looking to enter trades based on hot industry groups. Hotels will certainly qualify.
ChartLists/Strategies
I like 20-day EMA tests as entry points on healthy stocks. My only problem with jumping on many of these tests now is that we have yet to confirm the cyclical bear market bottom by clearing trend line resistance on the S&P 500. So I remain, for now, in a cautiously bullish stance. I'm okay trading healthy stocks on 20-day EMA tests, but I'd consider keeping my position sizes relatively small, so that whipsaw and failures don't take big chunks of capital. To highlight what I like to see, however, check out these two 20-day EMA tests:
PWSC (from the Strong AD ChartList):
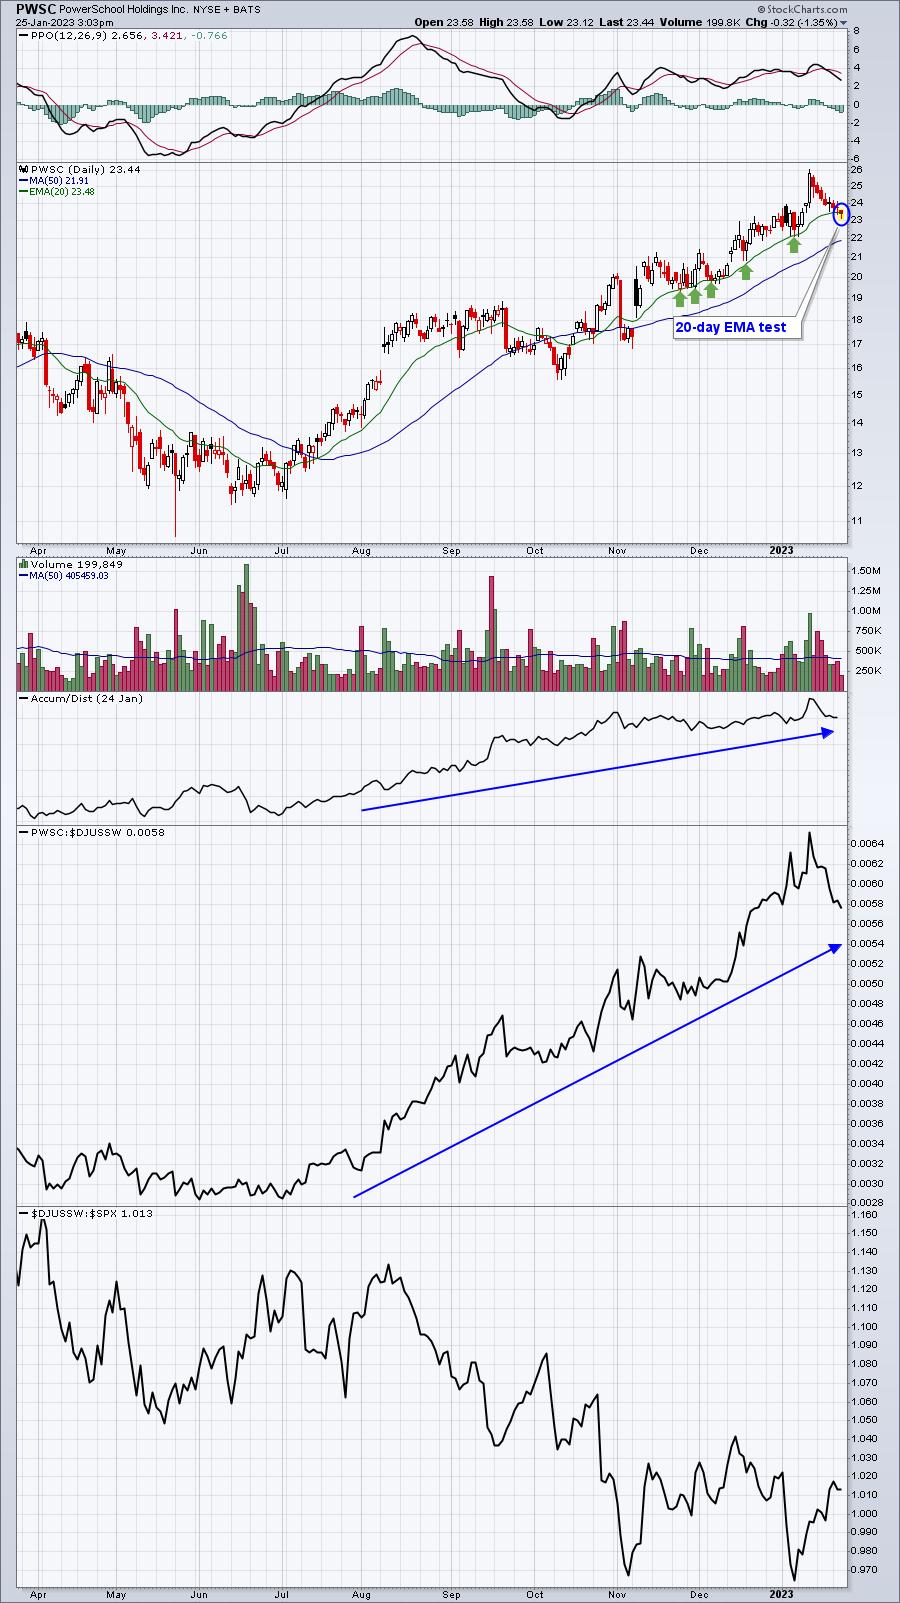
There have been many successful tests along the rising 20-day EMA, and that helps to provide me confidence to make this trade. If it fails to hold at today's close, I can exit with hopefully just a minor loss.
PI (from Raised Guidance ChartList):
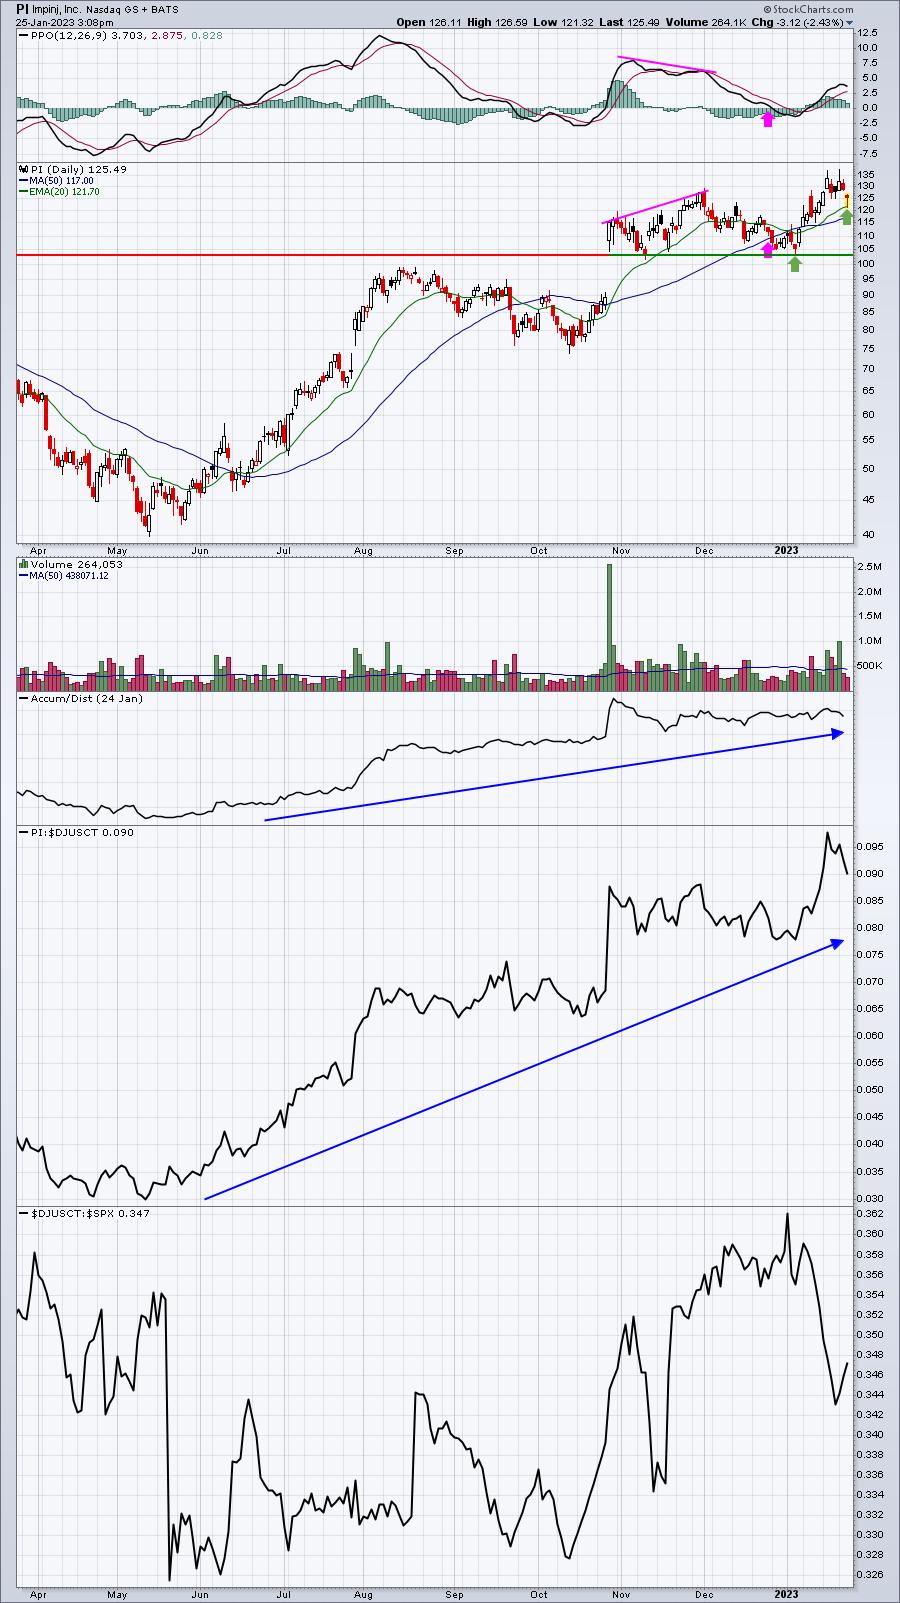
After the negative divergence printed, we saw PI fall back to test both its PPO centerline for a "reset" and its 50-day SMA (pink arrows). That's exactly what I look for after a negative divergence emerges. Once there's a reset, anything can happen. But now we have a level playing field. The first green arrow highlights a test of price support. Clearly, that was a great entry point. Now we have another uptrend on our hands and the PPO is sprinting higher. Typically, pull backs to test the rising 20-day EMA is what I look for here. That occurred today with PI's intraday low of 121.32. It happened just after the opening bell and it's very difficult to catch these types of 20-day tests, unless you're physically watching this stock at the opening bell OR you have limit orders in at your brokerage.
Earnings Reports
Here are the key earnings reports for the next two days, featuring stocks with market caps of more than $10 billion. I also include several companies with market caps below $10 billion. Finally, any portfolio stocks that will be reporting results are highlighted in BOLD. If you decide to hold a stock into earnings, please understand the significant short-term risk that you are taking. Please be sure to check for earnings dates for any companies you own or are considering owning.
Tuesday, January 24:
MSFT, JNJ, DHR, VZ, TXN, RTX, UNP, LMT, ISRG, GE, CNI, MMM, TRV, COF, HAL, PCAR, DHI, FFIV, IVZ, WAL, SLGN, GATX, NAVI, TRMK, AGYS, MRTN, VBTX, LRN, NXGN
Wednesday, January 25:
TSLA, ASML, ABT, NEE, T, IBM, BA, ELV, ADP, NOW, PGR, USB, CSX, FCX, LRCX, GD, NSC, HES, APH, KMB, LVS, TEL, AMP, NDAQ, URI, RJF, TTM, STLD, TDY, TER, TXT, AZPN, MKTX, PKG, STX, FLEX, WOLF, SEIC, CACI, XM, LEVI, AXTA, HXL, BPOP, AXS, CALX, PLXS, GPI, LBRT, EXTR, SLG, NG, BOOT, RES, CLS, LC
Thursday, January 26:
V, MA, CMCSA, SAP, INTC, MMC, NOC, SHW, BX, KLAC, VLO, ADM, AJG, DOW, NUE, STM, XEL, LHX, RMD, ROK, TROW, NOK, WY, TSCO, LUV, MKC, WRB, FICO, EMN, AAL, EWBC, KNX, CFR, RHI, WBS, OLN, ORI, MUR, ALK, SSB, VLY, EXP, GBCI, APPF, VIRT, CNX, JBLU, XRX, AX, NTCT, CRS, HTH, MBLY,
Economic Reports
None
Happy trading!
Tom