
EB Daily Market Report - Wednesday, February 1, 2023
Seasonality and Short Reports
The February Seasonality Report should be out later today or possibly tomorrow, and our corresponding ChartList should be on our website by Thursday at the close. I'll also be producing our February Short Report, which should be ready tomorrow.
Looking at seasonality, January performance was outstanding as our average January gain among the 20 seasonality stocks provided was 9.82%, just slightly below the QQQ's gain of 10.64% and well above the SPY's gain of 6.29%.
For February performance, ENPH, ETSY, BKNG, FTNT, CF, and FCX are among the best on the S&P 500 and/or NASDAQ 100.
Executive Market Summary
- Futures were down slightly overnight and our major indices gapped lower
- While prices remain in the red, for the most part, growth (IWF, -0.32%) does have the upper hand over value (IWD, -0.59%)
- The NASDAQ is also outperforming both the S&P 500 and the Dow Jones
- The falling 10-year treasury yield, down 6 basis points to 3.47%, could be partly responsible for the slightly better performance of growth
- 10 of 11 sectors are down, though technology (XLK, +0.00%) is showing a bit of resiliency
- Energy (XLE, -2.68%) is today's biggest sector loser, as crude oil ($WTIC, -3.09%) falls back near $76 per barrel
- Earnings continue to drive individual stock prices as Advanced Micro Devices (AMD, +8.40%) reacts positively to its earnings report
- Meanwhile, Electronic Arts (EA, -11.84%) is among the worst-performing S&P 500 companies after posting its latest quarterly results
- Finally, it's Fed Day as the FOMC policy statement will be provided momentarily
Market Outlook
Well, January 2023 is in the books and it was the 9th best January since 1950, placing it in "Quadrant 1", which represents the 19 best Januarys. The best-performing Januarys are typically followed by strong "balance of year" performance (February through December). Of the other 18 Januarys, the average balance of year performance was +15.27%. Given the S&P 500 close yesterday at 4036.22, a 15.27% balance of year return would send the S&P 500 to 4652.46, not too far from my year end 2023 target of 4700.
Meanwhile, the NASDAQ's January gain of 10.68% ranks as the 8th best January since 1971, also placing it in Quadrant 1. The NASDAQ's average balance of year return in Quadrant 1 is +14.42%. Doing the math, if 2023's balance of year is simply average, the NASDAQ would close out 2023 at 13,254.81.
Finally, if we assume that the October low of 3491.58 was the ultimate bottom of the 2022 cyclical bear market, then history tells us the average 1-year return from a cyclical bear market bottom is +42.50%. Again, doing a little math, that would project the S&P 500 at 4975.50 on October 13th, 2023, which would be the 1-year anniversary of the October 2022 low. Of course, if the S&P 500 moves to a new low in 2023, then all of this is a moot point.
Regardless, I'm a fan of stock market history and I do believe that history repeats, or at least resembles, itself.
Getting back to the here and now, as I look at the S&P 500 with the Fed announcement coming up in minutes, I believe the most critical short-term levels are 4110 (price resistance) to the upside and 3989 (rising 20-day EMA) to the downside. Anything in this range really does not change the technical picture. It would be a lot of noise, of course, and the media will have a blast if we sell off again following the Fed's comments, but it literally will not change my technical opinion one bit. So try not to get too emotional during a period when it's very easy to do.
Sector/Industry Focus
Delivery services ($DJUSAF) appears to be a very critical level of gap and price resistance:
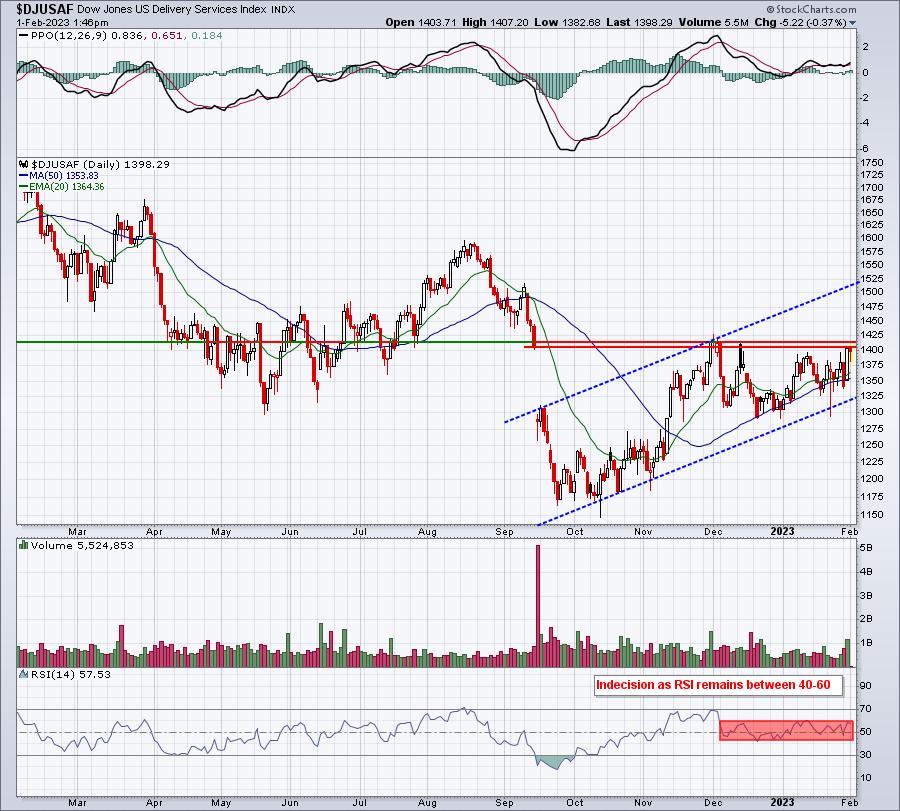
The DJUSAF has been trending beautifully off the October low, but the 1400-1425 area has been difficult to negotiate. Should we see a breakout, FedEx (FDX) has been showing renewed strength and would likely benefit.
ChartLists/Strategies
I follow the daily Upcoming Earnings ChartLists rather closely now as the number of earnings reports are increasing exponentially and it's a very organized way of looking at the companies that have just reported quarterly results in the past 24 hours. One stock that looks very good to me is Owens Illinois, Inc. (OI). First, let's look at the daily chart:
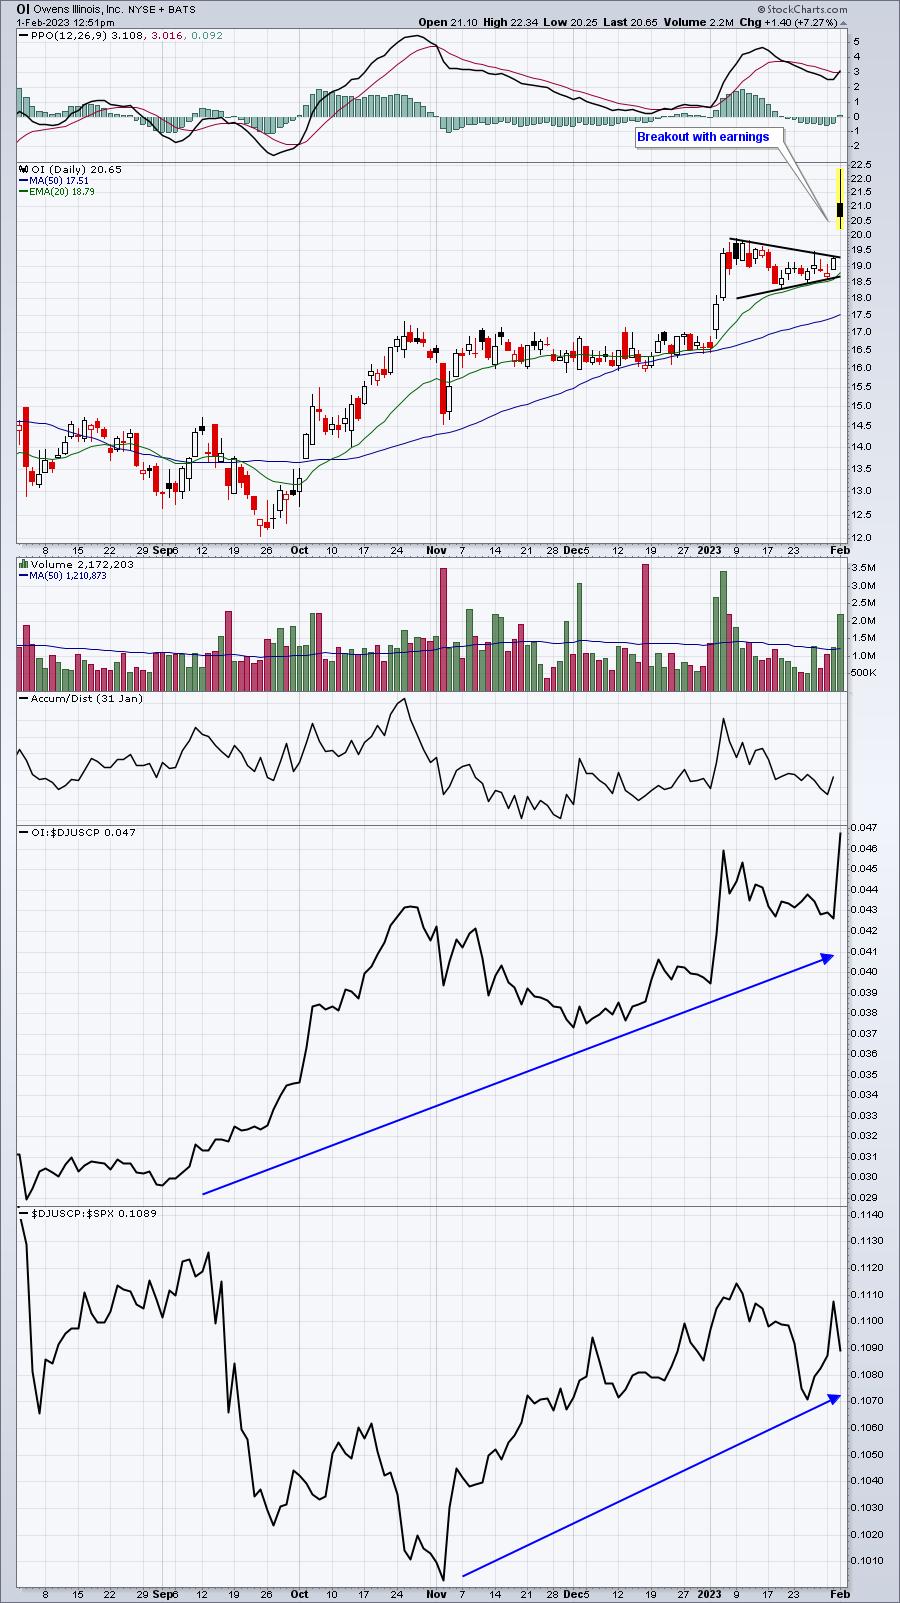
OI is a leading stock within an improving industry - containers & packaging ($DJUSCP). The short-term might be a little dicey, simply because of the volatility that surrounds earnings, but I feel even better about OI after looking at a longer-term weekly chart:
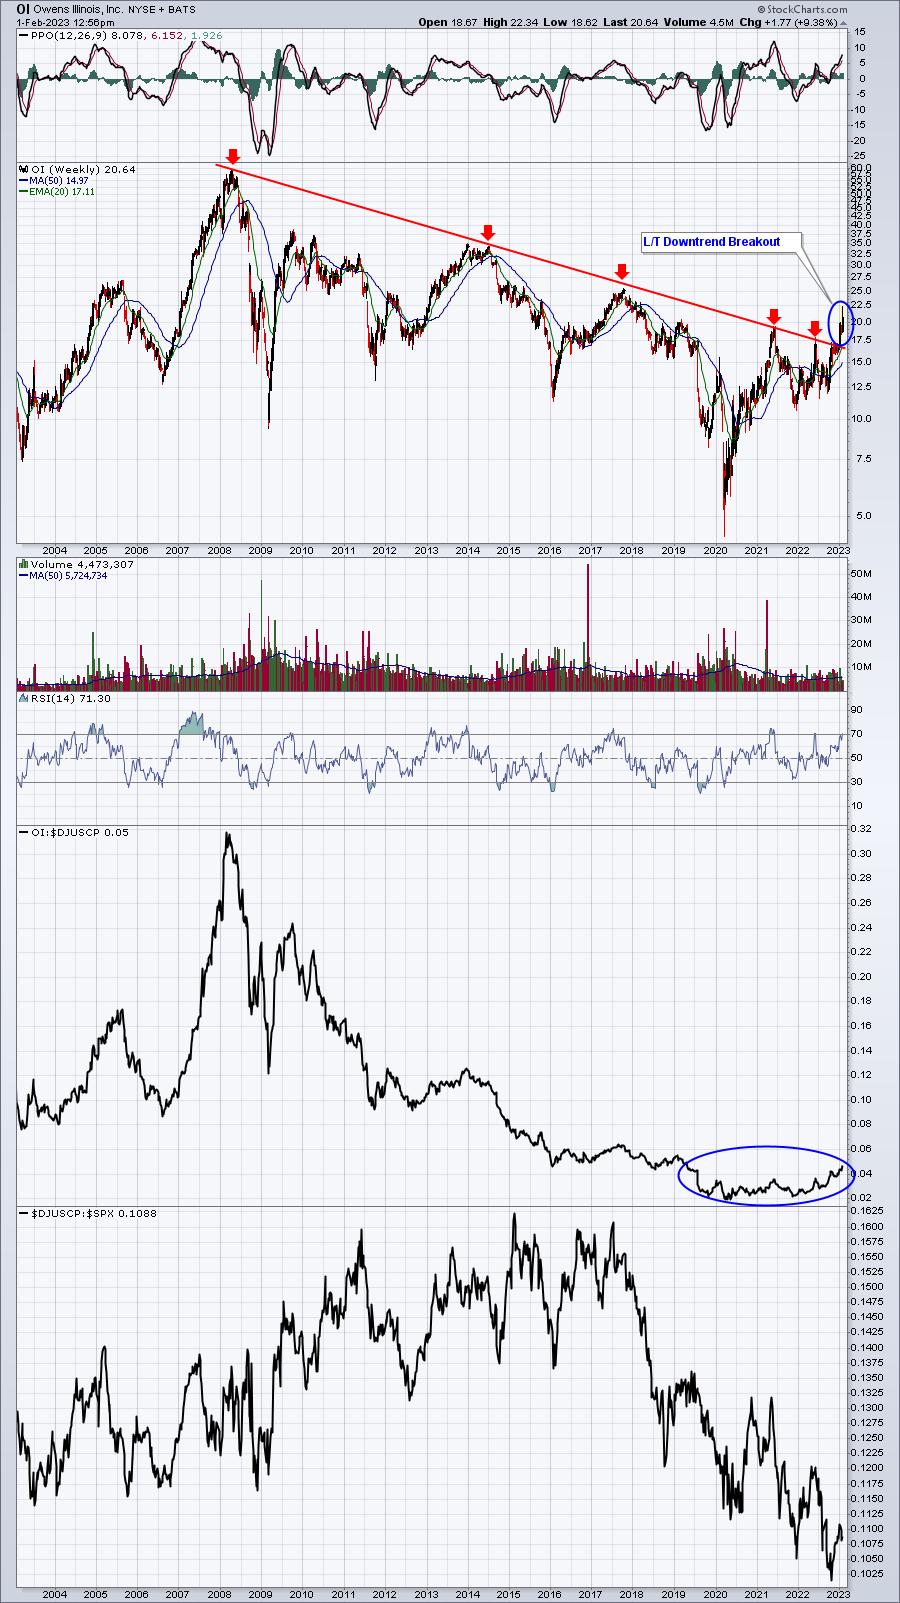
While the recent daily breakouts look compelling short-term, OI has just broken a 15-year downtrend line, which suggests this rally and relative strength could just be beginning.
Earnings Reports
Here are the key earnings reports for the next two days, featuring stocks with market caps of more than $10 billion. I also include several companies with market caps below $10 billion. Finally, any portfolio stocks that will be reporting results are highlighted in BOLD. If you decide to hold a stock into earnings, please understand the significant short-term risk that you are taking. Please be sure to check for earnings dates for any companies you own or are considering owning.
Wednesday, February 1:
META, NVO, TMO, NVS, TMUS, SONY, MO, GSK, BSX, WM, HUM, EPD, SCCO, MET, MCK, JCI, CTVA, AFL, ODFL, ALL, OTIS, ABC, FTV, ALGN, HOLX, GIB, MAA, MKL, PTC, AFG, GL, CHRW, QRVO, DT, CHX, DXC, LFUS, LSTR, MUSA, SLAB, SLM, PTON, MTH, MXL, ELF, KLIC, SITM, CCS, CSGS, EAT, VSTO, MHO, ALGT, CLB, CMC
Thursday, February 2:
AAPL, GOOGL, AMZN, LLY, MRK, BMY, COP, QCOM, HON, SBUX, GILD, EL, BDX, ITW, APD, ABB, ICE, F, RACE, HSY, BCE, MCHP, PH, MFG, TT, TEAM, CTSH, AME, APTV, WEC, GWW, DB, HIG, RCI, CNHI, SIRI, CAH, LPLA, CMS, BALL, BR, CLX, TW, DGX, BIP, AVY, GEN, SNA, CPT, SWK, TECH, BILL, PCTY, DECK, MMP, RGA, OTEX, LEA, MANH, WMS, DLB, SKX, BERY, X, HOG, WWE, BYD, BC, COLM, SIGI, POST, PENN, CRUS, SYNA, MTSI, LAZ, FCFS, MEO, MSTR, HUBG, LSPD, VIAV, GOOS, MWA, SBH
Economic Reports
January ADP employment: 106,000 (actual) vs. 158,000 (estimate)
January ISM manufacturing: 47.4 (actual) vs. 48.0 (estimate)
December construction spending: -0.4% (actual) vs. -0.1% (estimate)
FOMC meeting concludes with policy statement due at 2:00pm ET
Happy trading!
Tom