
EB Daily Market Report - Friday, February 3, 2023
Seasonality and Short Reports
The February Seasonality Report and February Short Report have been published, and their respective ChartLists have been updated as well. Both ChartLists should be available for viewing/downloading later this afternoon on our website.
I'll be shifting my attention over the next few days to updating many of our ChartLists, including the following:
- Strong Earnings ChartList (SECL)
- Strong Future Earnings ChartList (SFECL)
- Strong AD ChartList (SADCL)
- Raised Guidance ChartList (RGCL)
- Bullish Trifecta ChartList (BTCL)
Executive Market Summary
- Futures were down significantly overnight and at the opening bell
- Apple (AAPL, +3.08%), Amazon.com (AMZN, -7.32%), and Alphabet (GOOGL, -2.36%) offered mixed results and these were 3 critical quarterly earnings reports
- January nonfarm payrolls were released and were WAY above expectations, jumping 517,000, while consensus estimates had the number pegged at 187,000
- The hot jobs number sent the 10-year treasury yield ($TNX) soaring to a high of 3.55%; it remains up 13 basis points to 3.53% at last check
- Strong job growth and falling inflation expectations are NIRVANA for equity prices and don't believe anyone who says otherwise; thus, today's action is nothing more than a "sell on the news" type of reaction
- Crude oil ($WTIC, -2.94%) is down more than 2 bucks per barrel to $73.50
- The falling crude prices surprisingly have had no impact on energy shares (XLE, +0.01%), which is the only sector in positive territory today
- Consumer discretionary (XLY, -2.57%) is particularly weak, reflecting the poor reaction to AMZN's earnings
- Ford (F, -7.37%) is one of today's weakest S&P 500 stocks after reporting weak quarterly results
Market Outlook
A historical bullish period comes to an end today (January 26 through February 3) and we've also just had a lot of fundamental information unleashed in the form of key earnings - AAPL, AMZN, and GOOGL - and nonfarm payrolls. I indicated yesterday that I intended to lower my exposure considerably for now as short-term risks were elevated. I remain VERY bullish, but my trading instincts are warning that we may have ended the "buy on rumor" period, and the "sell on news" has begun. First, let's look at the 60-minute chart of the QQQ:
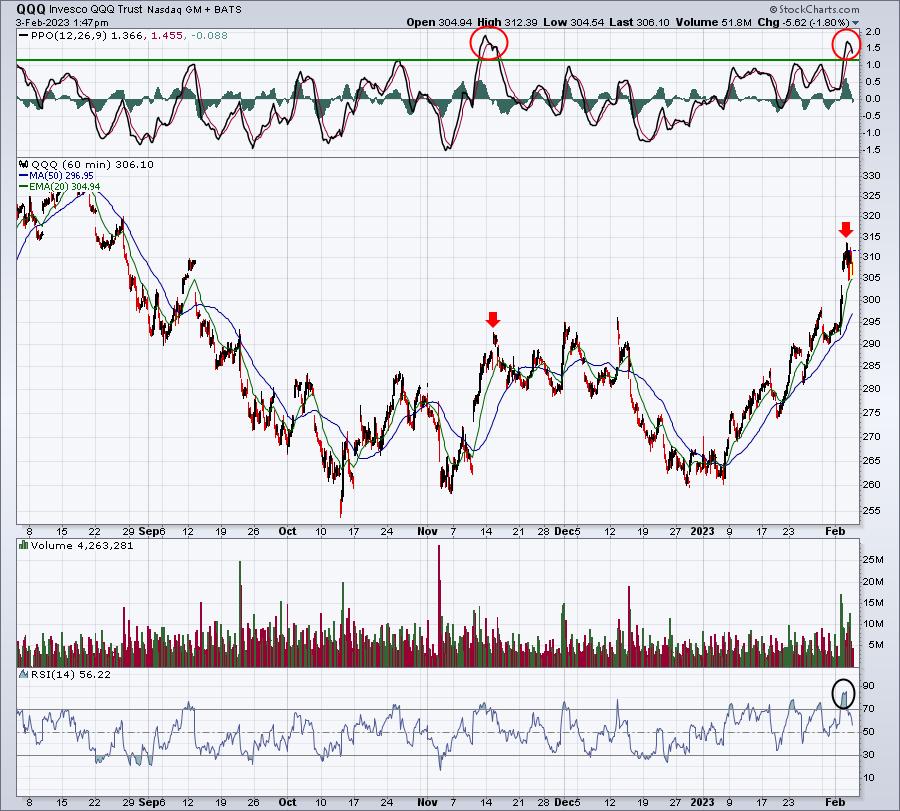
Over the past six months, the hourly PPO has only reached yesterday's level on one other occasion and the market struggled for a period of time afterwards. We could simply keep going higher, but I believe the risks are higher that we'll be flat to down from now through options-expiration Friday. If we're able to bounce off the rising 20-hour EMA and move back to a new high, it'll likely be accompanied by a nasty negative divergence. I think relaxing for a bit makes sense. Keep in mind that I'm speaking from a very short-term perspective. If you've been holding for a long period, believing that 2022 was a cyclical bear market, nothing has changed. I remain bullish for 2023, just recognizing that we could have issues in the near-term.
There are a few areas to watch for a possible reversal if, in fact, we do move lower. First up will be the bottom of gap support at 300.92. Then the recent breakout above 295.94 would be next. Finally, and most importantly, the rapidly-rising 20-day EMA, currently at 289.57.
Some bull market rallies, however, take no prisoners and are quite resilient. There's certainly a chance that we break out and keep moving higher. Sitting on the sidelines for a bit has risks of its own, so if you're someone that's not watching short-term action and want to make sure you're in to take advantage of higher prices down the road, then remaining invested now could make sense to you. It's up to each individual.
Sector/Industry Focus
When considering various asset classes, it likely makes sense to look at foreign markets. After years of underperforming the S&P 500, I believe we're going to see relative strength in many foreign markets for the foreseeable future. I've regularly indicated in the past that I'd stick entirely with US stocks, but when we begin to see significant relative breakouts in other countries, it's time to at least consider diversifying into those countries. Let's take a quick glance at long-term relative charts of three key countries, so that you can see the international rotation that's been taking place:
Germany ($DAX):
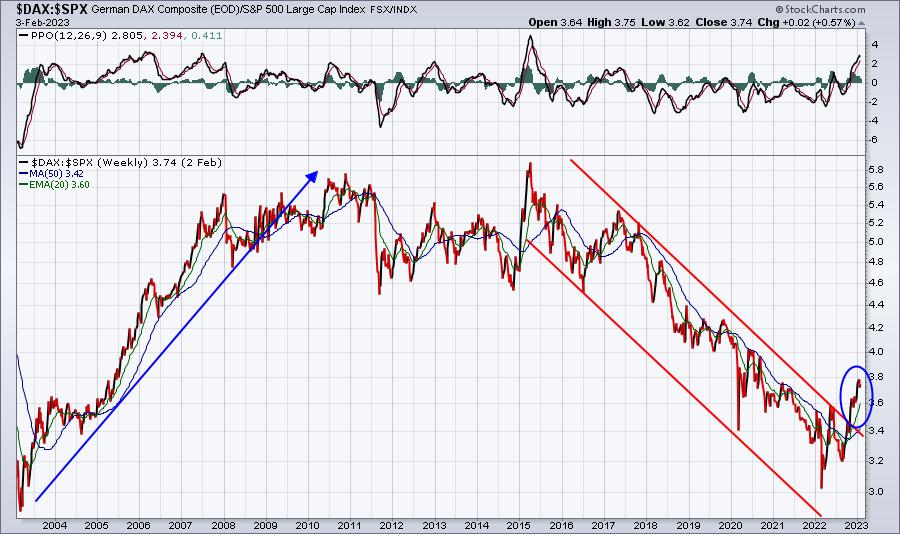
The relative downtrend here appears to be broken. Furthermore, the relative momentum (PPO) has reached its highest level since 2015. In other words, this relative strength in Germany appears to have legs.
Japan: ($NIKK):
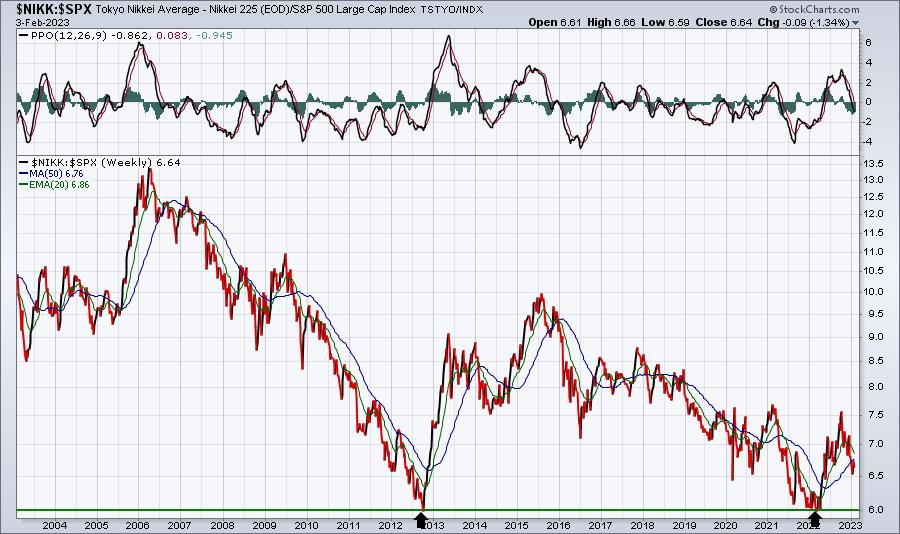
2022's relative strength looked promising, but the $NIKK has lost that strength over the past few months. I do like the double bottom (black arrows) in place, however. So long as that holds, I'd expect to see the $NIKK regain its relative strength at some point in 2023.
France ($CAC):
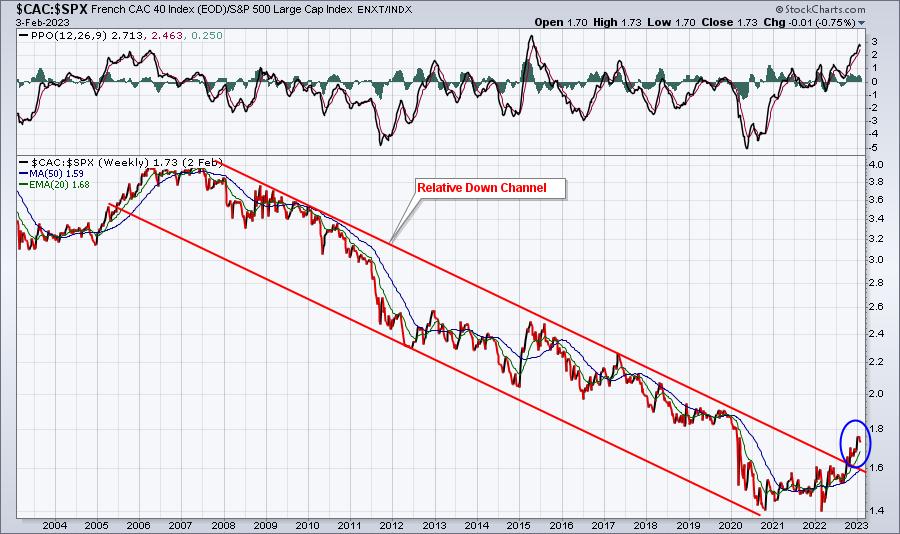
It's probably a bit early to call this a new uptrend in these countries, especially Japan, but it's not to early to at least consider a bit of diversification. Again, I've not been a fan of investing in foreign countries while they showed relative weakness vs. the US, but that at least appears as though it could be changing.
ChartLists/Strategies
Like I said, I'm content to watch the action for now as a bullish historical period concludes and our major indices are so overbought. We've had a tremendous ride higher thus far in 2023. If we see a brief pause, that wouldn't be a bad thing at all.
Earnings Reports
Here are the key earnings reports for the next two days, featuring stocks with market caps of more than $10 billion. I also include several companies with market caps below $10 billion. Finally, any portfolio stocks that will be reporting results are highlighted in BOLD. If you decide to hold a stock into earnings, please understand the significant short-term risk that you are taking. Please be sure to check for earnings dates for any companies you own or are considering owning.
Friday, February 3:
SNY, CI, REGN, AON, LYB, ZBH, CHD, UI, AVTR, CBOE, BEP, SAIA
Monday, February 6:
ATVI, SPG, IDXX, CMI, ON, TSN, TTWO, PINS, SWKS, CINF, L, UDR, ACM, CNA, ZI, NBIX, TFII, NOV, AMG, POWI, FN, RMBS, DIOD, VRNS, ENR, CHGG, KMT, KFRC
Economic Reports
January nonfarm payrolls: 517,000 (actual) vs. 187,000 (estimate)
January unemployment rate: 3.4% (actual) vs. 3.6% (estimate)
January average hourly earnings: +0.3% (actual) vs. +0.3% (estimate)
January ISM services index: 55.2 (actual) vs. 50.6 (estimate)
Happy trading!
Tom