
EB Daily Market Report - Tuesday, February 7, 2023
ChartList Updated
I've updated our Raised Guidance ChartList (RGCL) this afternoon and we should have our website updated later today or first thing in the morning.
My goal is to update the Strong AD ChartList (SADCL) tomorrow, although this one is very time-intensive, reviewing literally 1300-1500 charts, on average, deciding on the final 400-500 charts with the strongest AD lines.
Executive Market Summary
- Futures were mixed to slightly lower to begin the day
- We've seen outperformance in the NASDAQ over the other major indices
- The 10-year treasury yield ($TNX) is up 4 basis points, continuing its recent rise
- The Volatility Index ($VIX) has dropped nearly 4% as fear abates
- Energy (XLE, +2.68%) is leading all sectors today, with technology (XLK, +2.22%) close behind
- Crude oil prices ($WTIC, +4.22%) have jumped to $77 per barrel, igniting energy shares
- Defensive groups are retreating, led by consumer staples (XLP, -0.57%)
- Fed Chief Jay Powell spoke this afternoon, reiterating his belief that a period of disinflation has begun
- Skyworks Solutions (SWKS, +12.61%) is leading the S&P 500 after reporting strong quarterly results
Market Outlook
We're in a trading range after the recent surge, with overhead price resistance at recent price highs, while the rising 20-day EMA provides us our strongest short-term support level. Today's intraday moves have been substantial as traders reacted to Fed Chief Powell's comments just after 12:30pm ET. Check out this 5-day, 10-minute chart:
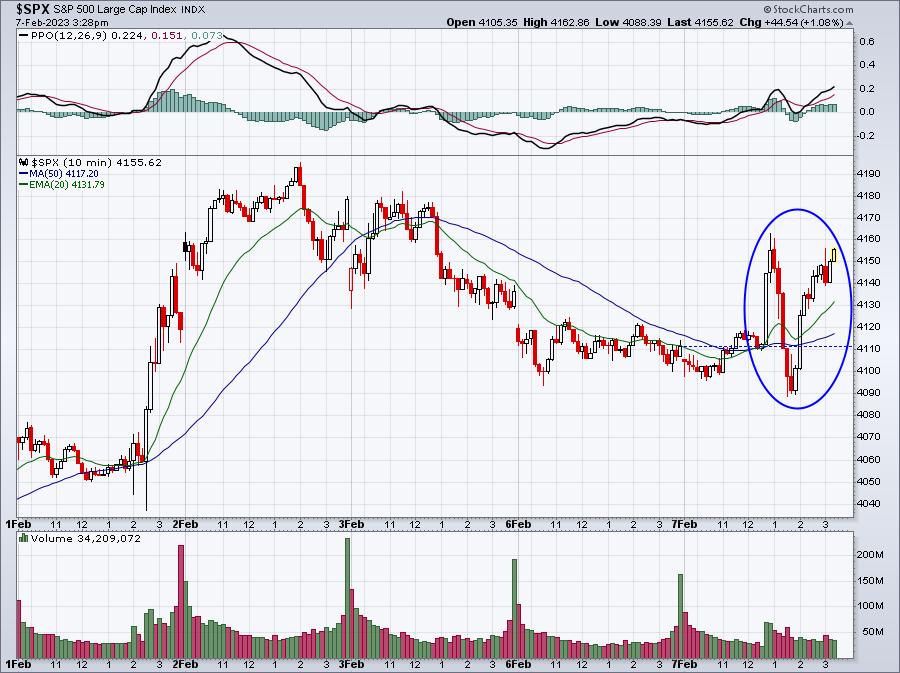
It's been a wild afternoon, but once again, we see the bulls seem to have the upper hand as the market tries to close on its highs of the session.
Sector/Industry Focus
Energy (XLE) has been volatile of late, with plenty of back and forth action, but have we just completed the "D" in an "A-B-C-D-E" ascending triangle pattern? What do you think?
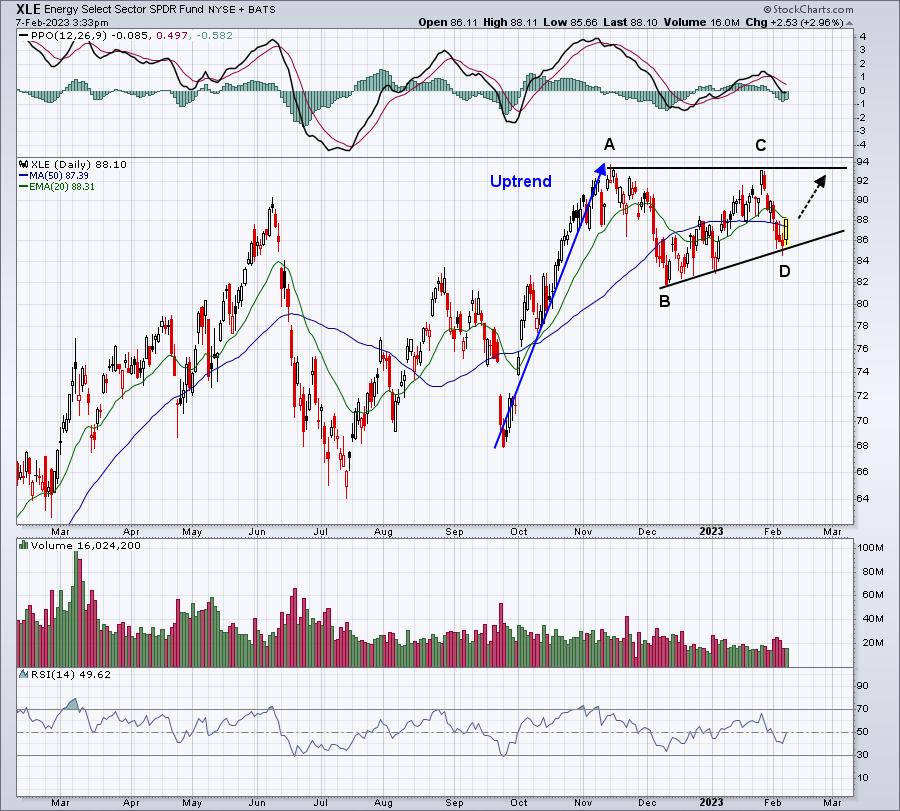
If we're in the process of finalizing this continuation pattern, then energy bulls unite. An ultimate breakout would measure to 104-105 in time.
ChartLists/Strategies
I love to trade earnings gaps and I want to show you two examples of what to look for. The first key is a very positive response to its quarterly earnings report on heavy volume. I generally like to buy the stock if it returns to its opening price after earnings. Check these out - they triggered today:
TT:
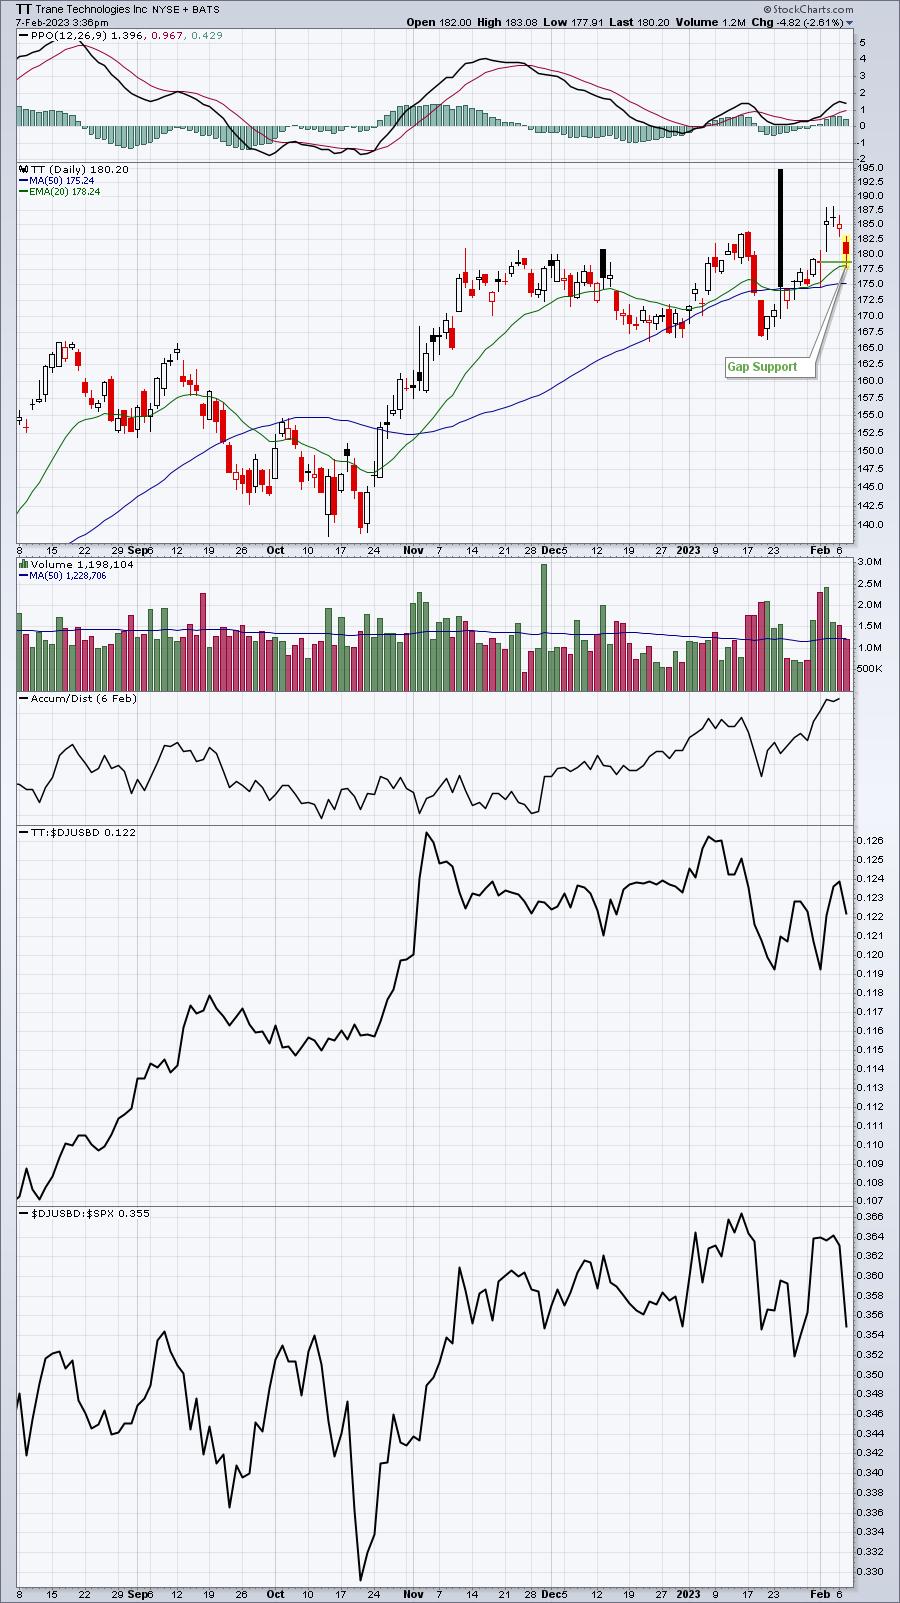
TT tested both gap support and its 20-day EMA today. Entering with a tight closing stop below 177.50-178.00 would make sense to me.
ITW:
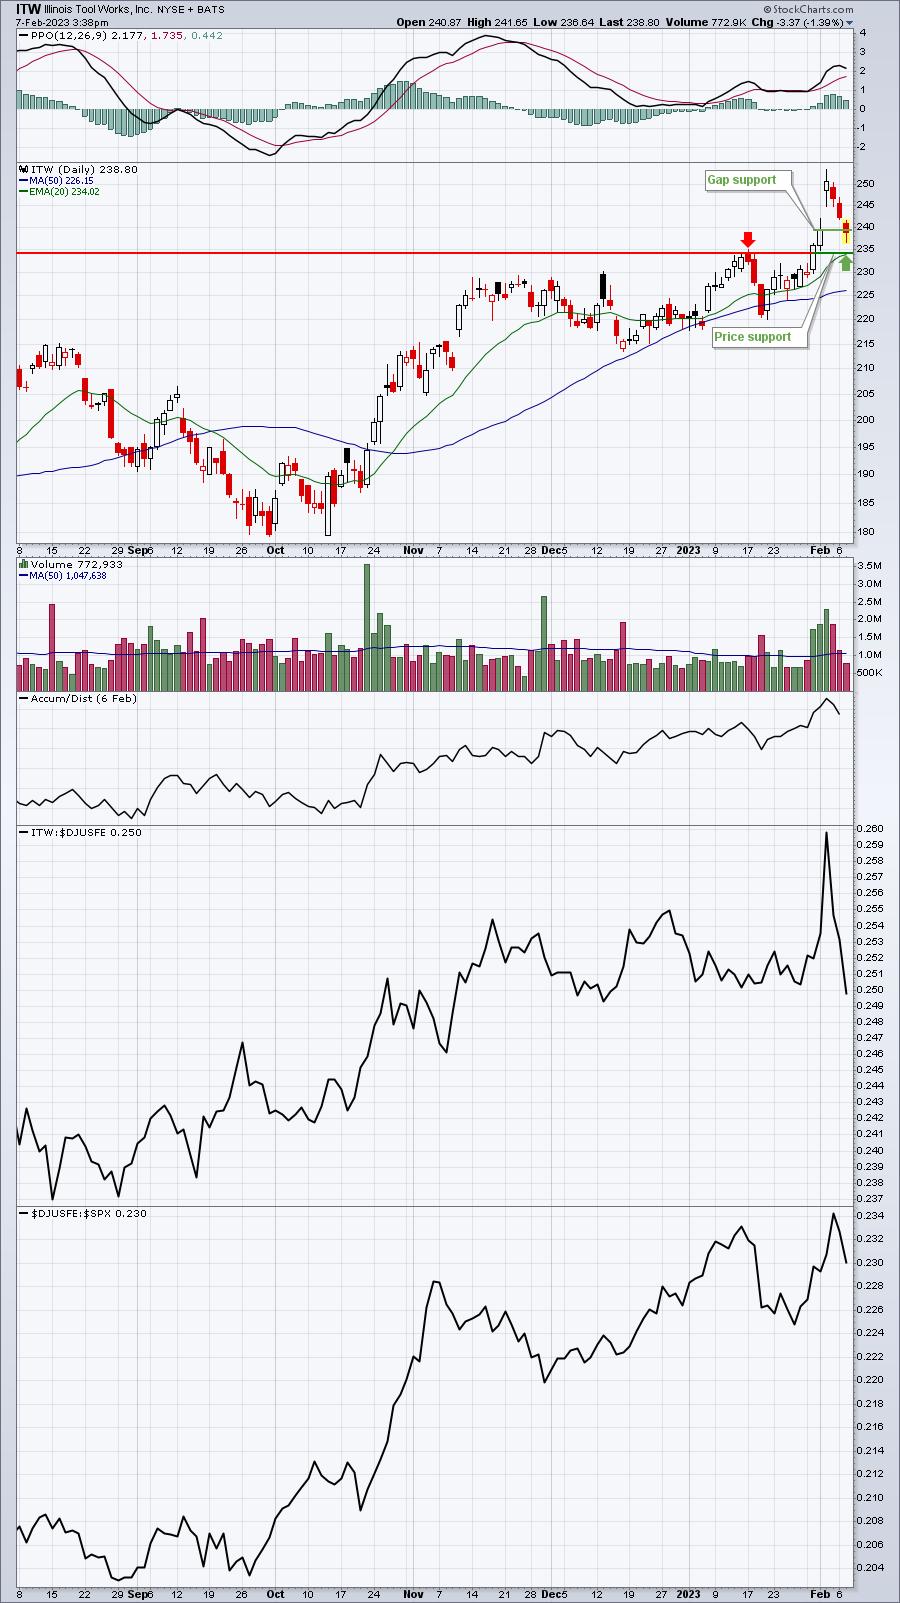
Gap support down to price support and the 20-day EMA would seem like a solid area to accumulate shares in ITW.
Earnings Reports
Here are the key earnings reports for the next two days, featuring stocks with market caps of more than $10 billion. I also include several companies with market caps below $10 billion. Finally, any portfolio stocks that will be reporting results are highlighted in BOLD. If you decide to hold a stock into earnings, please understand the significant short-term risk that you are taking. Please be sure to check for earnings dates for any companies you own or are considering owning.
Tuesday, February 7:
LIN, BP, VRTX, FISV, KKR, ITUB, CMG, FTNT, CNC, CARR, TDG, PRU, DD, ILMN, ENPH, IT, YUMC, PAYC, XYL, INCY, OMC, AMCR, RCL, ATO, FMC, J, SSNC, ESS, PEAK, CG, JKHY, CSL, VFC, ARMK, QGEN, CCK, CTLT, ARCC, AGCO, INSP, GPK, AIZ, VOYA, NVT, HTZ, EHC, HRB, WU, TENB, FRSH, RRR, NEWR, ADNT, HAE, WFRD, SPR, WERN, MAC, CNO, SIMO, HAIN, RAMP, NBR, MODN, ATEN
Wednesday, February 8, 2023
DIS, CVS, UBER, ETN, CME, EMR, D, ORLY, YUM, SLF, IFF, EFX, CDW, AVB, STE, MPWR, FOXA, MOH, FOX, FLT, MGM, TRMB, BG, BAM, UHAL, RE, EQH, REXR, TEVA, WYNN, CDAY, NLY, HOOD, PFGC, CPRI, MAT, REYN, LNC, UAA, AFRM, XPO, APP, ASGN, ACLS, AEIS, VSH, GT, PI, RPD, FROG, SONO, FORM, APPS, CRNC
Economic Reports
None
Happy trading!
Tom