
EB Daily Market Report - Monday, February 13, 2023
Updated ChartLists
I was able to update nearly all of our regularly-updated ChartLists this weekend. Those that are now available for download/viewing on our website include:
- Strong Earnings ChartList (SECL)
- Strong Future Earnings ChartList (SFECL)
Three more ChartLists were updated today and should be available later today or first thing tomorrow morning. These include:
- Raised Guidance ChartList (RGCL)
- Bullish Trifecta ChartList (BTCL)
- Short Squeeze ChartList (SSCL)
If you have any problems or questions, please reach out to us at "[email protected]".
Executive Market Summary
- Futures reversed overnight and turned higher, resulting in a solid gap higher for our major indices
- Aggressive areas are performing fairly well, a bit surprising given that February options expire this Friday
- The 10-year treasury yield ($TNX) is down 2 basis points to 3.72% today after rising much of the last 7-10 days
- Commodities are mixed today, while cryptocurrencies are not participating in the overall advance; etherium ($ETHUSD, -3.11%) has fallen back below $1500 for the first time in a month
- Technology (XLK, +1.65%) and communication services (XLC, +1.60%) are leading U.S. stocks higher
- All 11 sectors are higher on the session, reflecting a broad-based advance
- Microsoft (MSFT, +3.27%) is the best-performing Dow Jones component stock, lifting that index
- The January CPI report will be out tomorrow morning at 8:30am ET; that's resulted in a higher VIX, despite the rising equity prices
Market Outlook
Over one year ago at MarketVision 2022, I suggested the stock market's biggest issue was the outrageously bullish options world, where we saw equity-only put-call ratios repeatedly in the 0.35 to 0.45 range. The 253-day EMA (1 year) of this ratio had reached an extremely low level and was just beginning to turn back higher. That is a very important sentiment signal that suggested we'd see serious "pain ahead". Note to Fed Chief Jerome Powell: It's actually better to call for "pain ahead" BEFORE it begins rather than after stock prices have already tumbled 20-25%. Jus sayin'. :-)
A very bullish development is now taking place with sentiment. That 253-day SMA, which rose throughout 2022, has just now begun to roll back over and this signal typically accompanies the start of a very significant rise in equity prices. Don't be shocked to see the S&P 500 in the 5500-6000 range sometime in 2024, potentially close to 50% higher. I'm not necessarily predicting next year's price action, just stating my opinion based on many years of historical research. Several different angles would take me to this range.
Here's the 253-day moving average of the equity-only put-call ratio ($CPCE) on StockCharts unadjusted:
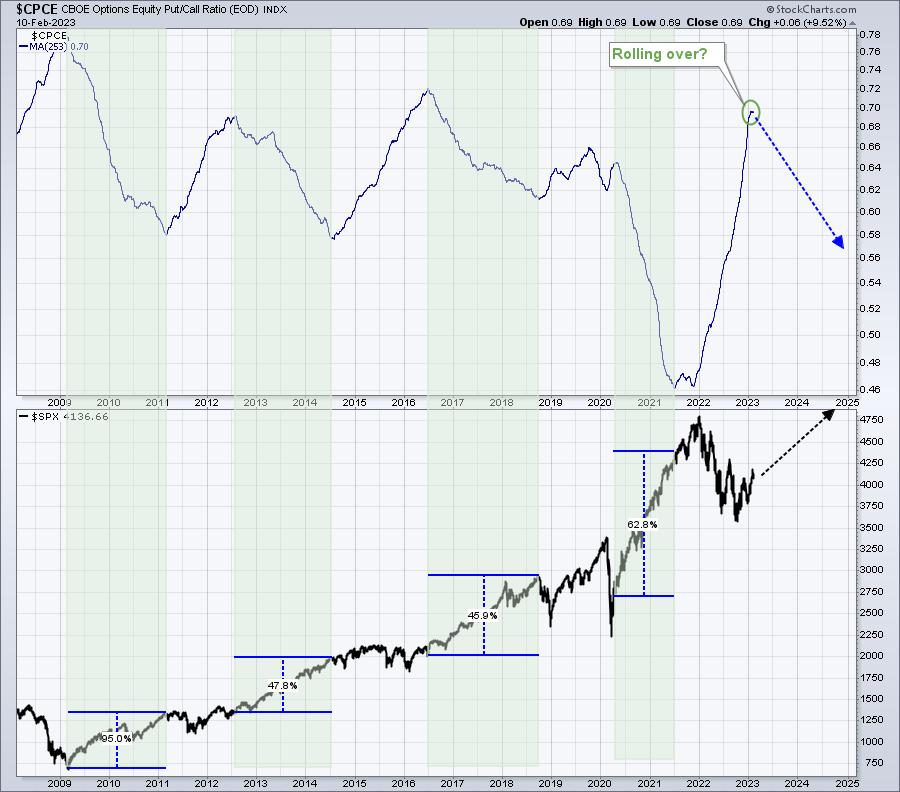
I said "unadjusted", because there were several overstated CPCE readings on StockCharts.com in November and December 2022. It's certainly not their fault as they are simply reporting the data from the CBOE. However, the CPCE is designed to track how retail traders are approaching the market. For probably 10-12 different days in late 2022, the CPCE reflected huge equity puts bought mid-day that reflected "hedging" against some of the biggest NASDAQ names like AAPL, MSFT, GOOGL, etc. I estimated the impact of those professional hedging trades to more clearly reflect the behavior of retail traders. I've calculated the current reading of the 253-day SMA to be closer to 0.66. Those "adjusted" CPCE readings suggest that the roll over of the 253-day SMA has begun. As this 253-day SMA moves lower in coming months, that has a long history of accompanying a significant rise in U.S. equity prices. I expect the same to occur later in 2023, even if we have choppy action temporarily and through the balance of the 2023 Q1.
Sector/Industry Focus
We're seeing another successful test and bounce off the rising 20-day EMA for banks ($DJUSBK). I'd like to see this group remain bullish as a strong banking sector suggests an economy that's not expected to decelerate significantly. Here's the current chart and bounce:
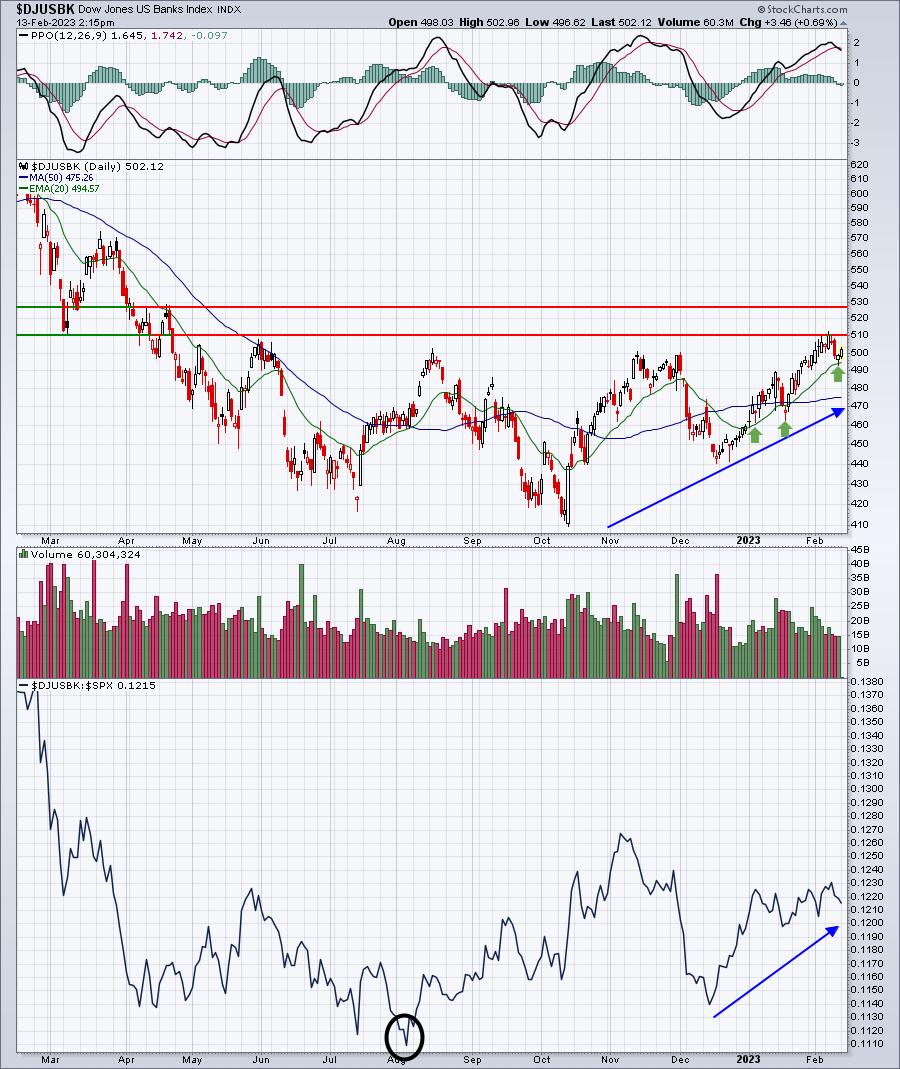
Banks, relative to the S&P 500, bottomed all the way back in August. That's very good news, because banks historically do not perform well heading into recessions. While the poor relative action in November and the first half of December was suspicious, banks have righted the ship and are performing quite well now. The first crack in the foundation would be failure at the rising 20-day EMA. But so far, there are no cracks and the group continues to send a message that it's full speed ahead for the bulls.
ChartLists/Strategies
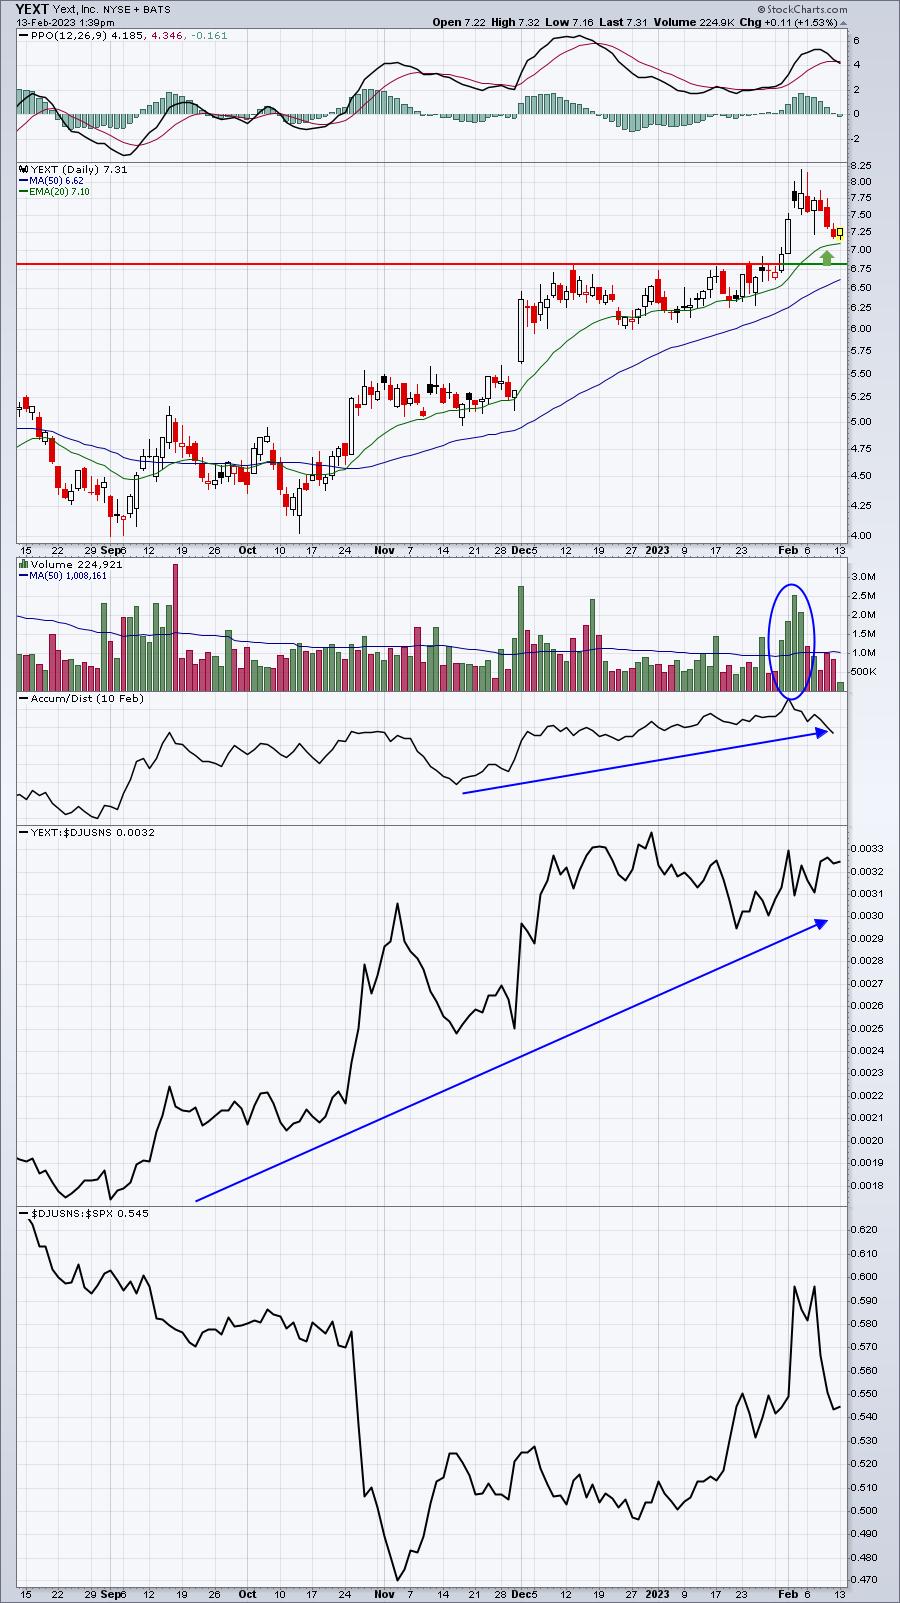
Last Thursday, I mentioned that internet stocks were struggling and that Alphabet (GOOGL) could be weighing down the group, providing solid trading opportunities. I highlighted two stocks, indicating that they were approaching key 20-day EMA tests. Check out their charts today:
YEXT:
ZD:
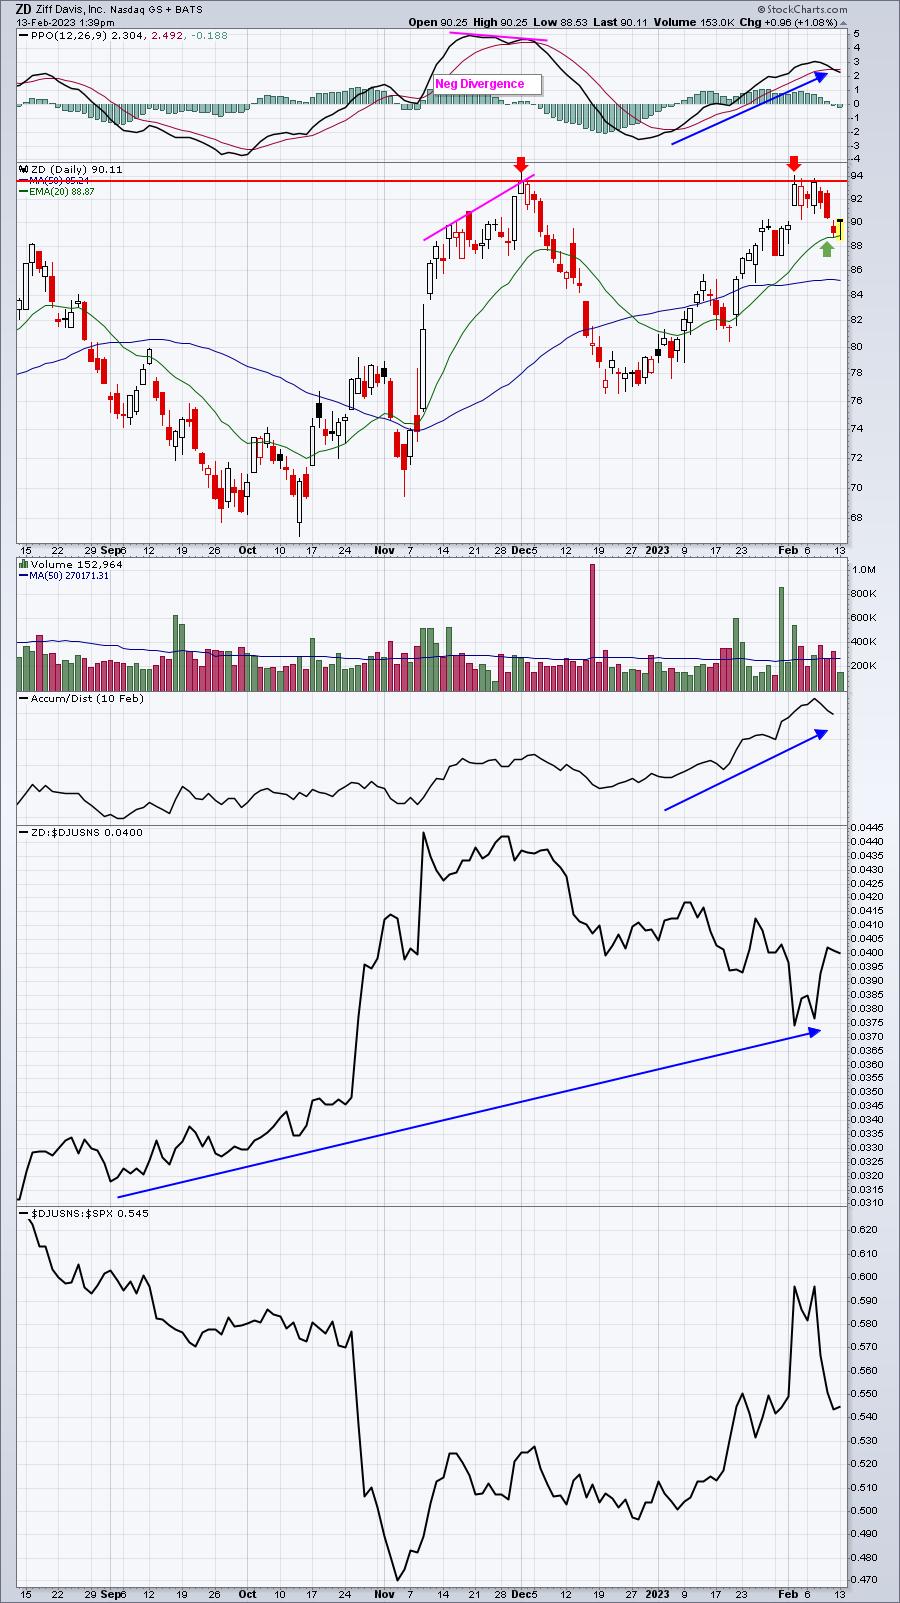
These are just two examples why I stress patience with trading. Yes, by waiting to pull the trigger, you might miss stocks from time to time. But the patience is required in order to set up the potential for high reward to low risk trading opportunities. ZD was a perfect "kiss" off the 20-day EMA. I'd expect it to return to its recent high and eventually make this key breakout of price resistance. YEXT didn't quite reach its 20-day EMA, but its low of 7.16 was a lot closer to this test than where we highlighted the stock last Thursday. Patience pays off significantly when it comes to stock market trading.
Earnings Reports
Here are the key earnings reports for the next two days, featuring stocks with market caps of more than $10 billion. I also include several companies with market caps below $10 billion. Finally, any portfolio stocks that will be reporting results are highlighted in BOLD. If you decide to hold a stock into earnings, please understand the significant short-term risk that you are taking. Please be sure to check for earnings dates for any companies you own or are considering owning.
Monday, February 13
CDNS, FIS, ANET, ACGL, FE, OWL, SEDG, PLTR, CHKP, LSCC, CAR, CX, AMKR, MEDP, MKSI, VNO, IAC, TDC, THS, ANGI, IRBT
Tuesday, February 14
KO, ZTS, ABNB, MAR, SU, TRP, ECL, EXC, DVN, GFS, NU, QSR, PKI, HWM, AKAM, LDOS, TRU, GDDY, ENTG, SCI, CLF, WCC, TX, CAE, GXO, IPGP, LTHM, BTU, TRIP, INMD, UDMY, TGH, HLF, UPST, CNDT
Economic Reports
None
Happy trading!
Tom