
EB Daily Market Report - Tuesday, February 14, 2023
Executive Market Summary
- Futures were mostly higher overnight, but turned lower with a disappointing CPI report
- The January CPI was one-tenth higher than expected, as was the January Core CPI
- Futures turned negative and our major indices all gapped lower
- Plenty of back and forth has ensued, however, with strength mostly centered around consumer discretionary (XLY, +0.25%) and technology (XLK, +0.18%)
- Defensive sectors have taken a back seat as real estate (XLRE, -1.38%) and consumer staples (XLP, -0.80%) are today's worst-performing sectors thus far
- Transportation stocks ($TRAN, +0.37%) are mostly higher and they've been dominating the Dow Utilities ($UTIL, -0.53%) since late September - a very bullish development
- Commodities are mixed with crude oil ($WTIC, -1.27%) down modestly; natural gas ($NATGAS, +7.65%) is bouncing back as it tries to find a tradable bottom
- Cadence Design Systems (CDNS, +6.72%) breaks to an all-time high after reporting better-than-expected quarterly results
Market Outlook
I noticed that the Volatility Index ($VIX) has been falling like a rock today. The overall stock market hasn't exactly been flying today as we've witnessed fairly significant moves in both directions. However, I believe the VIX was artificially inflated heading into the CPI report. In other words, market makers were pricing options much higher in the near-term, because of the potential impact of the January CPI report. In the recent past, CPI reports have been the culprits of significant volatility. Market makers once again took advantage of options traders by increasing the call and put premiums that are charged.
Here's how the VIX looks today:
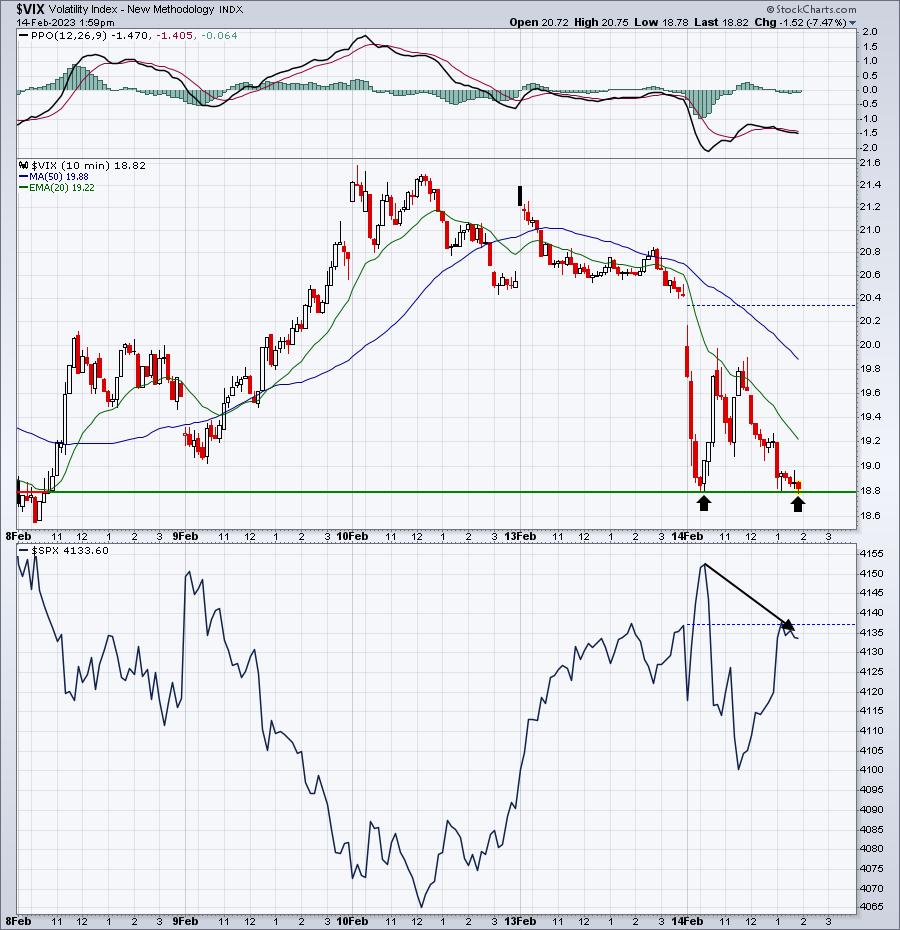
The VIX is exactly where it was at the S&P 500 low at 10am ET. However, the S&P 500 is down 20 points from where it was at that time. A lower S&P 500 usually results in a higher VIX, but the pattern of lower VIX values since December continues and can be seen even on these short-term charts. We haven't seen a major breakdown in the VIX just yet, which I believe would occur on a move beneath the 16-17 range, but there's no question in my mind that this spiraling lower of the VIX is a very bullish signal for U.S. equities. Fear is rapidly declining and that's a hallmark of secular bull market advances.
Given all the signals right now, especially our sentiment signals, I just don't understand how anyone can stick to their bear market thesis. But perhaps future market action will prove me wrong. I suppose we'll find out soon enough.
Sector/Industry Focus
I know it's been awhile since I've talked positively about airlines stocks ($DJUSAR) and recreational services stocks ($DJUSRQ). They both performed horribly during the pandemic and it's been a very difficult road to recovery for both of these industries. But the charts don't lie. And we're finally seeing nice leadership from both areas. Check out these two charts:
Airlines ($DJUSAR):
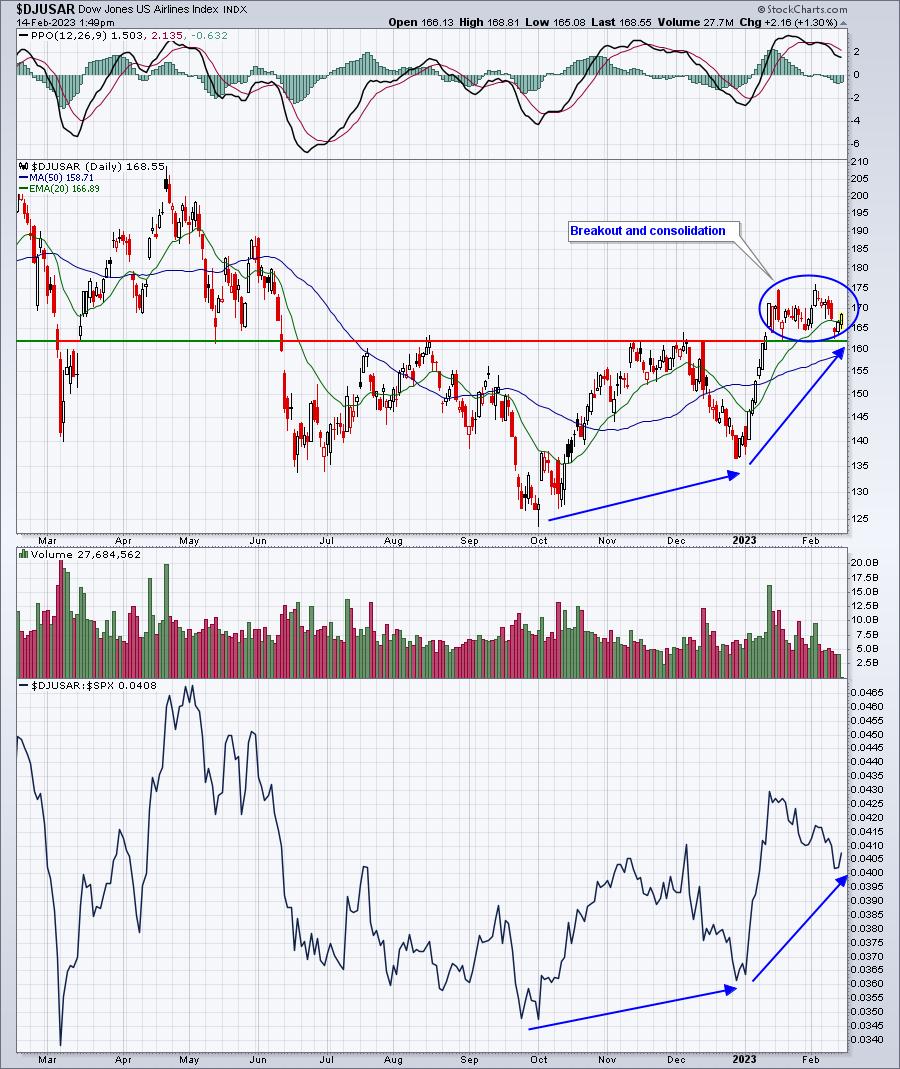
The last couple of waves of buying on the S&P 500, coming off of lows from October and December, have both been supported by a very strong airlines group. "If it ain't broke, don't fix it."
Recreational Services ($DJUSRQ):
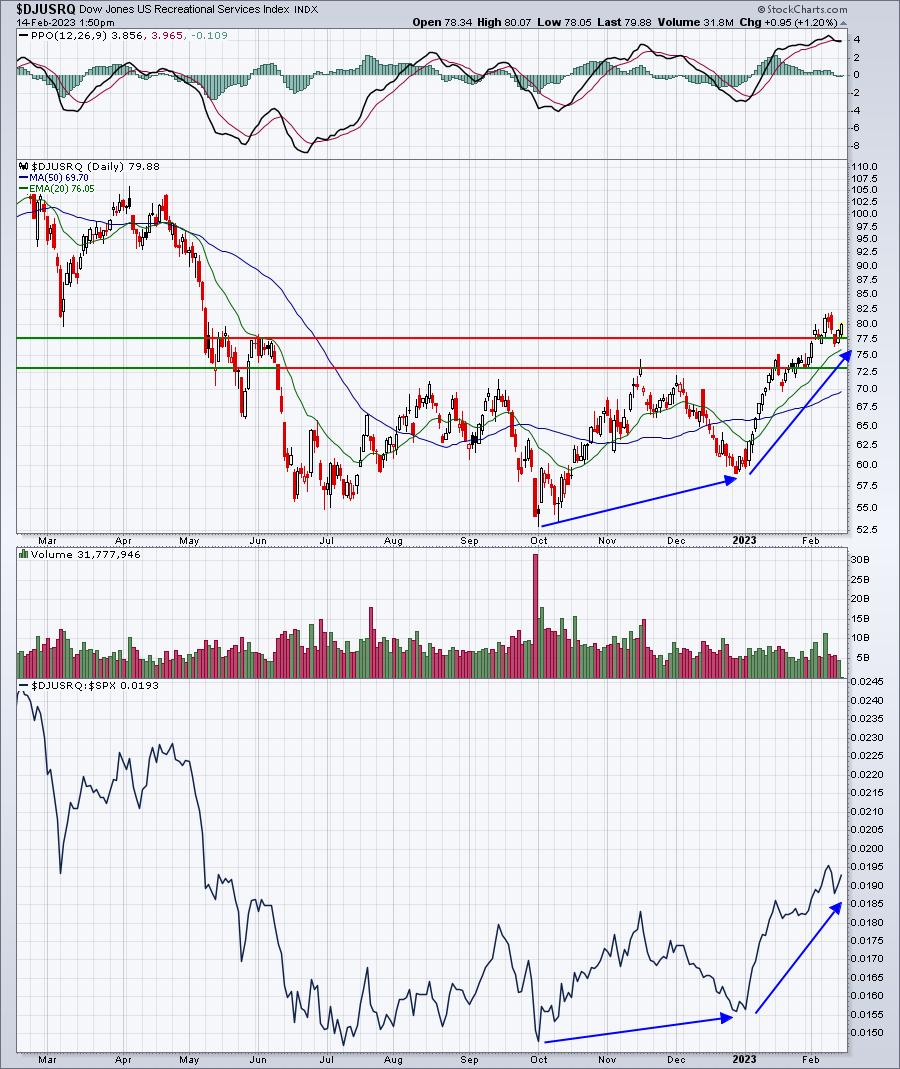
Recreation services might even be stronger than airlines right now. The cruise lines are part of this industry and are certainly responsible for some of that strength as stocks like Royal Caribbean Cruises (RCL).
Airlines and cruise lines. Who woulda thunk it?
ChartLists/Strategies
Airlines were highlighted above as an area where we could see renewed strength ahead. As I reviewed our ChartLists, here were two airlines stocks that I favor:
UAL:
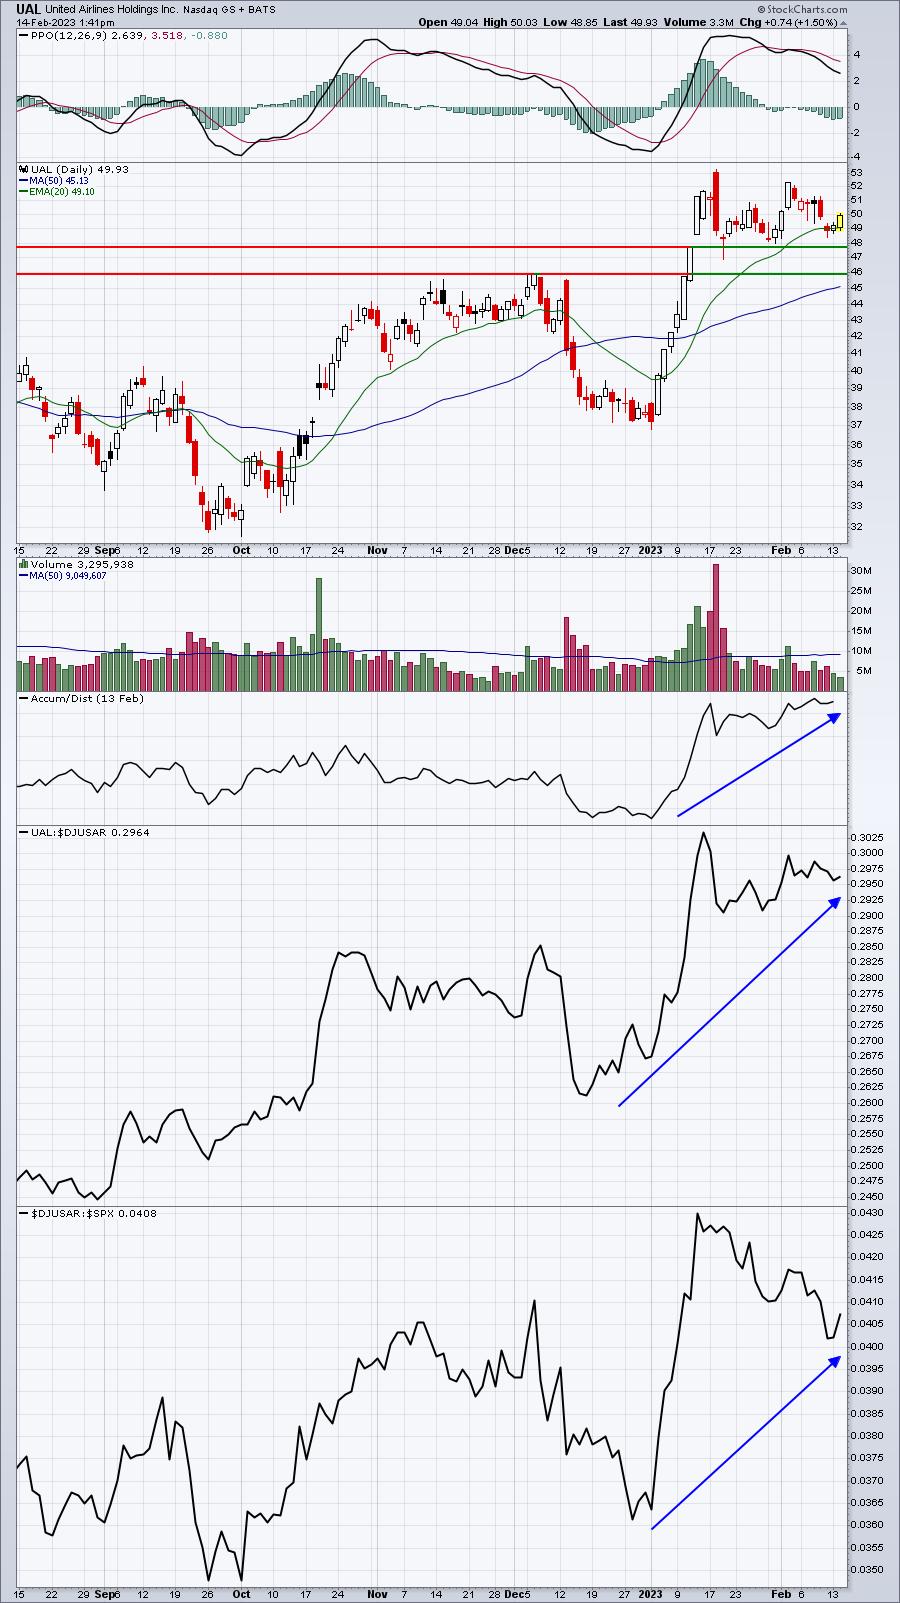
This one is a portfolio stock of ours and has clearly been a leader. Resuming strength and at least testing recent highs is what I'd be looking for.
JBLU:
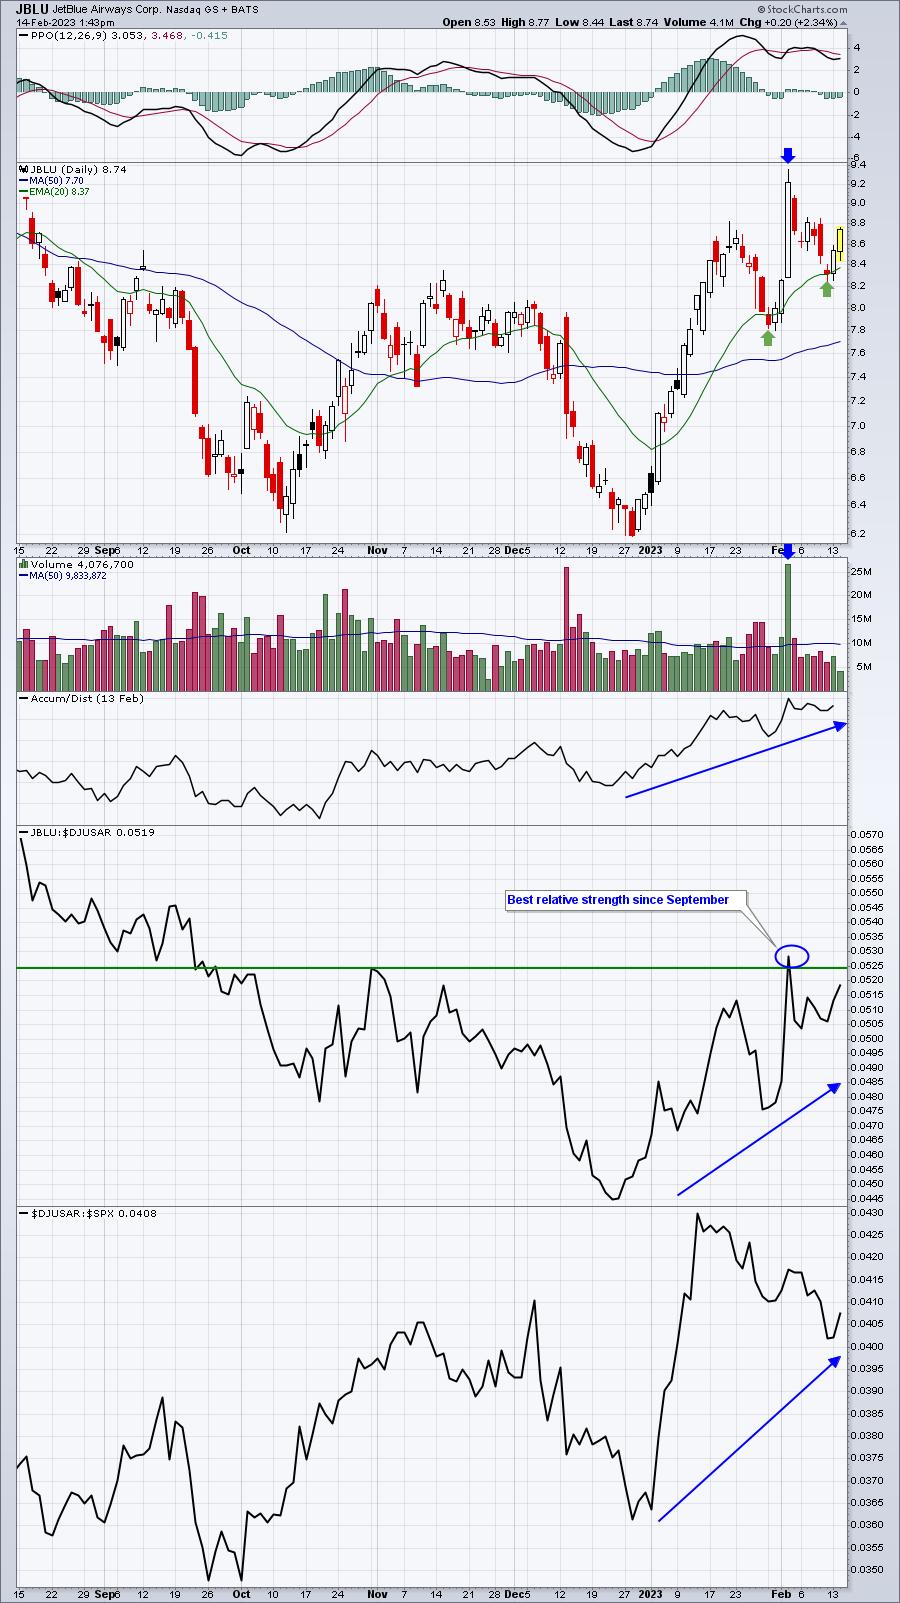
JBLU had been a laggard, but it's showing signs of renewed leadership, so this would be a more aggressive trade. JBLU raised guidance at the beginning of February and its AD line is soaring. This could be the start of something much bigger.
(Disclosure: I own JBLU shares)
Earnings Reports
Here are the key earnings reports for the next two days, featuring stocks with market caps of more than $10 billion. I also include several companies with market caps below $10 billion. Finally, any portfolio stocks that will be reporting results are highlighted in BOLD. If you decide to hold a stock into earnings, please understand the significant short-term risk that you are taking. Please be sure to check for earnings dates for any companies you own or are considering owning.
Tuesday, February 14
KO, ZTS, ABNB, MAR, SU, TRP, ECL, EXC, DVN, GFS, NU, QSR, PKI, HWM, AKAM, LDOS, TRU, GDDY, ENTG, SCI, CLF, WCC, TX, CAE, GXO, IPGP, LTHM, BTU, TRIP, INMD, UDMY, TGH, HLF, UPST, CNDT
Wednesday, February 15
CSCO, ADI, EQIX, SHOP, SNPS, KHC, AIG, BIIB, NTR, RSG, ET, MFC, WELL, WCN, GOLD, ALB, AWK, SGEN, TTD, RPRX, AEE, MLM, INVH, WAT, RBLX, WAB, CF, ROL, MRO, TYL, HST, EQT, TWLO, ZG, TPG, ICL, OC, RGLD, ROKU, GNRC, WH, CHH, QDEL, KGC, TXG, R, TNET, PSN, SUN, SAM, IRT, ZD, ALSN, RNG, TMHC, QS, HL, AMED, PEGA, SPWR, NUS, DNUT, UPWK, PLMR, FSLY
Economic Reports
January CPI: +0.5% (actual) vs. +0.4% (estimate)
January Core CPI: +0.4% (actual) vs. +0.3% (estimate)
Happy trading!
Tom