
EB Daily Market Report - Wednesday, February 15, 2023
Executive Market Summary
- Futures were lower overnight and a red-hot January retail sales number kept the bulls at bay as strengthening economic conditions could signal another inflationary spike, along with potentially higher interest rates
- After opening in negative territory, however, we've seen renewed strength as the more-aggressive NASDAQ outperforms
- Cryptocurrencies are also strong with both bitcoin ($BTCUSD) and etherium ($ETHUSD) gaining more than 4%
- The stronger economic data sent the dollar (UUP, +0.69%) higher and many commodities lower; gold ($GOLD, -1.00%) is back within 1% of its breakout level at $1825 per ounce
- Crude oil ($WTIC, -0.63%) remains in a long-term downtrend, despite its recent rally
- Aggressive stocks continue to outperform as consumer discretionary (XLY, +0.98%) and communication services (XLC, +0.81%) lead today's action
- Travel & tourism ($DJUSTT, +4.42%) is getting a huge boost from Airbnb Inc. (ABNB, +14.60%) after its better-than-expected quarterly earnings report
- SolarEdge Technologies (SEDG, +8.96%) is looking to break to its highest level since August and is the top-performing stock in the S&P 500
Market Outlook
One of my favorite, if not my favorite, intermarket relationships is the ratio of consumer discretionary (XLY) vs. consumer staples (XLP). Consumer spending is roughly 2/3 of our GDP, so it makes sense to see which area of the consumer stocks is outperforming. If the XLY:XLP is rising, it's traditionally a signal that we're in a "risk on" market environment, which nearly always accompanies rising U.S. equity prices. On the other hand, a falling XLY:XLP ratio suggests a much more cautious market environment. While 2022 was characterized by the latter (relatively strong consumer staples), 2023 has been completely different, fully supporting this market advance. Check this out:
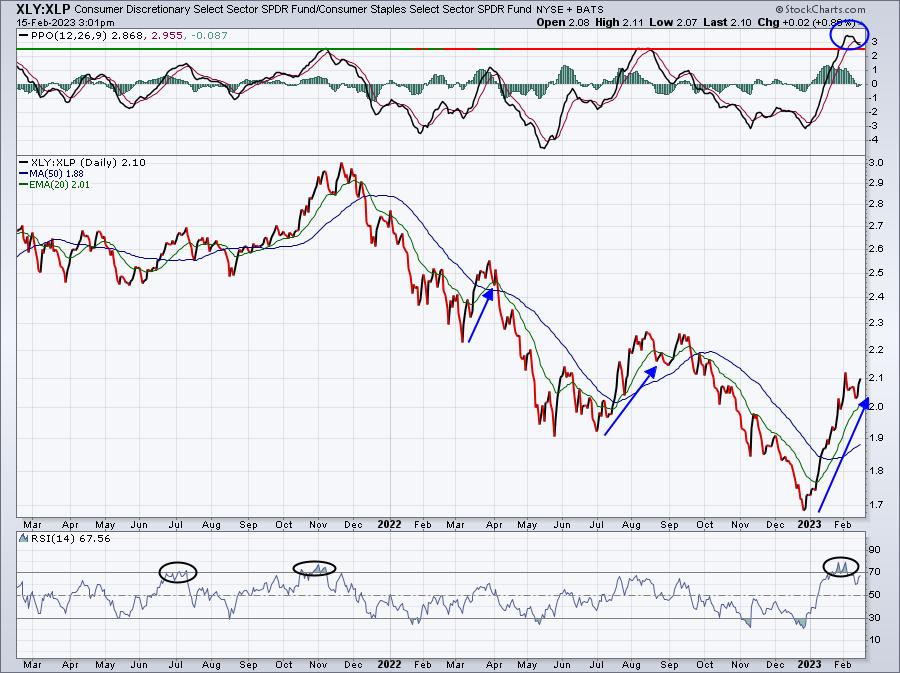
We haven't seen this kind of strength in the XLY:XLP ratio since back in 2021. The ratio itself hasn't moved above 70 on the RSI in 15 months. This provides us solid clues that the strength of this market rally is real and likely to be sustained.
Sector/Industry Focus
Communications services (XLC) appears to be starting to regain some momentum after falling back recently to test both gap support and the rising 20-day EMA:
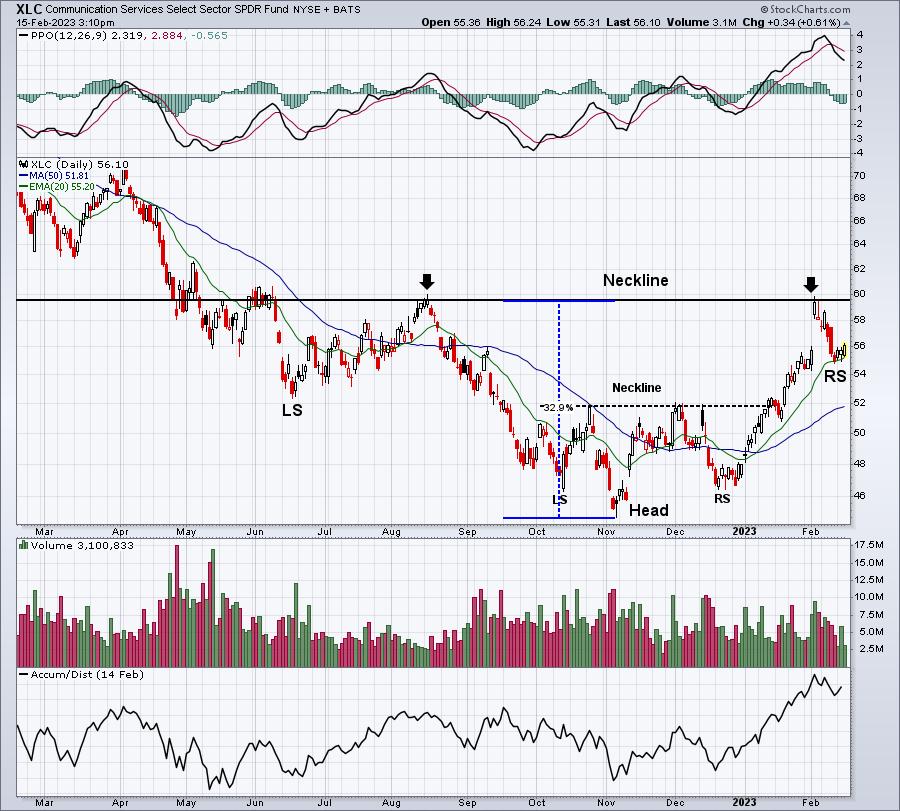
I see two bullish bottoming head & shoulders patterns. The first, which was much smaller, had a neckline near 52 and a head close to 45. A breakout would measure 7 points (52-45) up to 59, which we reached when we established the neckline of a much larger bottoming head & shoulders pattern. This pattern, if broken, would measure potentially to 75 as the neckline (60) measures 15 bucks down to the head (45). If you add the 15 measurement to the neckline breakout at 60, you get a 75 target. Keep this in mind if the XLC rallies and breaks out above 60.
If the XLC were to fall back below 54.00, then there'd be an increasing probability that it'd test the triple top breakout at 52 from January. Note also that the 50-day SMA is rising and nearing 52. That level would be a "line in the sand" for the bulls. If we're truly resuming a secular bull market advance, we should not see the XLC back below 52.
ChartLists/Strategies
Here are a few communications services stocks that have paused lately and could be ready to resume their upward trajectory. They all come from our Strong AD ChartList (SADCL), which suggests excellent accumulation:
CCOI:
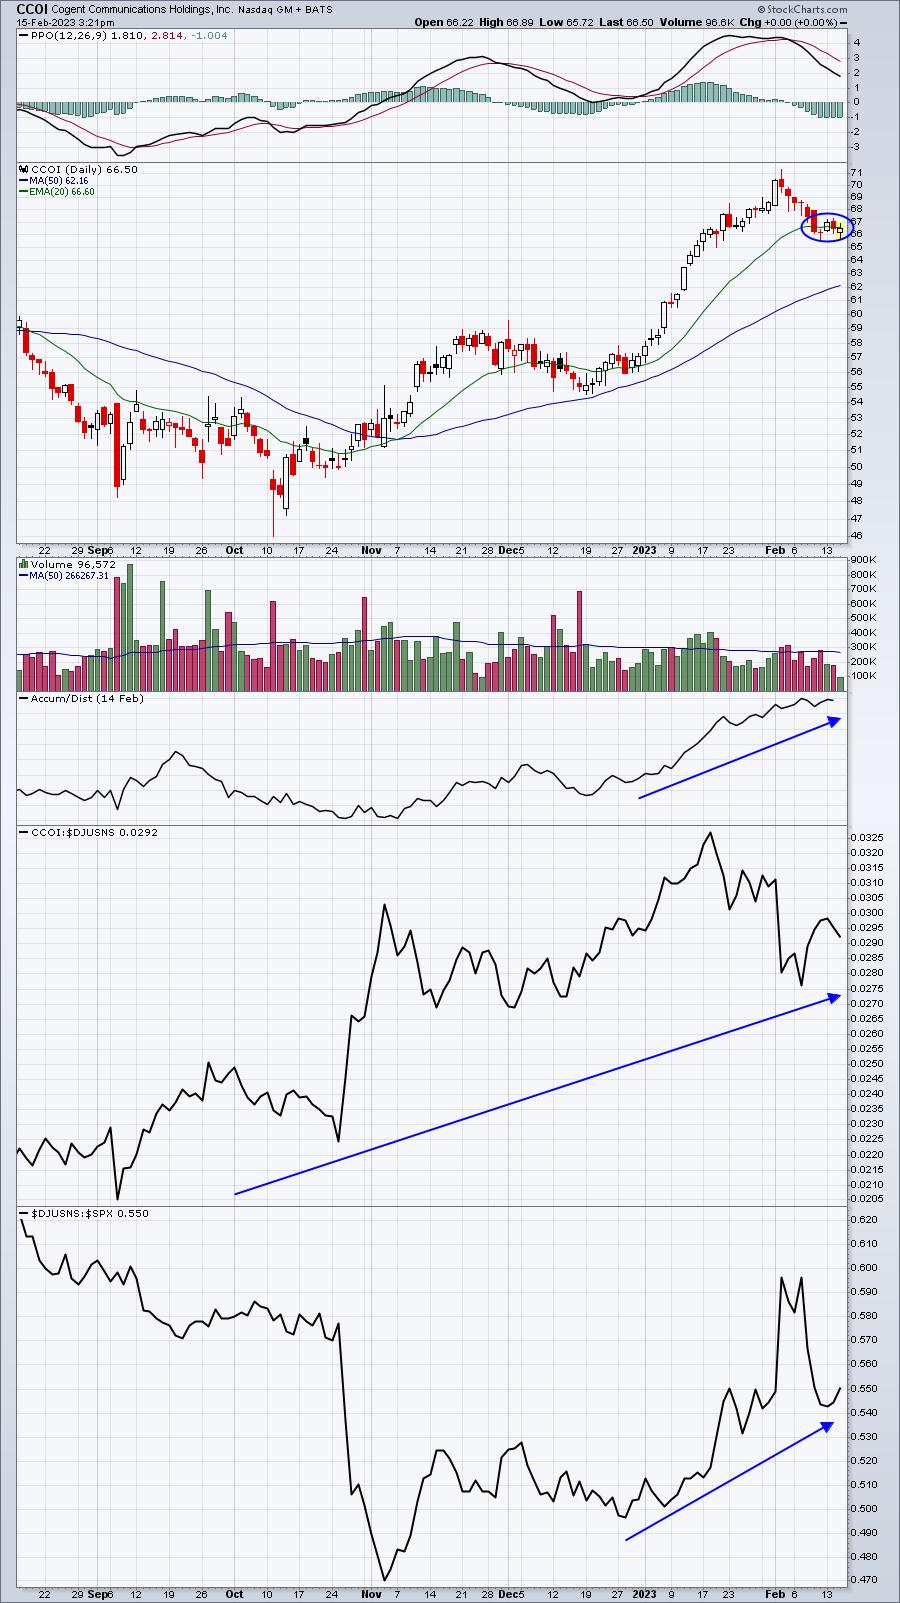
CCOI is consolidating at its 20-day EMA, generally a nice spot to enter during an uptrend. Volume on this one can be a little light from time to time, but the liquidity is fine for a trade.
IPG:
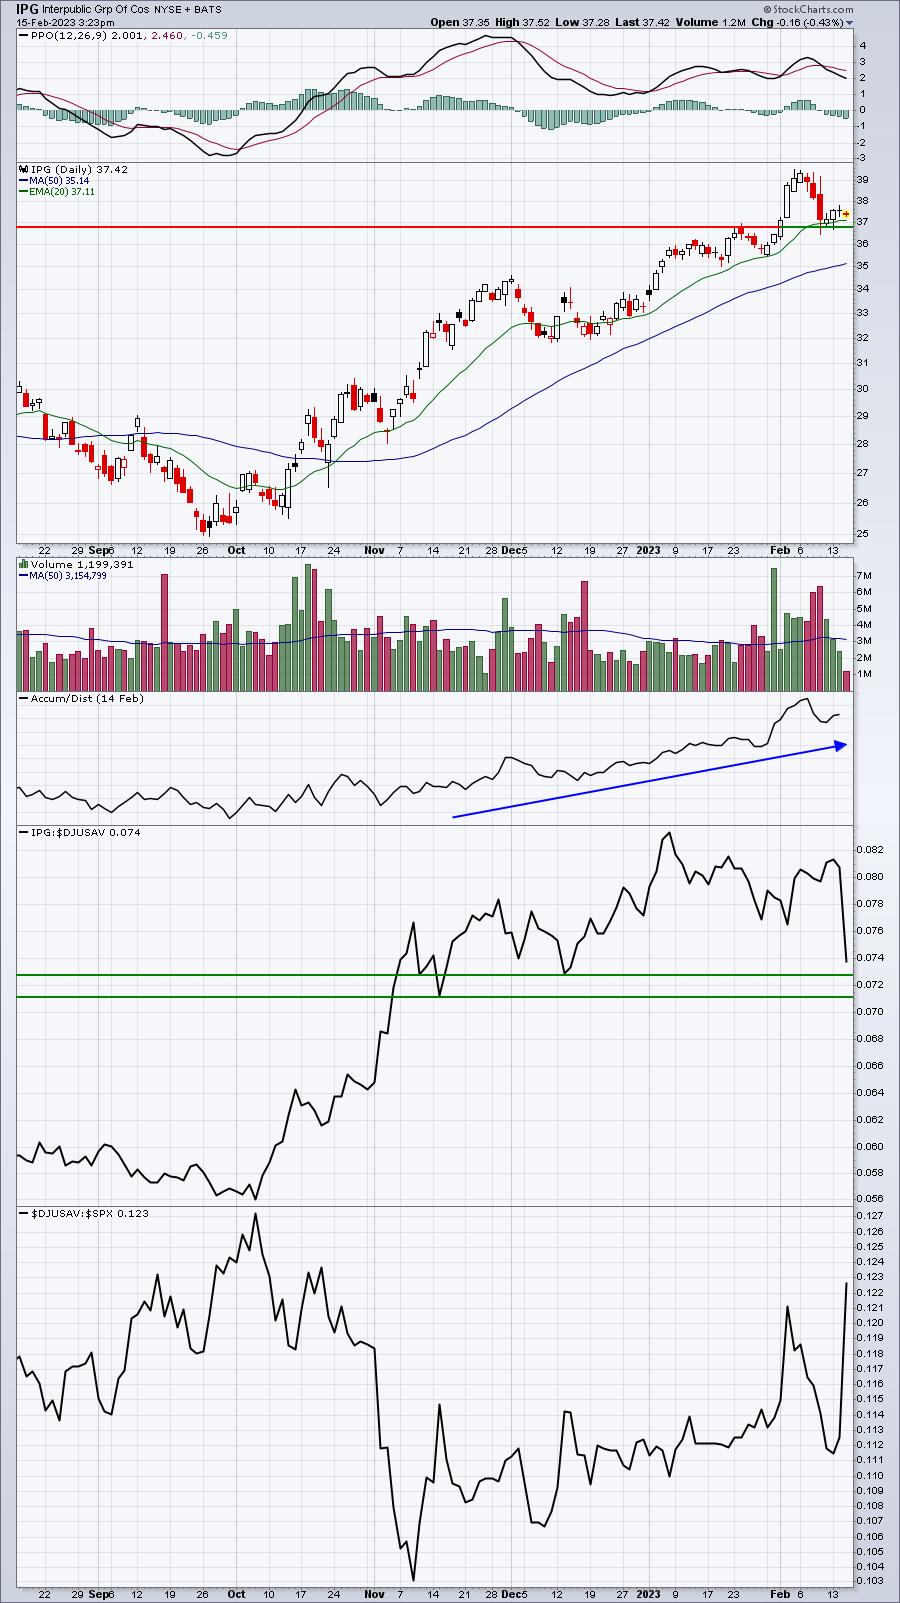
IPG is one of our portfolio stocks and has been a nice performer. The recent pullback to the rising 20-day EMA presents a nice reward-to-risk trading opportunity.
EVER:
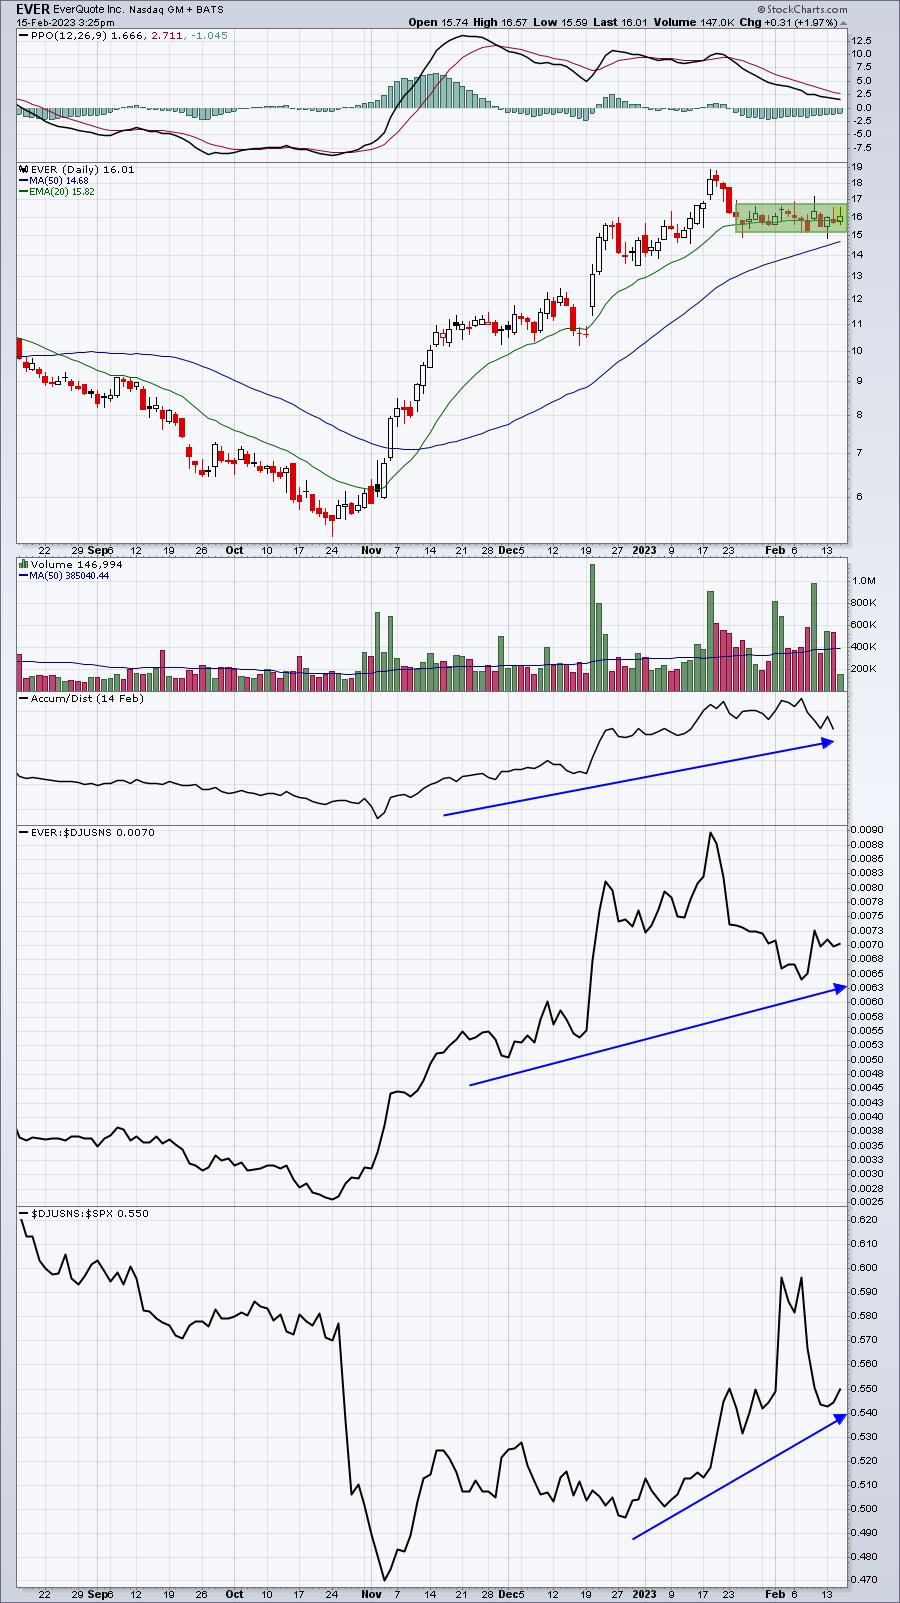
Check out the volume trends on this one. It sure looks like a lot of accumulation to me.
......and here's one that may have just started its rebound today.....
EB:
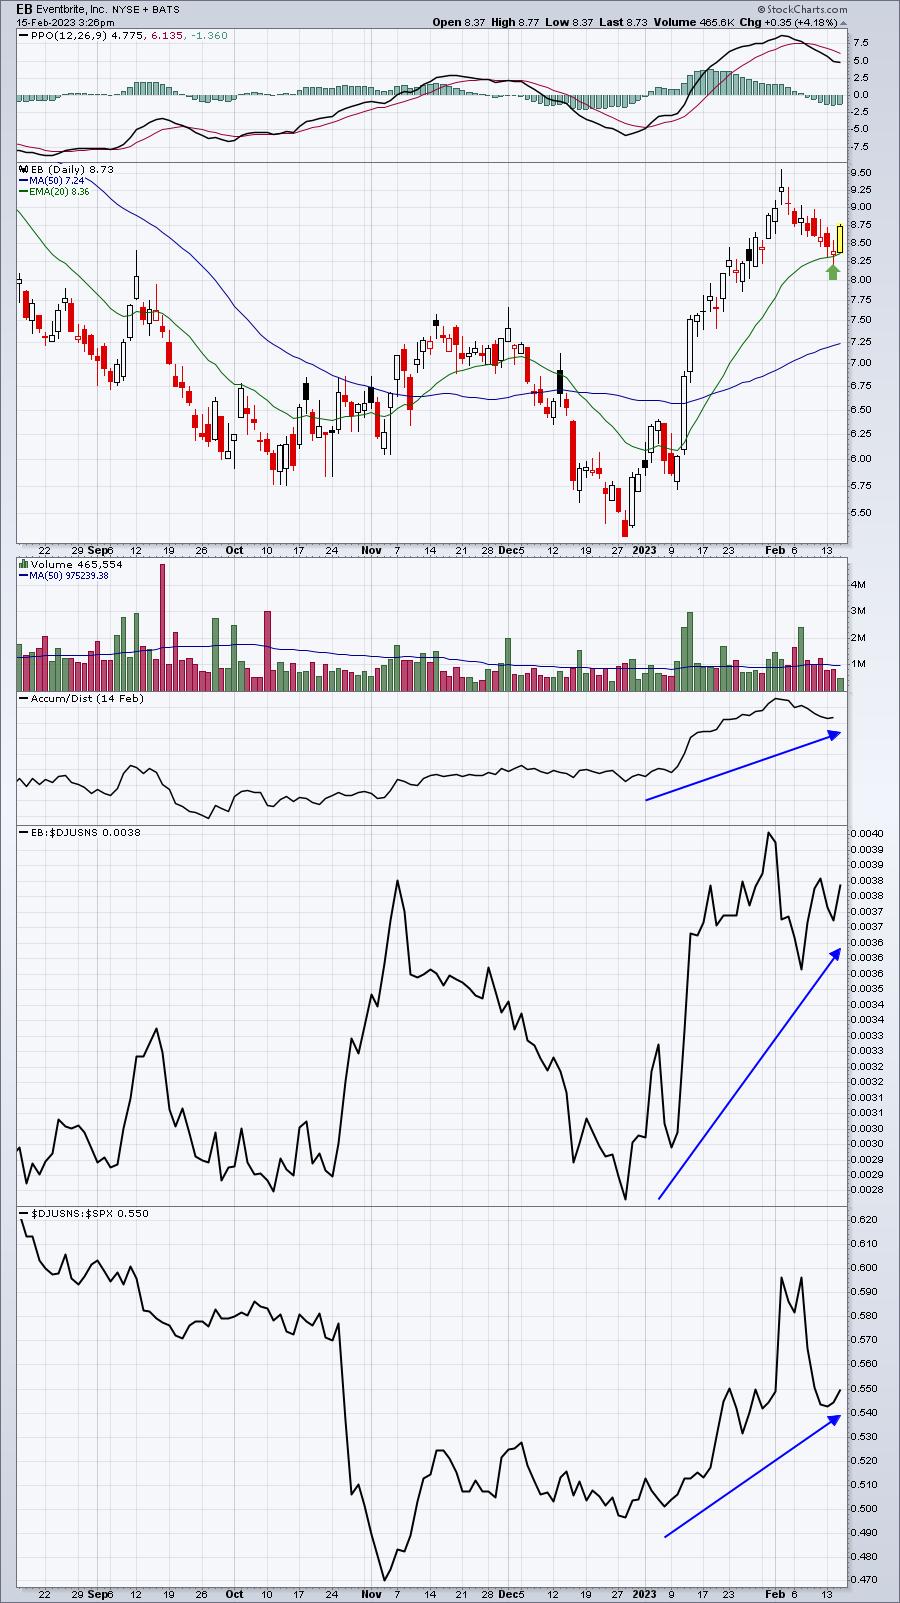
This is typically what I'm looking for. Strength, followed by temporary weakness to the rising 20-day EMA. Any 4% 1-day move is nice and there'll be plenty of these in the days ahead if I'm right about market direction.
Earnings Reports
Here are the key earnings reports for the next two days, featuring stocks with market caps of more than $10 billion. I also include several companies with market caps below $10 billion. Finally, any portfolio stocks that will be reporting results are highlighted in BOLD. If you decide to hold a stock into earnings, please understand the significant short-term risk that you are taking. Please be sure to check for earnings dates for any companies you own or are considering owning.
Wednesday, February 15
CSCO, ADI, EQIX, SHOP, SNPS, KHC, AIG, BIIB, NTR, RSG, ET, MFC, WELL, WCN, GOLD, ALB, AWK, SGEN, TTD, RPRX, AEE, MLM, INVH, WAT, RBLX, WAB, CF, ROL, MRO, TYL, HST, EQT, TWLO, ZG, TPG, ICL, OC, RGLD, ROKU, GNRC, WH, CHH, QDEL, KGC, TXG, R, TNET, PSN, SUN, SAM, IRT, ZD, ALSN, RNG, TMHC, QS, HL, AMED, PEGA, SPWR, NUS, DNUT, UPWK, PLMR, FSLY
Thursday, February 16
AMAT, SO, CVE, ED, DLR, CEG, DDOG, VMC, AEM, DASH, LH, ETR, EPAM, WST, HUBS, ZBRA, POOL, PARA, BIO, DKNG, RS, TOST, HSIC, H, WSO, CGNX, DBX, USFD, NRG, HAS, CROX, TXRH, SWAV, AL, ATHM, TSEM, VC, APPN, SHAK, ITGR, BLMN, COHU, TDS
Economic Reports
January retail sales: +3.0% (actual) vs. +1.7% (estimate)
January retail sales less autos: +2.3% (actual) vs. +0.7% (estimate)
February empire state manufacturing index: -5.8 (actual) vs. -20.3 (estimate)
January industrial production: +0.0% (actual) vs. +0.4% (estimate)
January capacity utilization: 78.3% (actual) vs. 79.0% (estimate)
December business inventories: +0.3% (actual) vs. +0.3% (estimate)
Happy trading!
Tom