
EB Daily Market Report - Tuesday, February 21, 2023
ChartLists Updated
There has been a TON posted on our website over the weekend. Here's a quick synopsis:
- Strong Earnings ChartList (SECL)
- Strong Future Earnings ChartList (SFECL)
- Raised Guidance ChartList (RGCL)
- Bullish Trifecta ChartList (BTCL)
- All Upcoming Earnings ChartLists for this week
- Model Portfolio ChartList
- Aggressive Portfolio ChartList
- Income Portfolio ChartList
I am also working on the Earnings AD ChartList (EADCL), which will be much improved over previous versions. I should have that on the website tomorrow and I'll explain more about it in tomorrow's Daily Market Report (DMR).
Upcoming Vacation
I mentioned this a couple weeks ago, but I want to make sure everyone is aware. I'll be out of the country on vacation from March 3rd through March 10th. There will be no Trading Places Live shows during that period, although there will likely be earlier recordings replayed on StockCharts TV on Tuesday, March 7th and Thursday, March 9th. There will be no Daily Market Reports on Friday, March 3rd or the following week, but John Hopkins will provide everyone at least a brief market update each day. There will be no EB Weekly Portfolio Report on Sunday, March 5th, though I should be back in time to provide one on Sunday, March 12th.
My plan is to have all key ChartLists (SECL, SFECL, SADCL, RGCL, and BTCL) updated prior to leaving on March 3rd. It should be a fairly quiet period as few earnings will be out and there'll be no more Fed meetings until March 21-22. The jobs report will be out on Friday, March 3rd, so we could see a bit of fireworks that day, but otherwise it should be relatively quiet.
Executive Market Summary
- Futures were lower overnight as we kicked off a fresh new week with falling equity prices
- We gapped lower across the major indices and the NASDAQ has led the selling
- The Volatility Index ($VIX, +14.04%) has surged today as bearishness creeps back into U.S. equities
- The 10-year treasury yield ($TNX) has broken through key short-term yield resistance at 3.90%, rising 13 basis points to 3.95%
- All 11 sectors are lower, led by the most aggressive; consumer discretionary (XLY, -2.90%) and technology (XLK, -2.37%) lead the charge
- Home improvement retailers ($DJUSHI, -6.12%) are taking a big hit as a result of Home Depot's (HD, -6.69%) latest quarterly earnings
- Meanwhile, Walmart (WMT, +0.66%) has managed to move into positive territory after posting better-than-expected quarterly revenues and EPS
- Energy (XLE, -0.19%) is today's best-performing sector as crude oil prices ($WTIC) attempt to stabilize near $76 per barrel
- Consumer staples (XLP, -0.20%), a defensive sector, is also showing excellent relative strength today
Market Outlook
This is a damaging day technically for our major indices, barring a big reversal in the final couple hours. It's also the day after monthly options expire, which historically is the absolute worst day of the calendar month. Will it last? That's difficult to say in the very near-term. I said on my Trading Places Live show this morning that I believe the stock market is "vulnerable" right now. That doesn't mean we're going lower, but if we are going to have a significant selling episode, now is the more likely time we're going to see it. I felt January 2023 would be strong, while February and March would be a bit more difficult. That lines up with history. January is typically quite bullish, while March can throw us a few curveballs.
I expect that the next earnings run higher will be very strong, but we shouldn't expect that until late March or early April. The market is vulnerable, because treasury yields are back on the move higher. Focus will shift mostly towards the Fed and what it might do at its next meeting (and its next few meetings). The media will be all over it like a dog on a bone. Consider the following:
Last Wednesday's close was 309.10 on the QQQ and we knew max pain resided somewhere near 290. The QQQ is now trading at 294.79 (as of 2:52pm ET). That's a drop of 15.31 since last Wednesday's close. The opening gap each day has been lower and they total 10.85, roughly 71% of the drop since last Wednesday. I've been saying for months that there has been massive manipulation. And now the market makers have done it again - wiping out nearly all of the net in-the-money call premium on the QQQ. Let's give them a hand.
Sector/Industry Focus
The last time was saw the 10-year treasury yield ($TNX) breaking above downtrend resistance, the TNX scooted to new highs and the S&P 500 took a bath. While I don't believe we'll see the same extent of selling this time, nor another bear market low, it does make sense to at least be a bit more cautious. I am using the QQQ weakness (down to 290 or so) to build a more leveraged position in the QLD (performs at a 2:1 clip vs. the QQQ - to both the upside and downside), but I fully understand if you'd rather sit this one out. It really comes down to each individual's personal risk tolerance. Here's a look at the TNX and what happened back in August 2022:
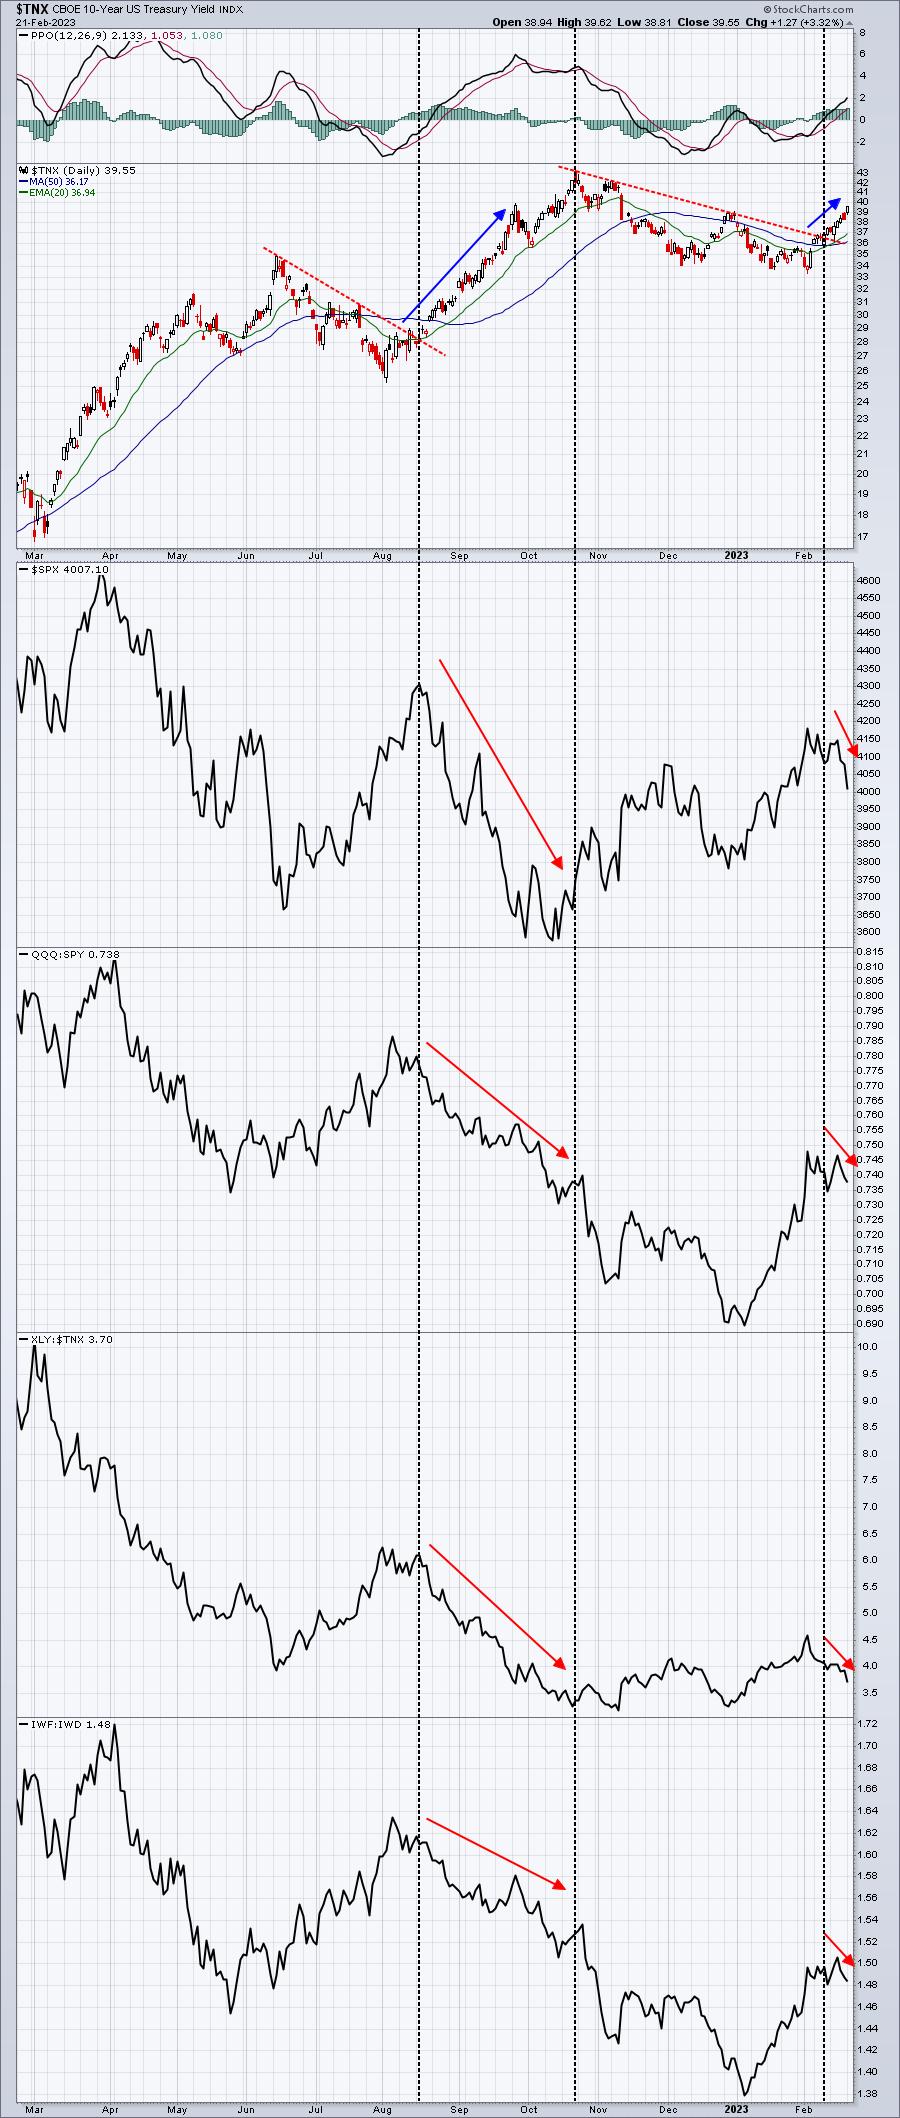
This is clearly a warning shot being fired. I don't believe this is a turning point long-term, but knowing the historical troubles we sometimes face in February/March, it's hard not to be at least a little cautious, if not downright bearish. My longer-term signals remain very bullish, however, so I am sticking with my bullish trading strategy, which suggests to remain long the QQQ, SPY, XLK, XLY, etc.
ChartLists/Strategies
I've often said that the difference between a breakdown and a false breakdown is the closing price. False breakdowns occur when we have intraday breakdowns that reverse into the close, ending with a price that is above key support. Here are two "potential" breakdowns that also could be marking a bottom, if we see an afternoon reversal:
PLUG:
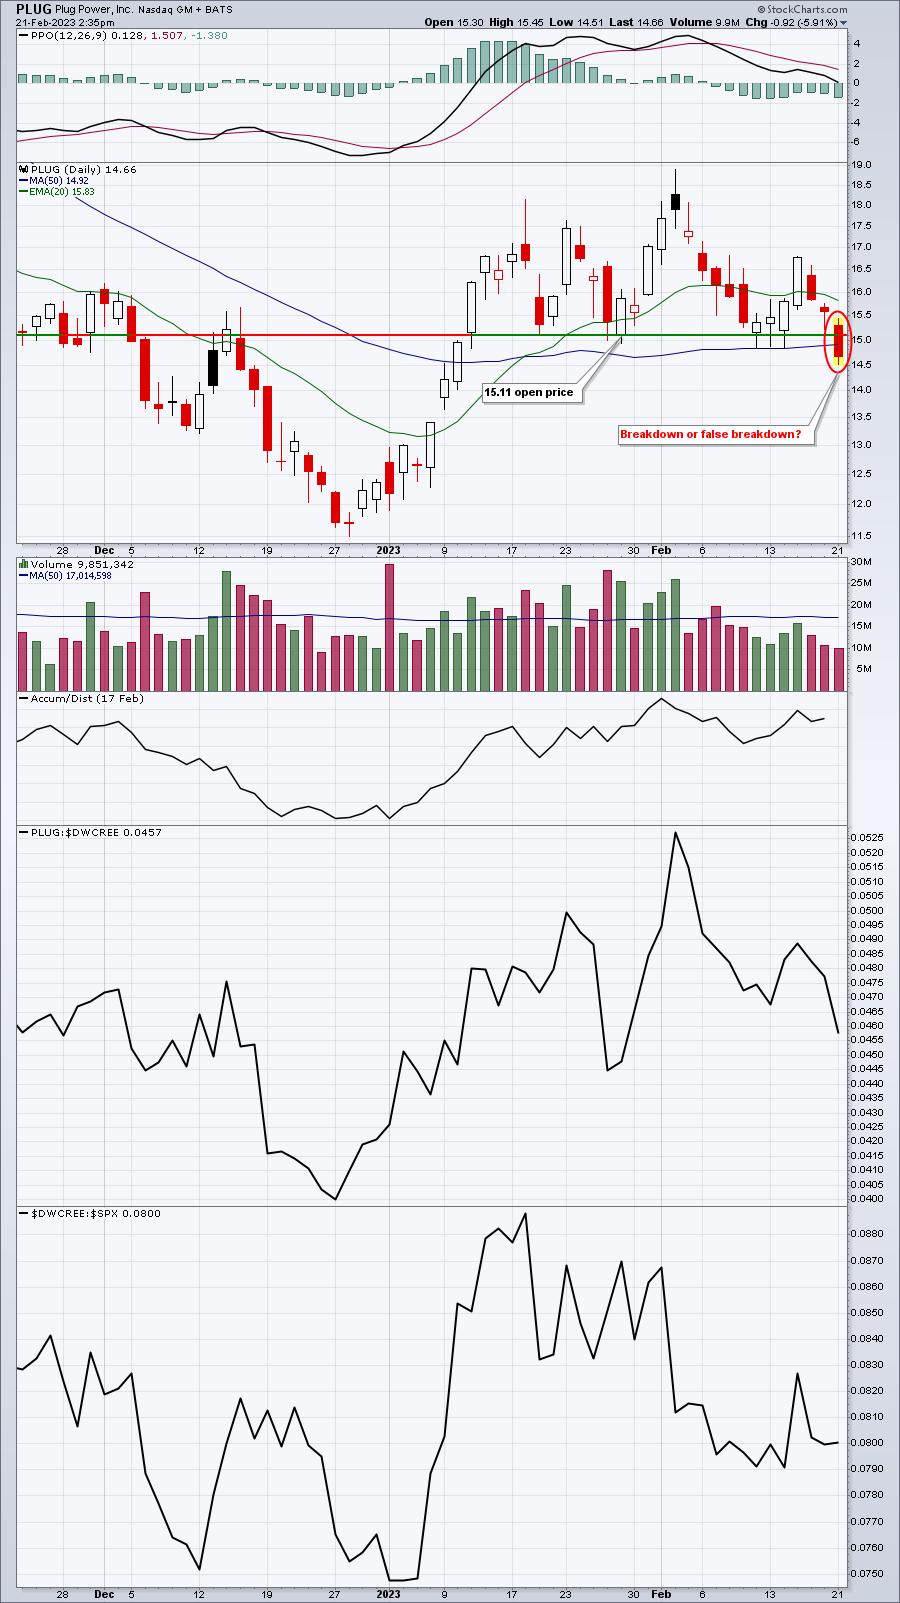
The recent low candle body occurred on January 27th when PLUG opened at 15.11. We've seen multiple intraday lows beneath 15.00, but no opens or closes there. Today, PLUG opened at 15.30. A strong finish and close at or above 15.11 would leave a long tail to the downside, representing a false breakdown. I typically buy stocks on these reversals as it's a signal that market makers are buying. Does it always work? Of course not. Technical analysis provides probabilities, not guarantees. Always keep your stop in place - either physical or mental.
WMG:
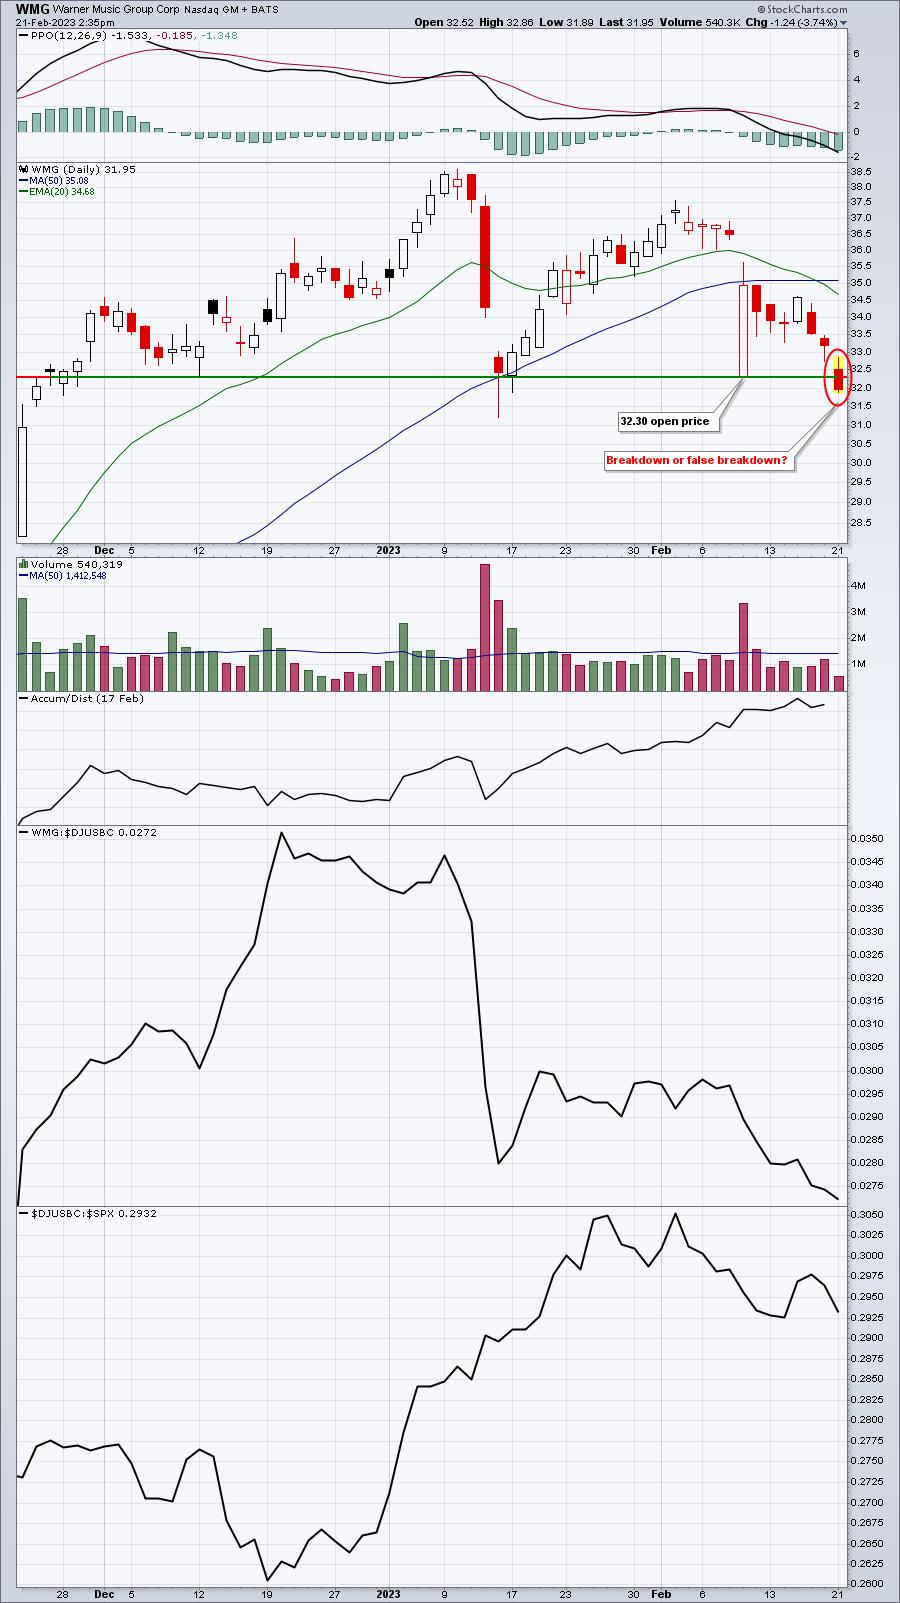
WMG is a very similar chart and both charts show fairly light volume, well beneath the average volume line. But the charts clearly take on more bearish characteristics without a reversal today.
It doesn't feel like a reversal kind of day, especially with the 10-year treasury yield ($TNX) breaking above 3.90% yield resistance, but I like to keep my eyes open to many short-term possibilities.
Earnings Reports
Here are the key earnings reports for the next two days, featuring stocks with market caps of more than $10 billion. I also include several companies with market caps below $10 billion. Finally, any portfolio stocks that will be reporting results are highlighted in BOLD. If you decide to hold a stock into earnings, please understand the significant short-term risk that you are taking. Please be sure to check for earnings dates for any companies you own or are considering owning.
Tuesday, February 21:
WMT, HD, MDT, PANW, PSA, O, KEYS, CSGP, SBAC, PEG, FANG, IR, EXPD, AGR, WLK, COIN, EXAS, CZR, TAP, CHK, WSC, GFL, LECO, TOL, RIG, FLR, SPT, STAA, TWNK, ZIP, TPH, ATRC, SKT, KAR, LZB
Wednesday, February 22:
NVDA, TJX, STLA, PXD, BIDU, EBAY, ANSS, EXR, GRMN, ICLR, CTRA, LCID, MOS, TRGP, ETSY, NTAP, TPL, CRL, APA, U, FNF, UTHR, NI, WES, RGEN, ALLE, DVA, IQ, VAC, FIVN, RUN, GIL, WING, TDOC, DRVN, MMSI, PAAS, OUT, PK, LIVN, BCO, BMBL, TNDM, NUVA, EVTC, CAKE, MGNI, VCYT, UCTT, PARR, FVRR, EVBG, LGND, WWW, LMND, OSTK
Economic Reports
January existing home sales: 4,000,000 (actual) vs. 4,100,000 (estimate)
Happy trading!
Tom