
EB Daily Market Report - Thursday, February 23, 2023
Upcoming Vacation
I mentioned this a couple weeks ago, but I want to make sure everyone is aware. I'll be out of the country on vacation from March 3rd through March 10th. There will be no Trading Places Live shows during that period, although there will likely be earlier recordings replayed on StockCharts TV on Tuesday, March 7th and Thursday, March 9th. There will be no Daily Market Reports on Friday, March 3rd or the following week, but John Hopkins will provide everyone at least a brief market update each day. There will be no EB Weekly Portfolio Report on Sunday, March 5th, though I should be back in time to provide one on Sunday, March 12th.
My plan is to have all key ChartLists (SECL, SFECL, SADCL, RGCL, and BTCL) updated prior to leaving on March 3rd. It should be a fairly quiet period as few earnings will be out and there'll be no more Fed meetings until March 21-22. The jobs report will be out on Friday, March 3rd, so we could see a bit of fireworks that day, but otherwise it should be relatively quiet.
Executive Market Summary
- Futures were higher overnight after a solid quarterly report from NVIDIA Corp (NVDA, +12.61%)
- Our major indices gapped higher and relative strength was seen by the NASDAQ
- Earlier gains have been erased and all major indices trade in negative territory
- Somewhat surprisingly, the Volatility Index ($VIX, -1.75%) is lower, despite a falling S&P 500
- Q4 GDP (2nd estimate) was slightly below the initial estimate, 2.7% vs. 2.9%
- Commodities are mixed as crude oil ($WTIC, +2.18%) rebounds, while gold ($GOLD, -0.70%) nears key support around $1825 per ounce
- The 10-year treasury yield ($TNX) is down slightly to 3.91%, attempting to close above 3.90% for the third consecutive session
- Semiconductors ($DJUSSC, +3.56%) are an outlier today, rising after NVDA's strong quarterly results
- Moderna (MRNA, -8.59%) is falling after missing its quarterly earnings estimates
- Energy (XLE, +0.92%) and technology (XLK, +0.43%) are today's leading sectors, while communication services (XLC, -1.22%) lag
Market Outlook
Remember the strong advance that we saw after the last Fed meeting? Well, the entire gain has now been wiped out. Below is a chart that shows both the SPY and QQQ (ETFs that track the S&P 500 and NASDAQ 100, respectively), along with a few key ratios beneath these two primary ETFs:
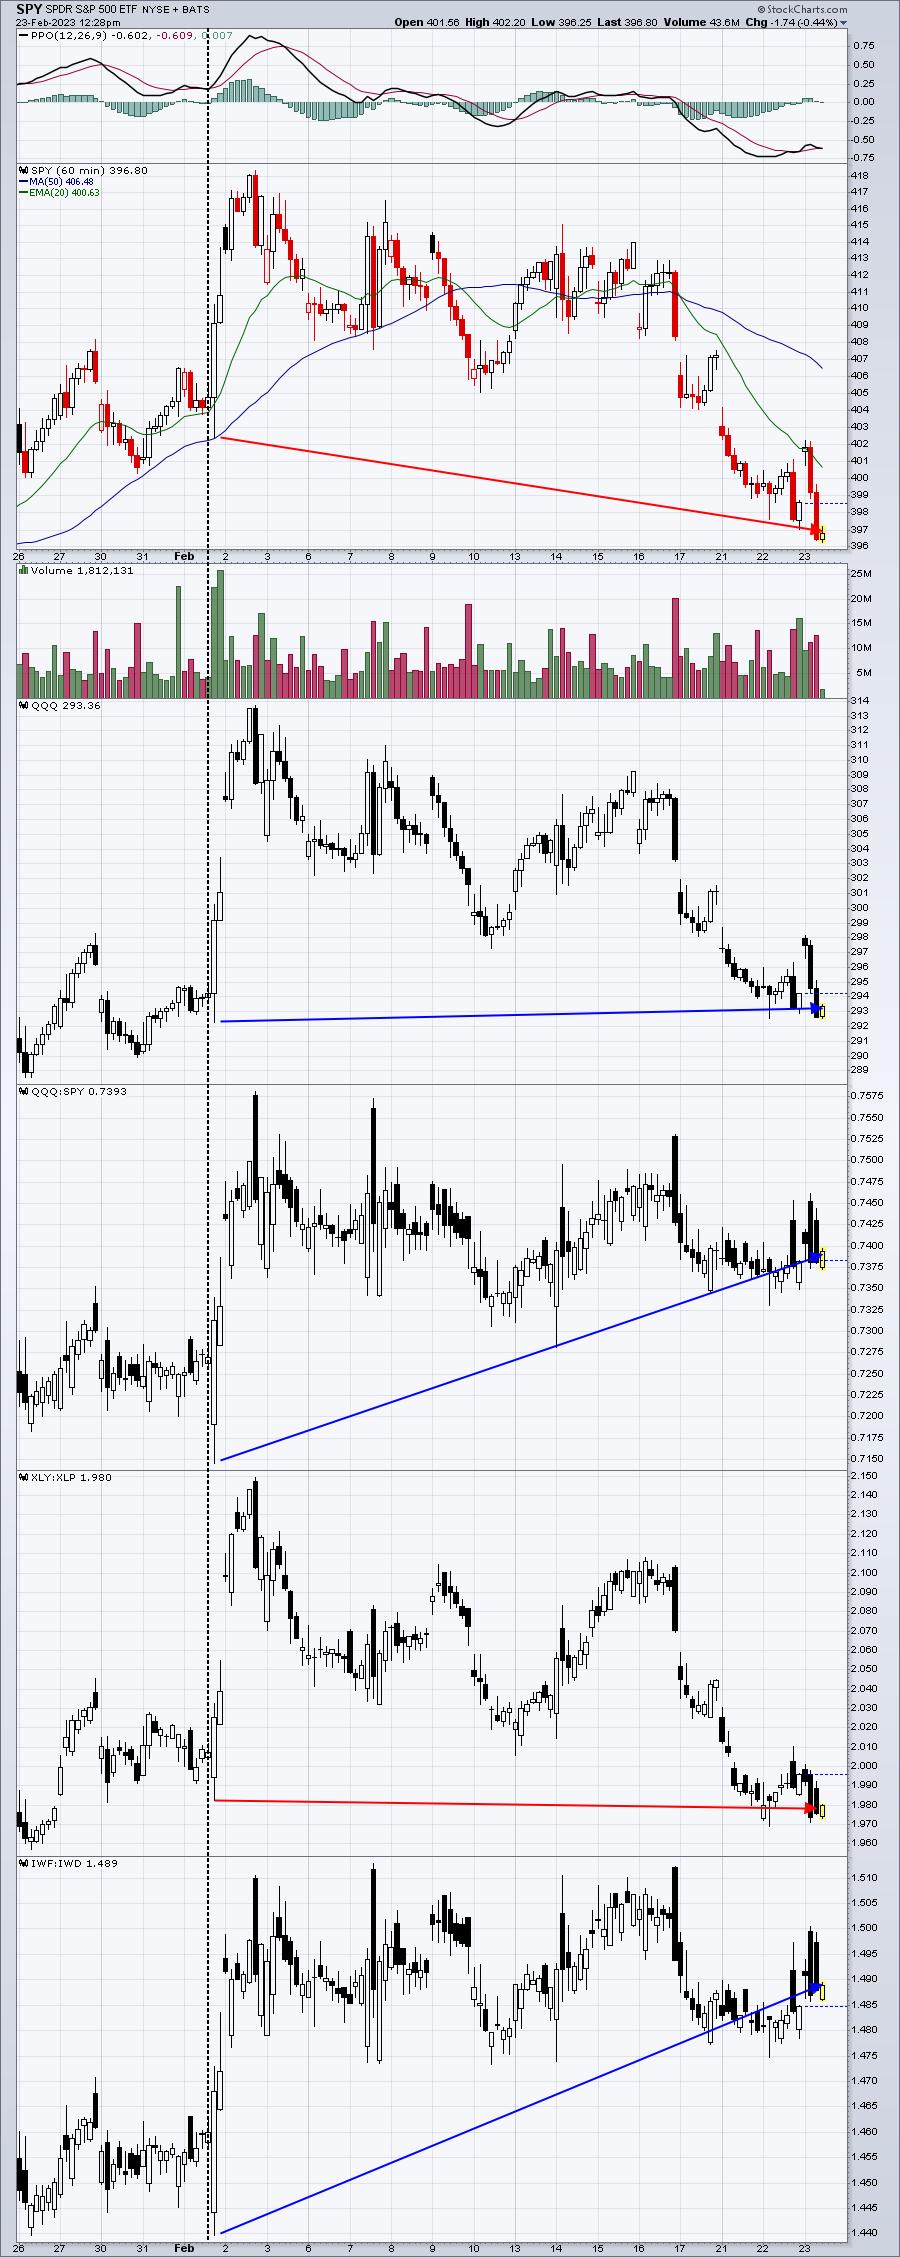
The QQQ has performed much better since that Fed meeting, indicative of market participants' willingness to hold riskier assets, which is a good signal for stocks. The XLY:XLP ratio has fallen very slightly, while the other key ratios have strengthened. Overall, I view this picture as fairly bullish, supporting my thesis that Wall Street continues to invest as though stock prices will rise later in 2023.
Also, I didn't annotate anything on this chart, but note that as the SPY falls the past couple days, the PPO is beginning to turn back up. Selling momentum in the very near-term appears to be waning. It doesn't guarantee us a rally here, but the odds are improving. I will complete my transition to my leveraged ETF position today. If the QQQ fails at 289-290, I'll revert back to just the QQQ, selling any leveraged holdings.
Sector/Industry Focus
Internet stocks have given back a lot of their recent gains and will be looking for a bounce at or near their rising 50-day SMA:
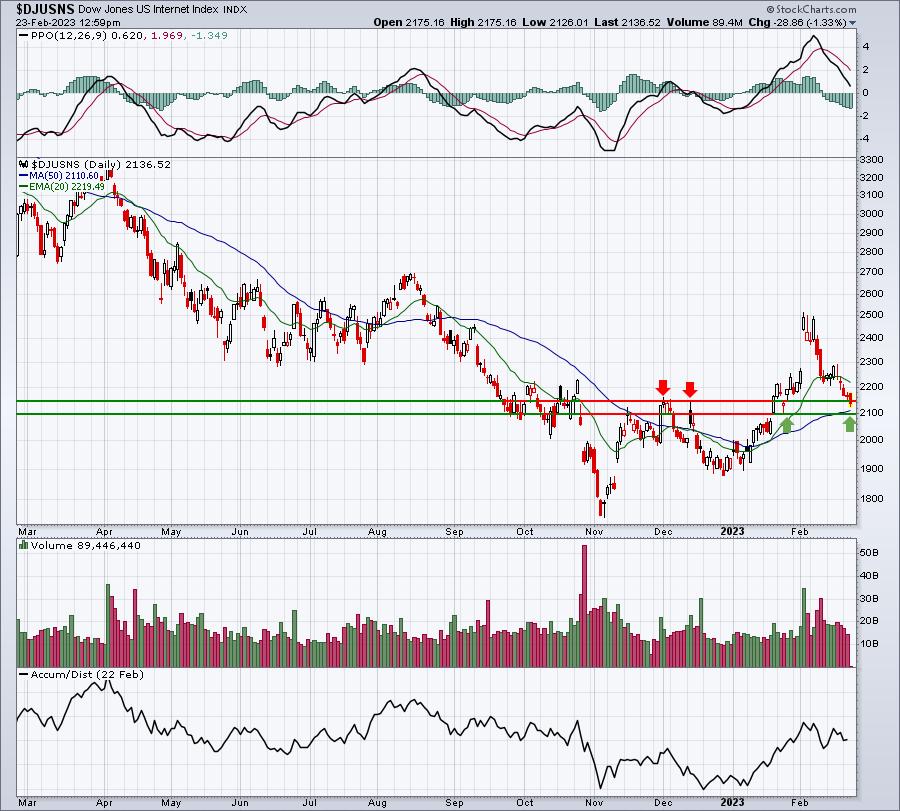
In the bottom panel, relative strength still remains pretty solid, but the combination of losing 50-day SMA support and also losing recent relative support in February would be a bearish signal for equities heading into March. I'd like to see the levels of support identified above hold.
ChartLists/Strategies
Here are two interesting stocks that I wanted to mention:
NFLX:
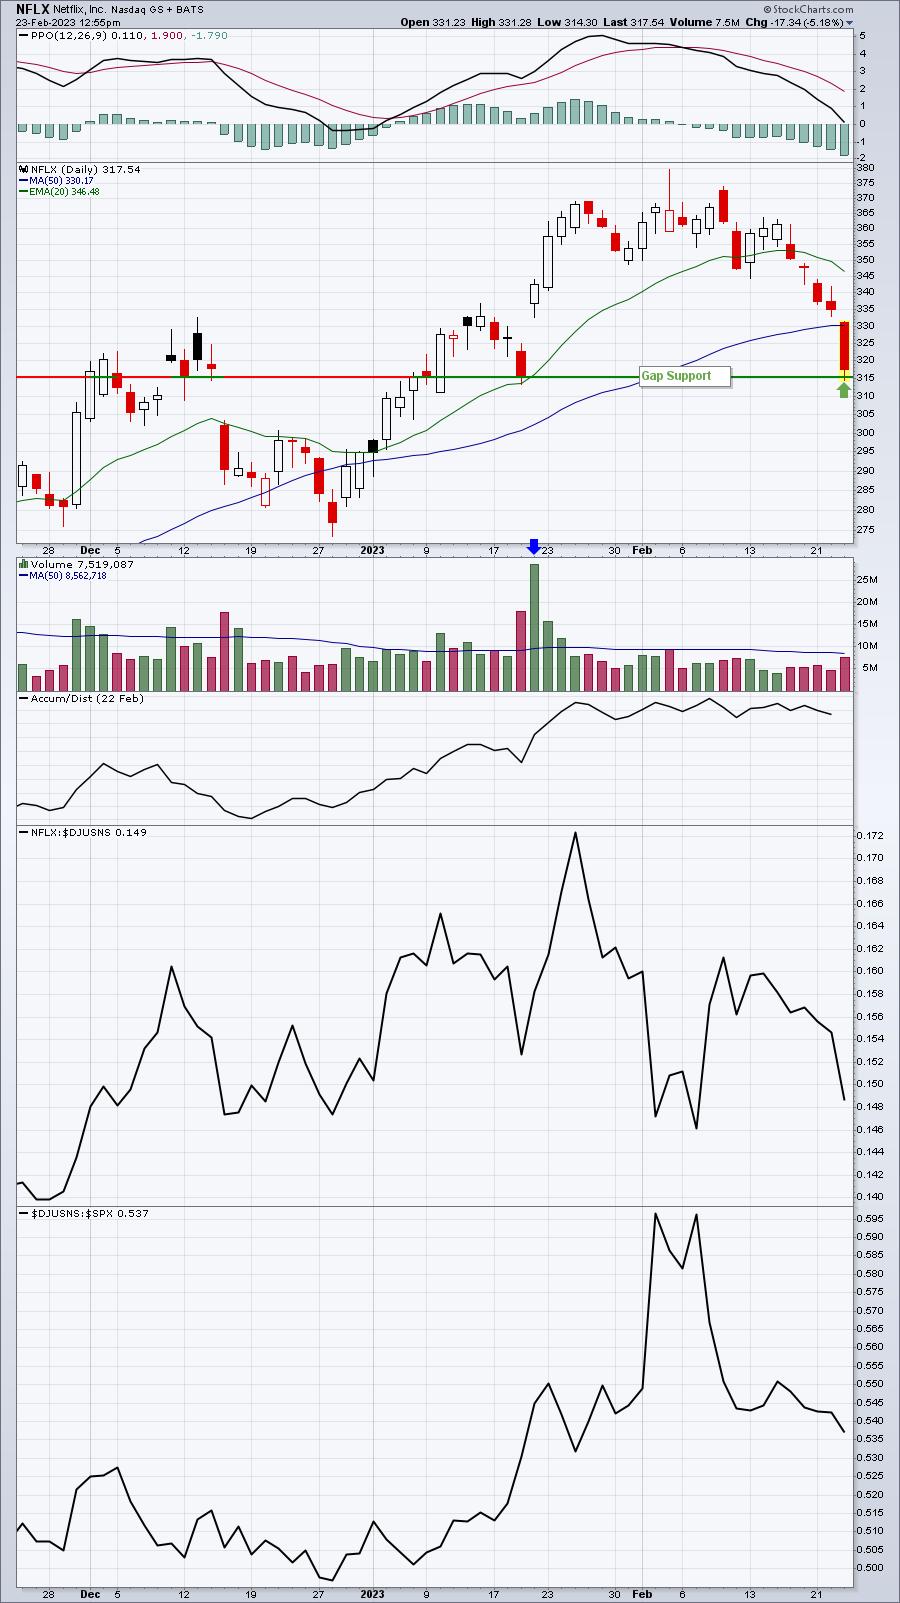
NFLX returned all the way back down to test the bottom of gap support, so I bought it literally right at gap support at 315.78. I'm expecting a bounce from here. A close beneath 315.78 and I'll exit quickly.
SPOT:
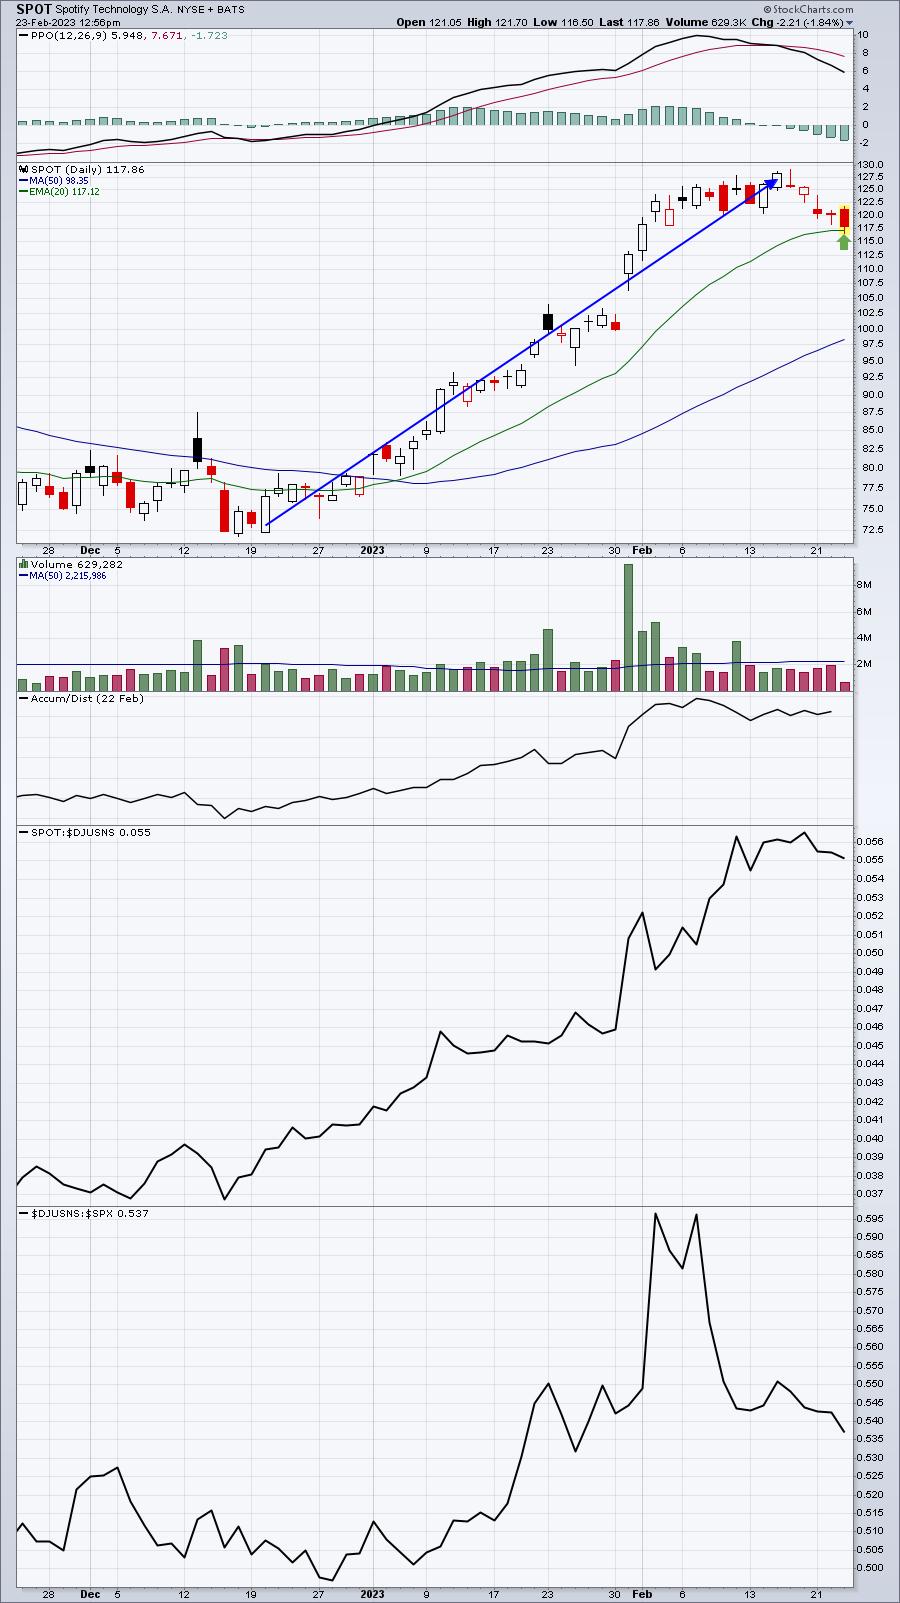
SPOT is seeing its first 20-day EMA test since spiraling higher in recent weeks. Usually, we'll see a bounce on such a test. From a trading perspective, I like trading these 20-day EMA tests, because any close below this moving average and I can exit with nearly all of my capital intact. It's simply a solid reward-to-risk trade.
Earnings Reports
Here are the key earnings reports for the next two days, featuring stocks with market caps of more than $10 billion. I also include several companies with market caps below $10 billion. Finally, any portfolio stocks that will be reporting results are highlighted in BOLD. If you decide to hold a stock into earnings, please understand the significant short-term risk that you are taking. Please be sure to check for earnings dates for any companies you own or are considering owning.
Thursday, February 23, 2023:
BABA, INTU, AMT, BKNG, EOG, MRNA, NTES, MELI, KDP, AEP, ADSK, SQ, PCG, WBD, NEM, LNG, VICI, CBRE, ALNY, EIX, GPC, DTE, PWR, PODD, PBA, LYV, LKQ, IRM, NICE, LNT, GLPI, GRAB, CE, DPZ, AMH, TFX, LSI, CUBE, MORN, PEN, FND, BBWI, VIPS, DISH, PLNT, BLD, OLED, FCN, W, SWN, BWXT, SRCL, LNTH, ENV, YETI, BHC, IRTC, CCOI, NTLA, NOMD, AAWW, INSM, SHOO, ALRM, NOG, CVNA, OII, FTCH, ATSG, NEO, INFN, KTOS, DVAX, VCEL, OPEN, PLYA, NKLA, CARS, BYND, SHYF
Friday, February 24:
BRK/A, CM, IEP, EVRG, LAMR, DINO, GTLS, CRI, BRC, GTN
Economic Reports
Initial jobless claims: 192,000 (actual) vs. 196,000 (estimate)
Q4 GDP (2nd estimate): +2.7% (actual) vs. +2.9% (estimate)
Happy trading!
Tom