
EB Daily Market Report - Monday, February 27, 2023
Upcoming Vacation Starts This Friday
I've been mentioning this in recent weeks, but I want to make sure everyone is aware. I'll be out of the country on vacation from this Friday, March 3rd through the following Friday, March 10th. There will be no Trading Places Live shows during that period, although there will likely be earlier recordings replayed on StockCharts TV on Tuesday, March 7th and Thursday, March 9th. There will be no Daily Market Reports on Friday, March 3rd or the following week, but John Hopkins will provide everyone at least a brief market update each day. There will be no EB Weekly Portfolio Report on Sunday, March 5th, though I should be back in time to provide one on Sunday, March 12th.
I am working on updating all the ChartLists and my plan is to have all key ChartLists (SECL, SFECL, SADCL, RGCL, and BTCL) completed prior to leaving on March 3rd. I am also striving to complete both the March Seasonality and March Short Reports before I go as well. It should be a fairly quiet period from March 3rd through March 10th as earnings season slows down significantly and there'll be no more Fed meetings until March 21-22. The jobs report will be out on Friday, March 3rd, so we could see a bit of fireworks that day, but otherwise it should be relatively quiet.
Executive Market Summary
- Futures were up overnight and our major indices gapped higher at the opening bell
- This morning's strength follows the worst week of 2023 as the S&P 500 lost 2.67% last week
- 7 of 11 sectors are up today, with consumer discretionary (XLY, +0.92%) leading the way
- Automobiles ($DJUSAU, +3.76%) are aiding discretionary stocks as Tesla (TSLA, +4.20%) rebounds
- Railroads ($DJUSRR, +4.48%) are having their best day of 2023 and potentially one of their best days in the past year
- Renewable energy ($DWCREE, +2.12%) is leading technology (XLK, +0.85%) higher as aggressive areas of the market are performing well today
- Commodity prices are mostly higher today, especially copper ($COPPER, +1.47%) - more on copper below in the Market Outlook
- The 10-year treasury yield ($TNX) is down 2 basis points to 3.93%, despite a soaring January pending home sales report
- Union Pacific (UNP, +9.13%) is leading the S&P 500 and railroads higher after its CEO Lance Fritz announced he was stepping down; nothing screams "you did a great job!" quite like stepping down and seeing your stock soar (sarcasm)
Market Outlook
I continuously review the technical outlook of copper (CPER) as it's the one commodity most closely tied to global economic growth. Below is a chart of CPER, highlighting my current outlook, along with its positive correlation with the benchmark S&P 500:
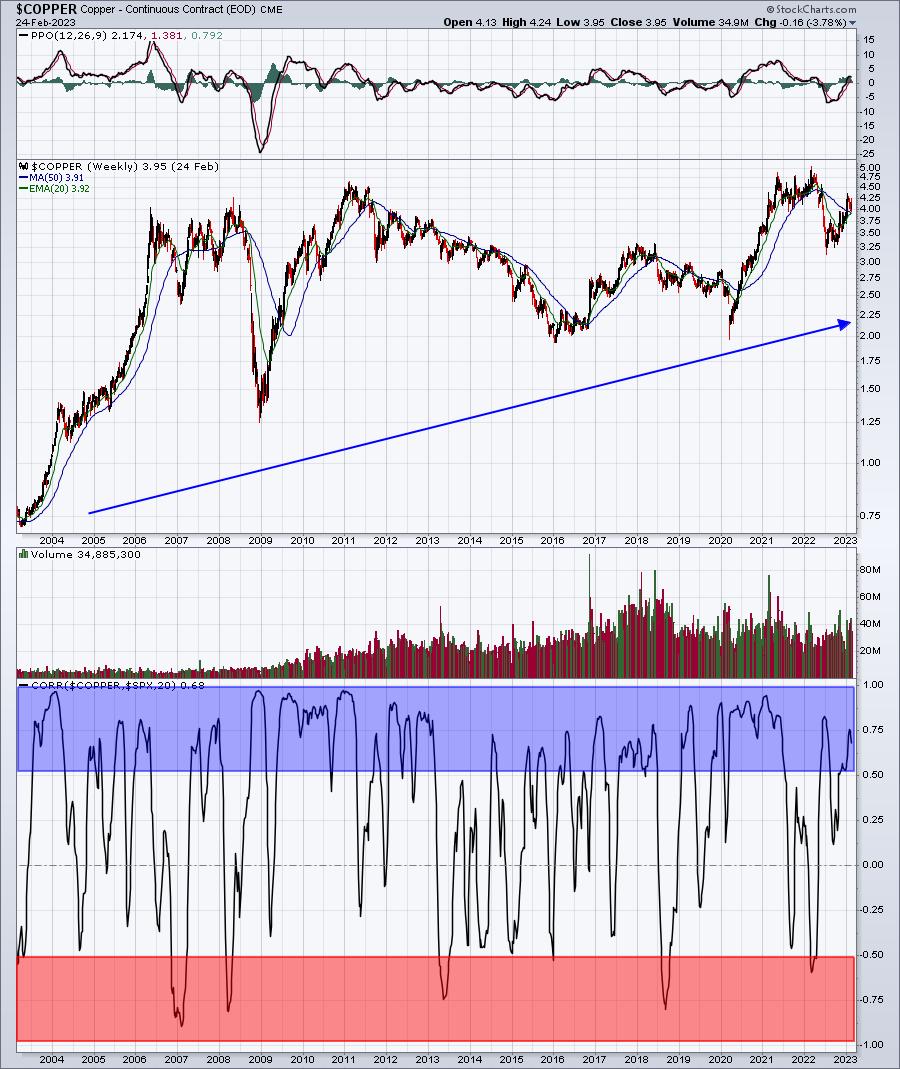
The blue-shaded area represents strong positive correlation (above +0.5). This suggests that copper and the S&P 500 are trending in the same direction. The red-shaded area represents strong inverse correlation (below -0.5). These readings suggest that copper and the S&P 500 are trending in opposite directions. From one quick look at this chart, I can conclude that copper and the S&P 500 usually move together. So as long as copper trends higher, we should expect the S&P 500 to do the same thing, right? Well, let's look at a shorter-term, daily chart of copper (CPER):
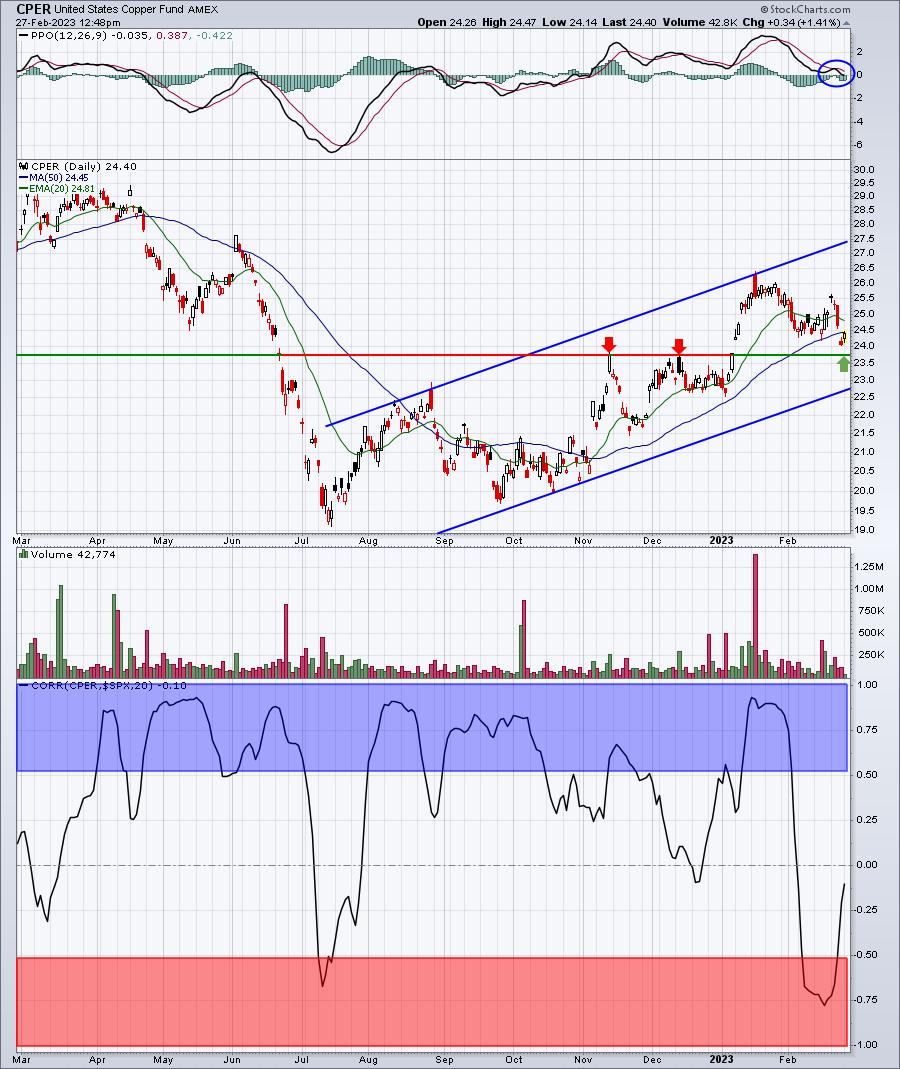
For this chart, I switched from $COPPER to CPER, because the latter provides intraday prices. That way, we can check out today's action, where we can see copper prices rebounding. For now, CPER is trending higher, just like the S&P 500. We remain above all key technical support levels on CPER, so presently I'd argue that copper prices support a higher S&P 500. This is just one signal, but it's an important one to continuously track, because of its strong positive correlation.
Sector/Industry Focus
Home construction's ($DJUSHB, +0.32%) reaction to the huge pending home sales report for January is rather subdued today, but the longer-term weekly chart remains quite bullish. Check this out:
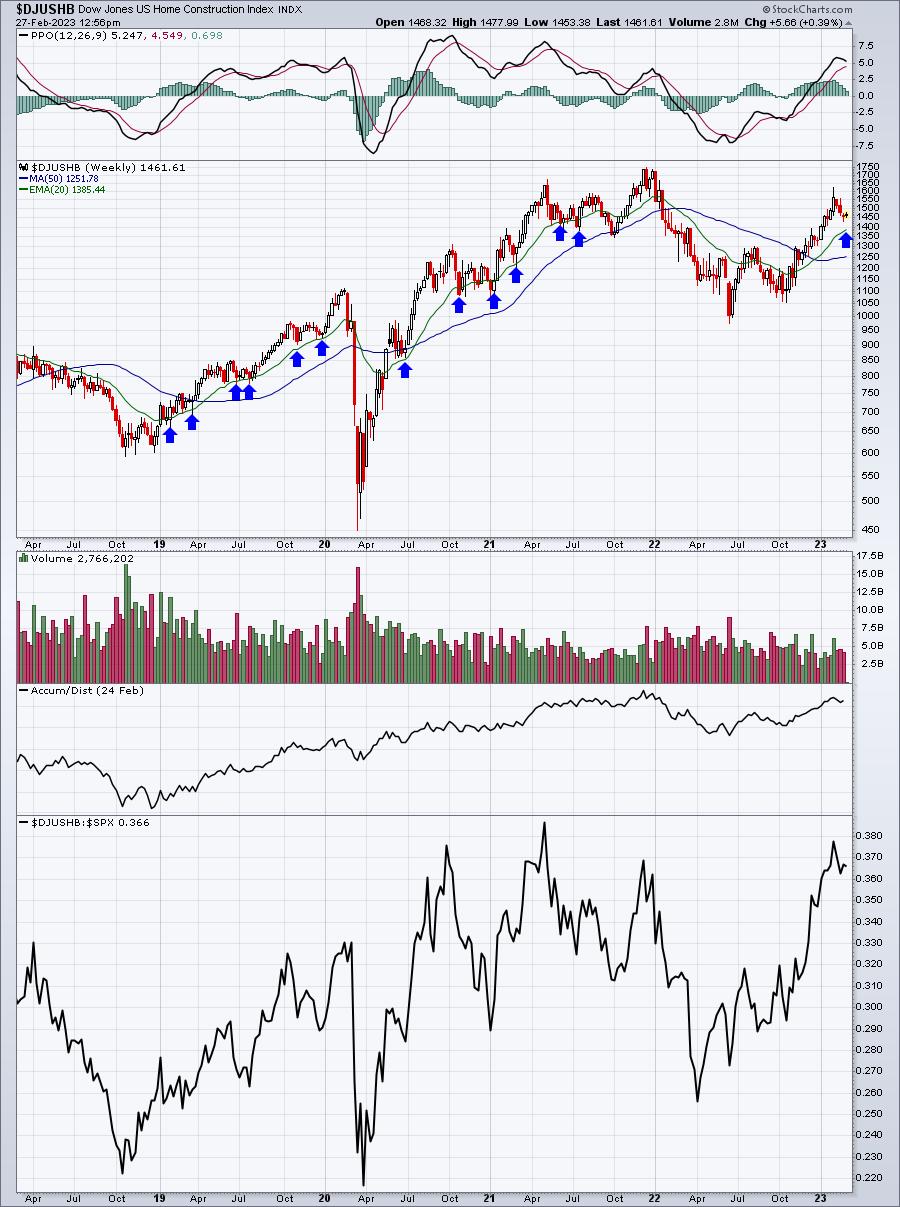
On the long-term 5-year weekly chart of the home construction group, there's a clear uptrend in place and we have yet to even see our first 20-week EMA test. The blue arrows show how successful these tests tend to be, so keep that in mind. While the DJUSHB could go substantially higher from here, the absolute best reward-to-risk entry into the group is on a 20-week EMA test. That's what history tells us.
ChartLists/Strategies
Given today's strength and last week's weakness, I ran our Downtrend Reversal scan against the following primary ChartLists:
- Strong Earnings (SECL)
- Strong Future Earnings (SFECL)
- Strong AD (SADCL)
- Raised Guidance (RGCL)
Here was the scan and the results:
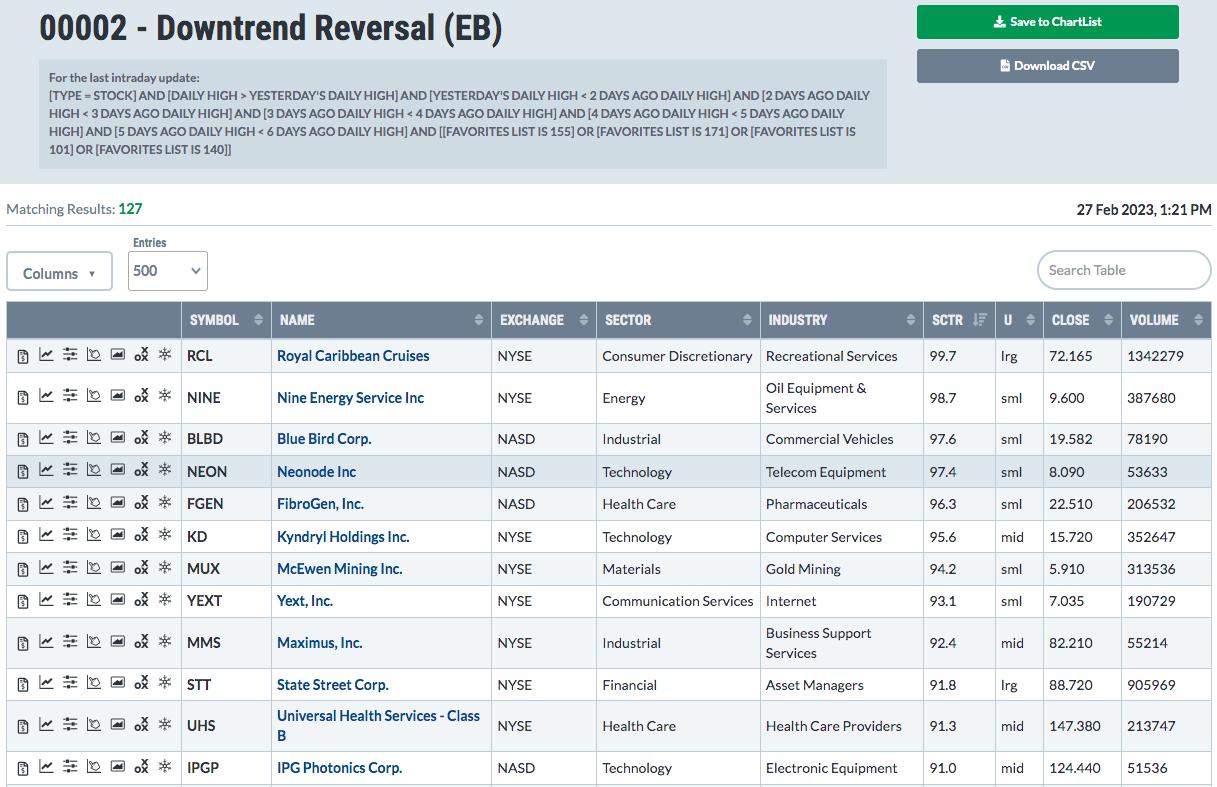
There were 127 stocks returned. Obviously, a lot of our stocks are reversing higher after several days of trending lower. Is this a big reversal or a temporary reprieve? Well, history would suggest we could see a bounce here as we open a new calendar month. Money flows from 401k's, pensions, etc. tend to move prices higher. So I'd guess that the probabilities favor the bulls short-term. Here are 2 of the 127 stocks returned that look like they're capable of running higher from here:
YEXT:
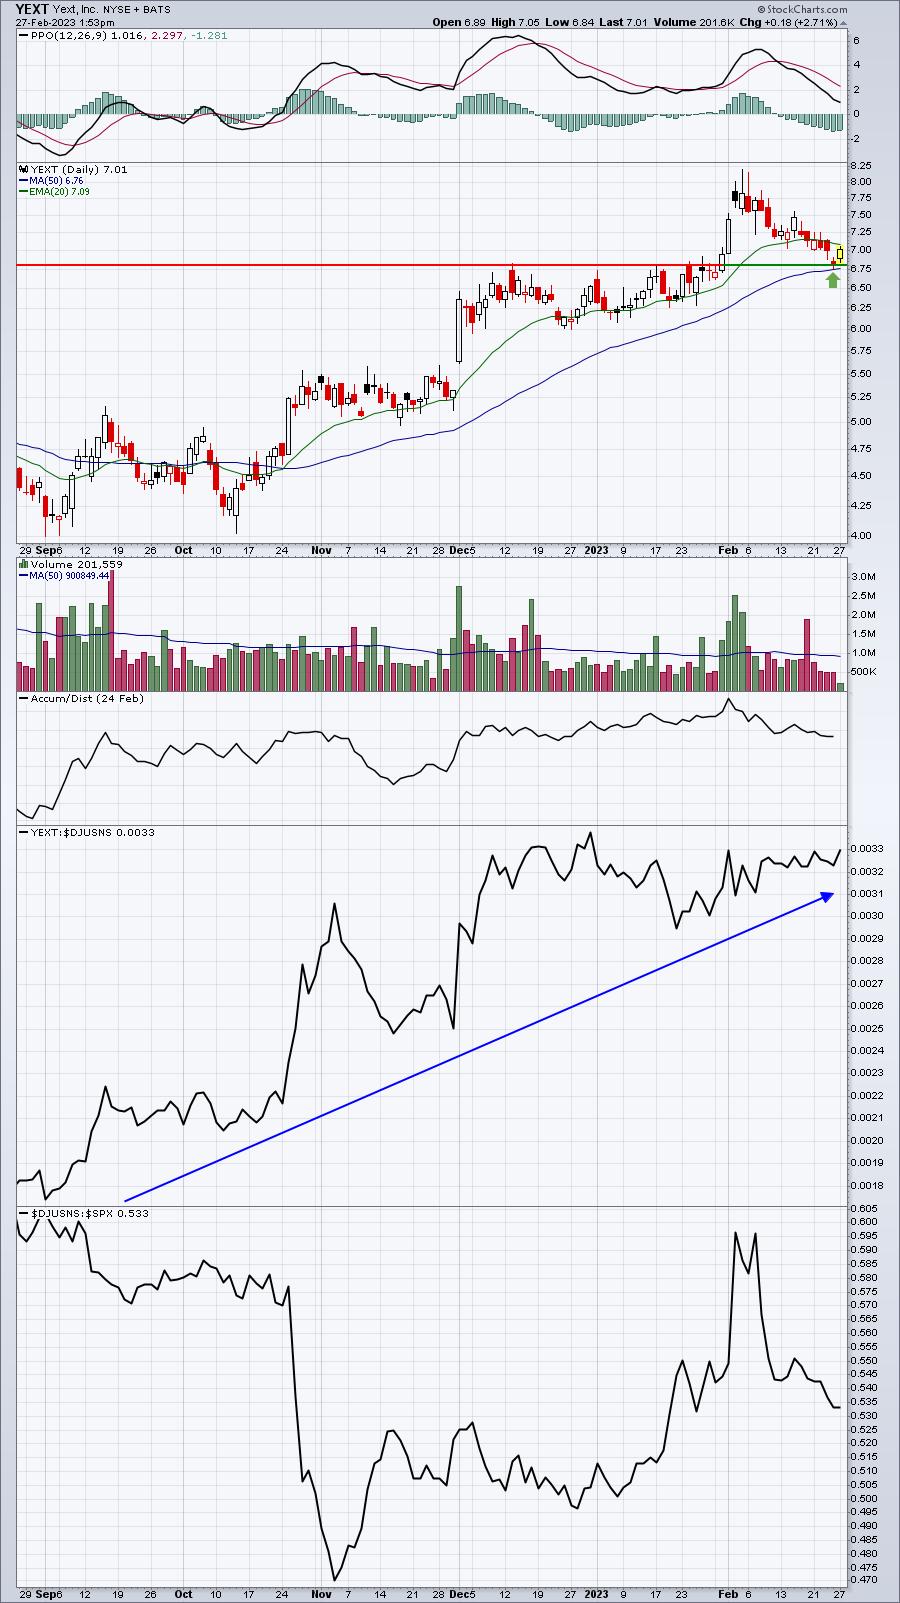
YEXT is one that I've mentioned recently. It's fallen a bit further, but has held both price support and its 50-day SMA. Internet stocks have pulled back considerably, so that's clearly been a factor. But YEXT's relative strength is building again and it's ready to break out vs. its internet peers. A rally from here wouldn't be a surprise at all.
CAR:
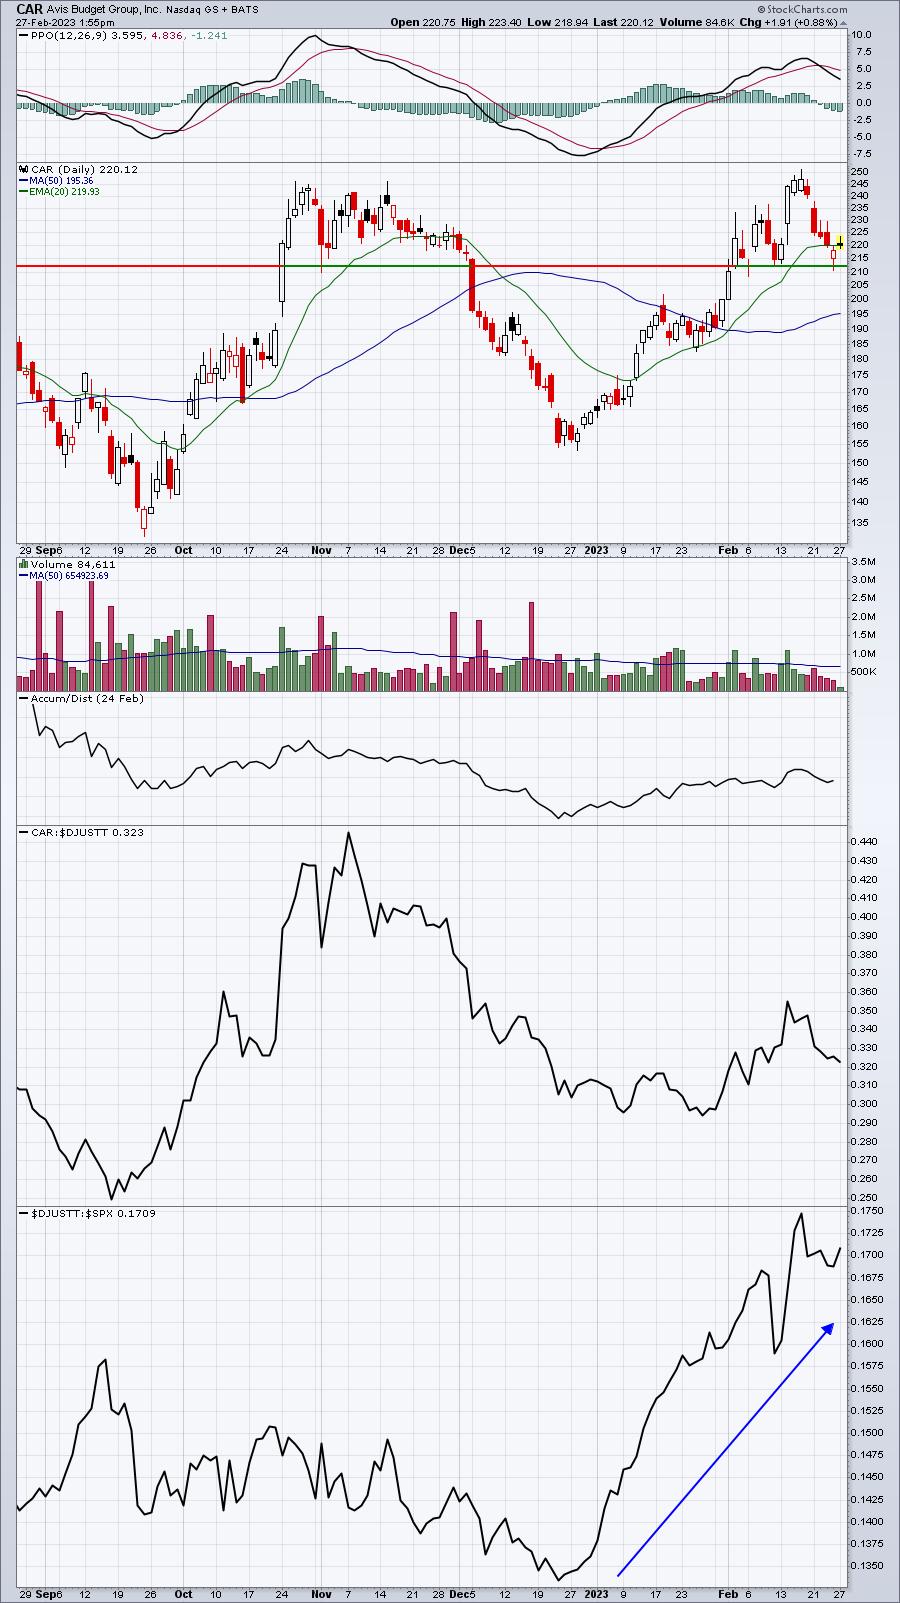
Travel & tourism stocks ($DJUSTT) have shown excellent relative strength in 2023. CAR has been strengthening recently and the 210-215 has proven to be excellent price support in recent sessions. As long as that support holds, I'd be looking for CAR to resume its prior uptrend and test its recent high near 250.
Earnings Reports
Here are the key earnings reports for the next two days, featuring stocks with market caps of more than $10 billion. I also include several companies with market caps below $10 billion. Finally, any portfolio stocks that will be reporting results are highlighted in BOLD. If you decide to hold a stock into earnings, please understand the significant short-term risk that you are taking. Please be sure to check for earnings dates for any companies you own or are considering owning.
Monday, February 27:
OXY, WDAY, OKE, LI, HEI, BGNE, ZM, BMRN, AES, VTRS, WTRG, OVV, DAR, UHS, OSH, PNW, MKSI, PRGO, TGNA, ACAD, FRPT, PGNY, AMRC, AXSM, ITRI, TASK, FSR
Tuesday, February 28:
TGT, BMO, BNS, MNST, SRE, AZO, A, ROST, HPQ, VRSK, CPNG, EC, FSLR, RIVN, SJM, RKT, EDR, AXON, BLDR, BSY, RYAN, SRPT, BKI, MASI, AAP, XRAY, NXST, ADT, NCLH, IGT, FOUR, NTRA, SWX, OLPX, AMBA, DUOL, MQ, AMC, RVNC, PRFT, KTB, URBN, TGTX, CARG, SILK, SPCE, OMI, MYGN, DDD, WRBY
Economic Reports
January durable goods: -4.5% (actual) vs. -4.0% (estimate)
January durable goods ex-transports: +0.7% (actual) vs. +0.0% (estimate)
January pending home sales: +8.1% (actual) vs. +1.0% (estimate)
Happy trading!
Tom