
EB Daily Market Report - Wednesday, March 1, 2023
ChartLists Updated
I'm working to update all of our ChartLists before I head on vacation. To that end, here are four that have been updated:
- Seasonality - March (SEASCL)
- Short Squeeze (SSCL)
- Strong Earnings (SECL)
- Strong Future Earnings (SFECL)
The SEASCL and SSCL have already been updated on our website. The SECL and SFECL are complete, but haven't yet been updated on our website. That should take place later this afternoon or first thing Thursday morning.
Vacation Starts This Friday
I've been mentioning this in recent weeks, but I want to make sure everyone is aware. I'll be out of the country on vacation from this Friday, March 3rd through the following Friday, March 10th. There will be no Trading Places Live shows during that period, although there will likely be earlier recordings replayed on StockCharts TV on Tuesday, March 7th and Thursday, March 9th. There will be no Daily Market Reports on Friday, March 3rd or the following week, but John Hopkins will provide everyone at least a brief market update each day. There will be no EB Weekly Portfolio Report on Sunday, March 5th, though I should be back in time to provide one on Sunday, March 12th.
I am working on updating all the ChartLists and my plan is to have all key ChartLists (SECL, SFECL, SADCL, RGCL, and BTCL) completed prior to leaving on March 3rd. I am also striving to complete both the March Seasonality and March Short Reports before I go as well. It should be a fairly quiet period from March 3rd through March 10th as earnings season slows down significantly and there'll be no more Fed meetings until March 21-22. The jobs report will be out on Friday, March 3rd, so we could see a bit of fireworks that day, but otherwise it should be relatively quiet.
Executive Market Summary
- Futures were mostly higher overnight, but turned negative this morning
- Our major indices gapped lower, strengthened temporarily this morning, and have been under further pressure the past couple hours
- The 10-year treasury yield ($TNX) is up 8 basis points to 3.99%, but did touch 4.0% for the first time since November earlier in today's session
- Volatility ($VIX) is up 1.5% today, but it's been trending lower the past few days - same as the S&P 500; this can be a critical signal as fear usually rises with selloffs and we're really not seeing that right now
- Energy (XLE, +1.82%) and materials (XLB, +0.83%) is where much of today's strength lies
- Defensive sectors are tumbling to start March as real estate (XLRE, -1.94%), utilities (XLU, -1.83%), and consumer staples (XLP, -1.01%) are all down big
- Consumer discretionary (XLY, -1.67%) is also having a rough session, as home improvement retailers ($DJUSHI, -3.81%) are down in sympathy with Lowes Companies (LOW, -6.92%)
- LOW reported its quarterly results this morning and Wall Street isn't enamored; LOW is at its lowest level since early November and is today's worst S&P 500 performer
Market Outlook
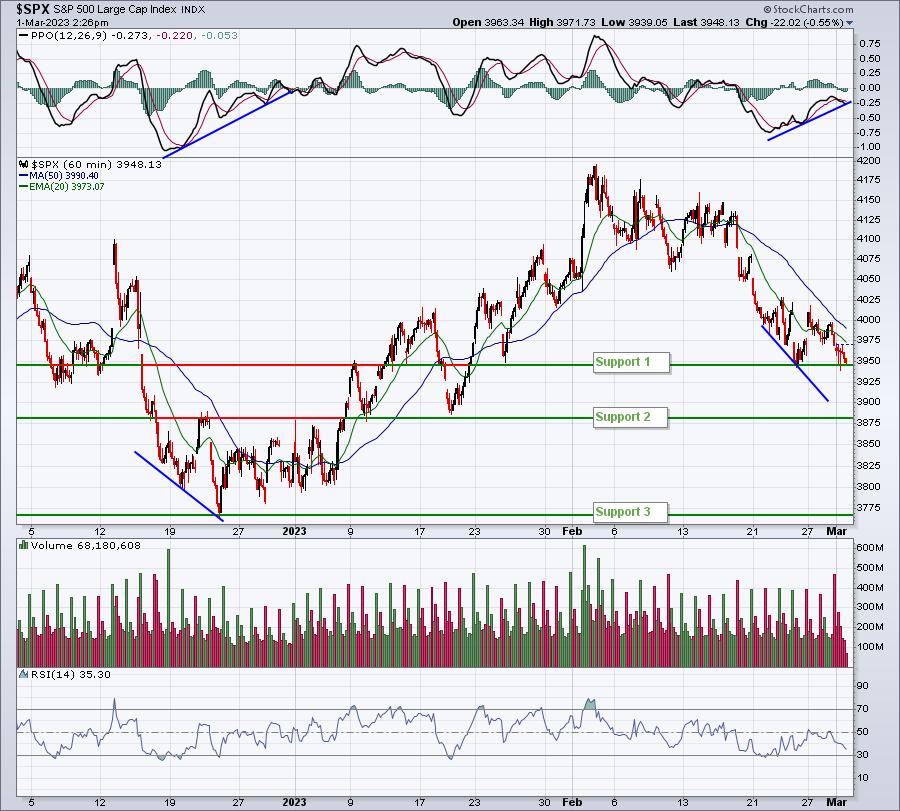
Let's look at the hourly chart of the S&P 500 and NASDAQ 100 to see how the current consolidation period is unfolding:
S&P 500 ($SPX):
NASDAQ 100 ($NDX):
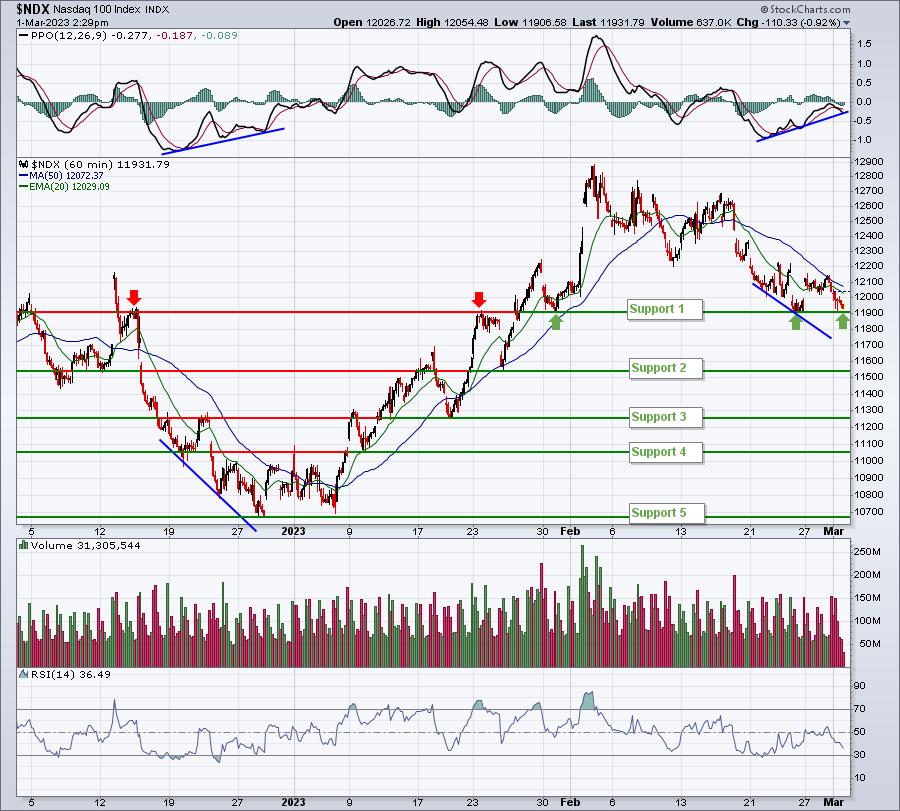
You can see that there are a couple more support levels on the NDX as we move lower. In both charts, however, you can see that momentum has improved. In other words, the quick drop that we saw in the second half of February has slowed. That doesn't mean we can't move down through support with PPOs accelerating lower. I'm simply pointing out how the last bottom formed on the hourly chart and highlighting the similarities. Nothing is more important than actual price action, so we should be prepared to accept a price breakdown for what it is and have patience for the next move higher. Remember, March doesn't have a great track record and it typically favors more defensive- and value-oriented stocks. Those wanting to see aggressive stocks explode higher may have to pin their bullishness on historical strength in that area usually found in April.
Sector/Industry Focus
The 10-year treasury yield ($TNX) continues its move higher and today is touching the 4.0% level, which had not been seen since early November. If there's one thing that could spook U.S. equities, especially growth stocks, it's higher treasury yields. For those unfazed by short-term selling, I wouldn't be overly concerned. But for those those who seek short-term safety when downtrends accelerate, keep a close eye on the QQQ support level around 290. Failure to hold it on a closing basis could quickly lead to a 50-day SMA test, which is currently at 285.87.
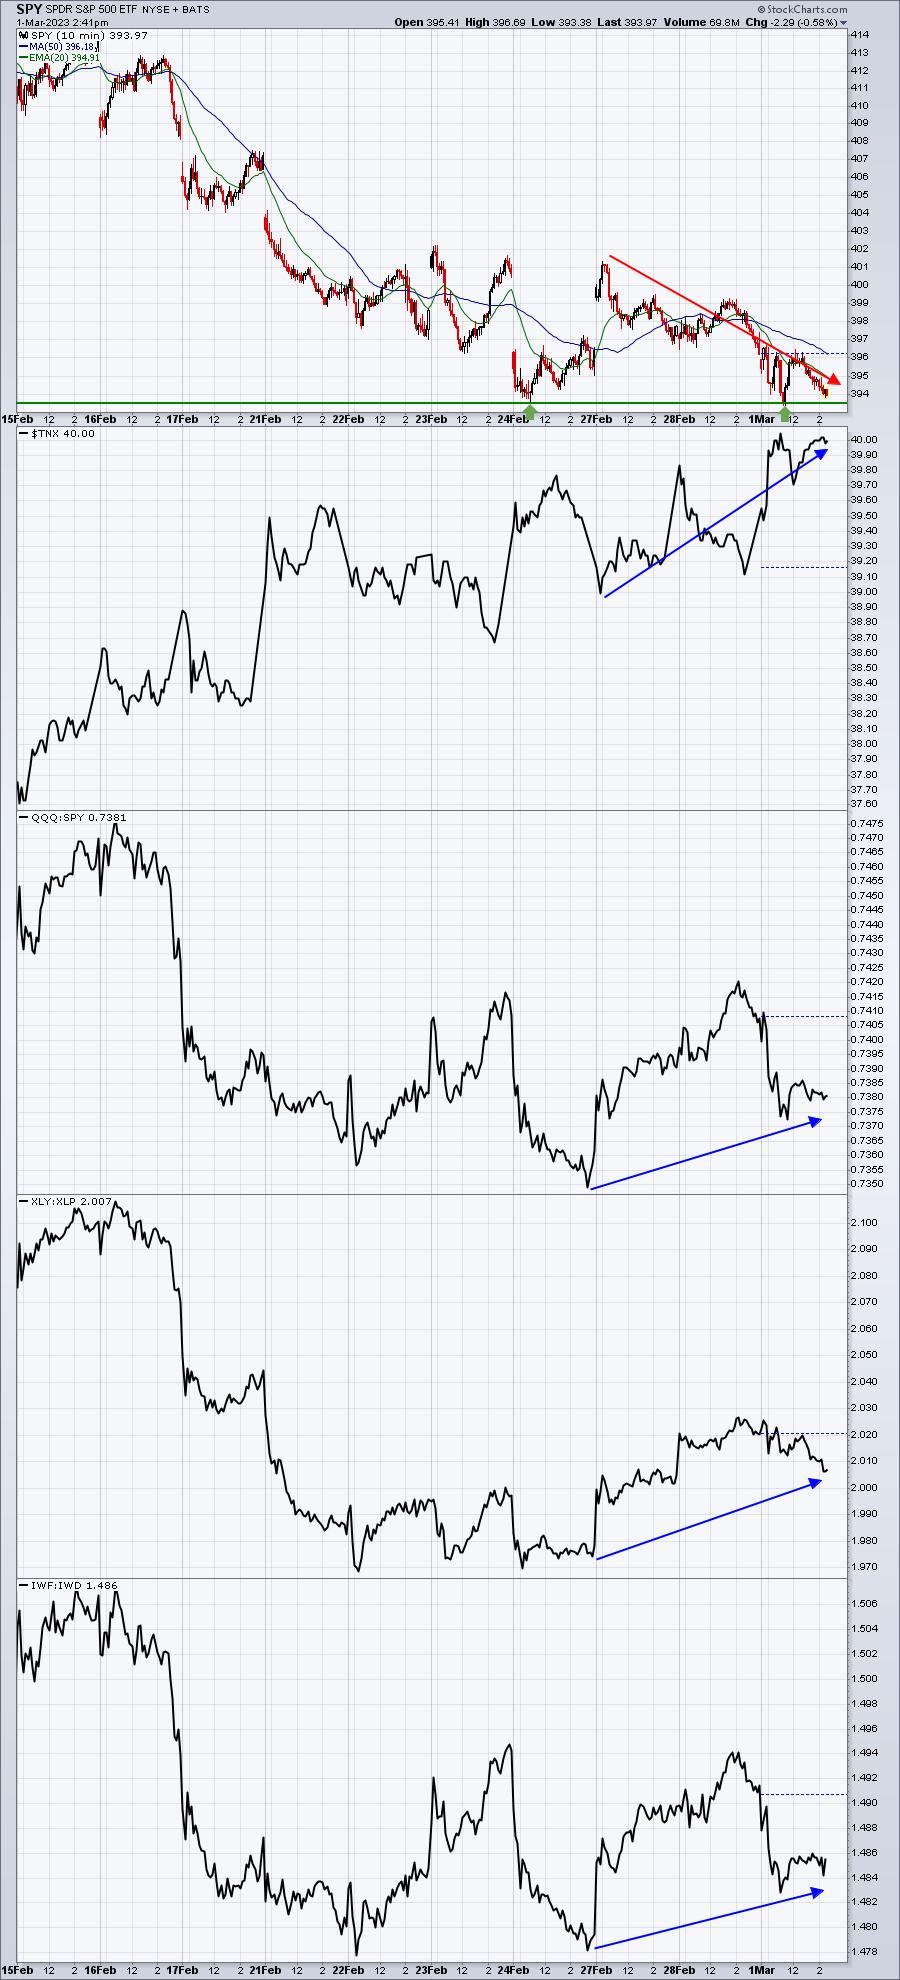
It's hard for me to grow overly bearish when I see interest rates moving higher, the S&P 500 moving lower, BUT key growth ratios holding previous lows and even moving UP. Now that might all change in the final hour today and over the next several days, but at least for now, the message I'm getting is that the selling in stocks is temporary. I would still respect a close on the QQQ beneath 290, though. I can always move back into leveraged ETFs at a more appropriate time. This is the level that I want to see the QQQ turn back higher and seasonality would also suggest a short-term rally has a higher-than-normal probability.
ChartLists/Strategies
I am going to pass on growing too aggressive with individual stocks here. If you decide to take on bigger or more positions, that's fine. I'd simply be careful if support levels identified above begin to break down. I always want to make sure I'm okay to trade another day if support fails.
Earnings Reports
Here are the key earnings reports for the next two days, featuring stocks with market caps of more than $10 billion. I also include several companies with market caps below $10 billion. Finally, any portfolio stocks that will be reporting results are highlighted in BOLD. If you decide to hold a stock into earnings, please understand the significant short-term risk that you are taking. Please be sure to check for earnings dates for any companies you own or are considering owning.
Wednesday, March 1:
CRM, RY, LOW, SNOW, DLTR, VEEV, HZNP, SPLK, NIO, OKTA, JAZZ, PSTG, PLUG, CLH, CELH, MLCO, WB, WEN, BOX, DV, KSS, AXNX, AEO, FTDR, MDRX, EVRI, XHR, JACK, ANF, ZUO
Thursday, March 2:
AVGO, COST, TD, BUD, CNQ, VMW, MRVL, KR, DELL, HRL, ARGX, HPE, ZS, BBY, COO, AER, BURL, BILI, ESTC, M, CHPT, SFM, VSCO, JWN, PAGS, PDCO, AI, UTZ, SIX, XPOF
Economic Reports
February PMI manufacturing: 47.3 (actual) vs. 47.8 (estimate)
February ISM manufacturing: 47.7 (actual) vs. 48.0 (estimate)
January construction spending: -0.1% (actual) vs. +0.2% (estimate)
Happy trading!
Tom