
EB Daily Market Report - Special Report - Monday, March 13, 2023
I was expecting a crazy week and we've certainly started it that way. Last night, futures were soaring with the Dow Jones up 300 points and the NASDAQ leading on a relative basis. But, by the time the stock market opened this morning, we had seen a complete reversal. The Dow Jones opened more than 200 points lower, the S&P 500 nearly tested 3800 this morning, and the NASDAQ 100, after opening well below its 50-day SMA, has moved well above it, printing a bullish engulfing candle - if it holds into today's close. The Volatility Index ($VIX) shot higher this morning to nearly 31, the 10-year treasury yield ($TNX) has tumbled 17 basis points to 3.53%, though it's risen 11 basis points off the earlier low of 3.41%. On Thursday morning, the TNX was over 4.00% and today we nearly took out TNX support from December, January, and February. Check this out:
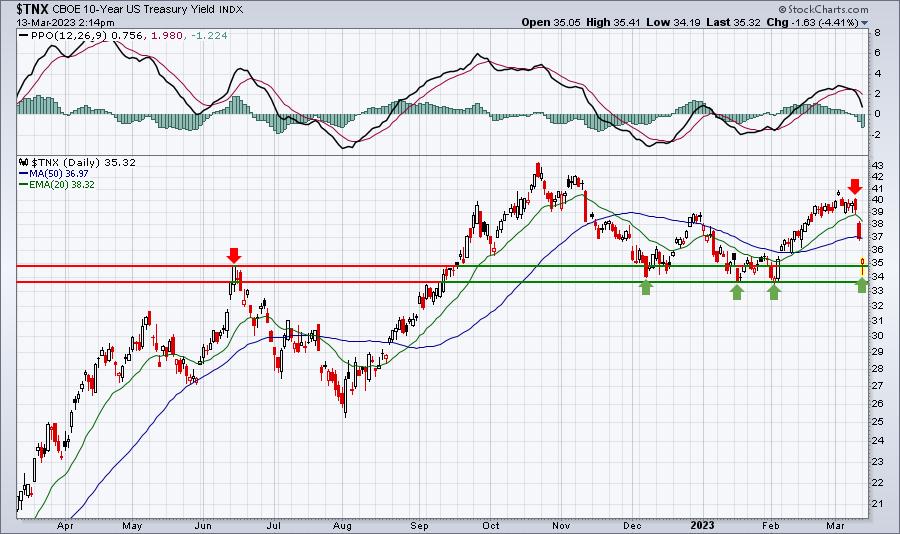
I'm leaning towards this morning's low being THE low. I'm not completely sold on that as the Volatility Index remains elevated and another spurt higher into today's close could result in yet another gap lower tomorrow. But right now, the VIX is well off its earlier high, similar to what it did on Friday. Two days of long tails to the upside on the VIX has me thinking we've bottomed. Another sentiment indicator, the 5-day moving average of the equity-only put-call ratio ($CPCE), will likely be in the mid-.80s at today's close. We finished at .81 on Friday and history tells us that readings at .80 and above typically result in major bottoms in the stock market. Here are the last five years:
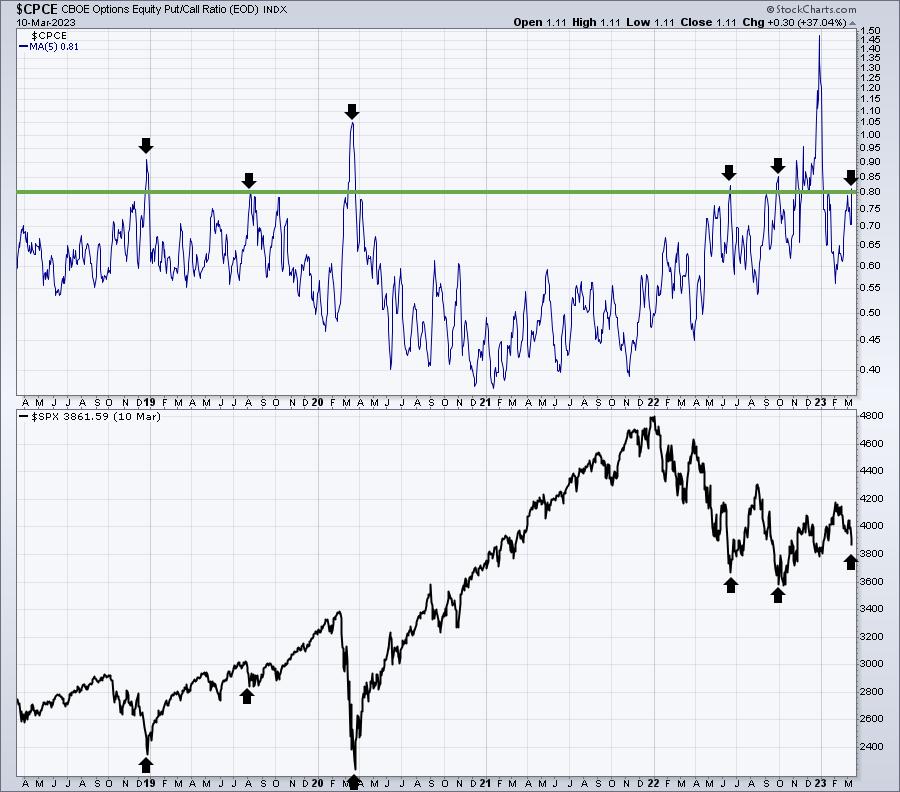
This 5-day CPCE is going to be higher at today's close, because today will replace the reading from last Monday (.67). We could see a 5-day reading at or above .85. Historically, that's a very high reading that does a great job of marking key market bottoms. I moved back into a partial position of the QQQ just after today's open. I wasn't able to get the opening price as I was wrapping up my TP Live show. I've added the rest this afternoon. I would caution against using leverage, however, as the high VIX suggests to me to play it a bit safer.
There's a lot of discussion now about what the Federal Reserve might do next week. I believe they'll pause, given the uncertainty among banks right now. That's why so many folks are pouring back into the 10-year treasury over the past couple days. There's also the camp that believes a weakened banking industry to lead to more restrictive lending, potentially threatening the economy. Those in that camp would also want to buy treasuries, ahead of potentially lower interest rates.
There are other signs suggesting lower rates as well. Check out this QQQ chart (I usually use the SPY, but StockCharts is having issues with their data vendor and many ETFs, including the SPY, are not working on intraday charts):
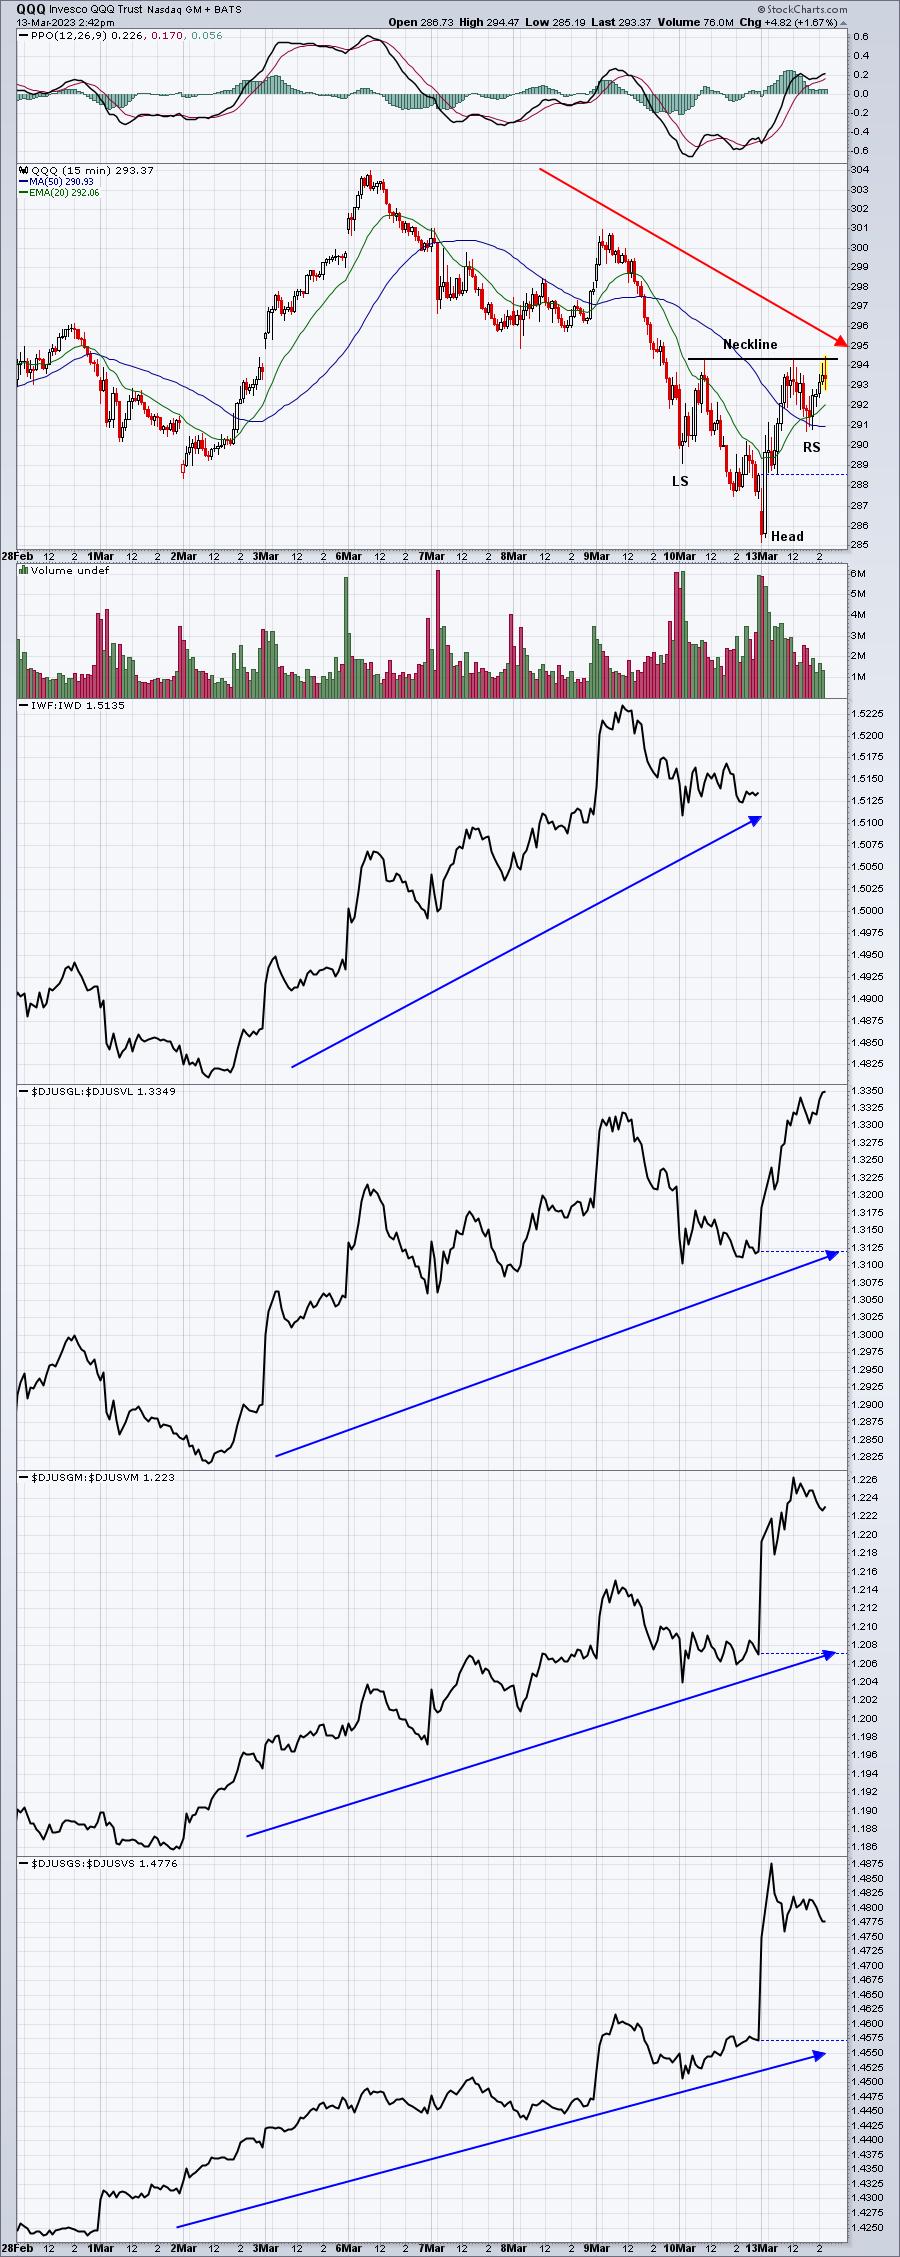
One key will be how we finish today. Does the VIX soar and do U.S. equities sell off? Or is it the opposite? We've seen the VIX move higher. We've also seen the 5-day moving average of the CPCE move higher. But please understand that the risks of shorting stocks right now is growing immensely right now. Any further move lower is also threatened by this Friday's March options expiration. We'll have our monthly Max Pain event tomorrow, but there was already net in-the-money put premium in play to start this week. Additional selling would provide much further incentive for market makers to "encourage" a rally later this week. Also, there's now a neckline that's formed in a reversing head & shoulders pattern. That doesn't mean we're going higher, but if we rally into the close today and clearly break that neckline, odds increase that further gains lie ahead.
The growth vs. value proposition on the chart above is also problematic for the bears. If you're going to argue a possible recession, why would growth stocks be leading the past two weeks, while the market moves lower? It appears to me to be more of the market manipulation that we've endured since May 2022.
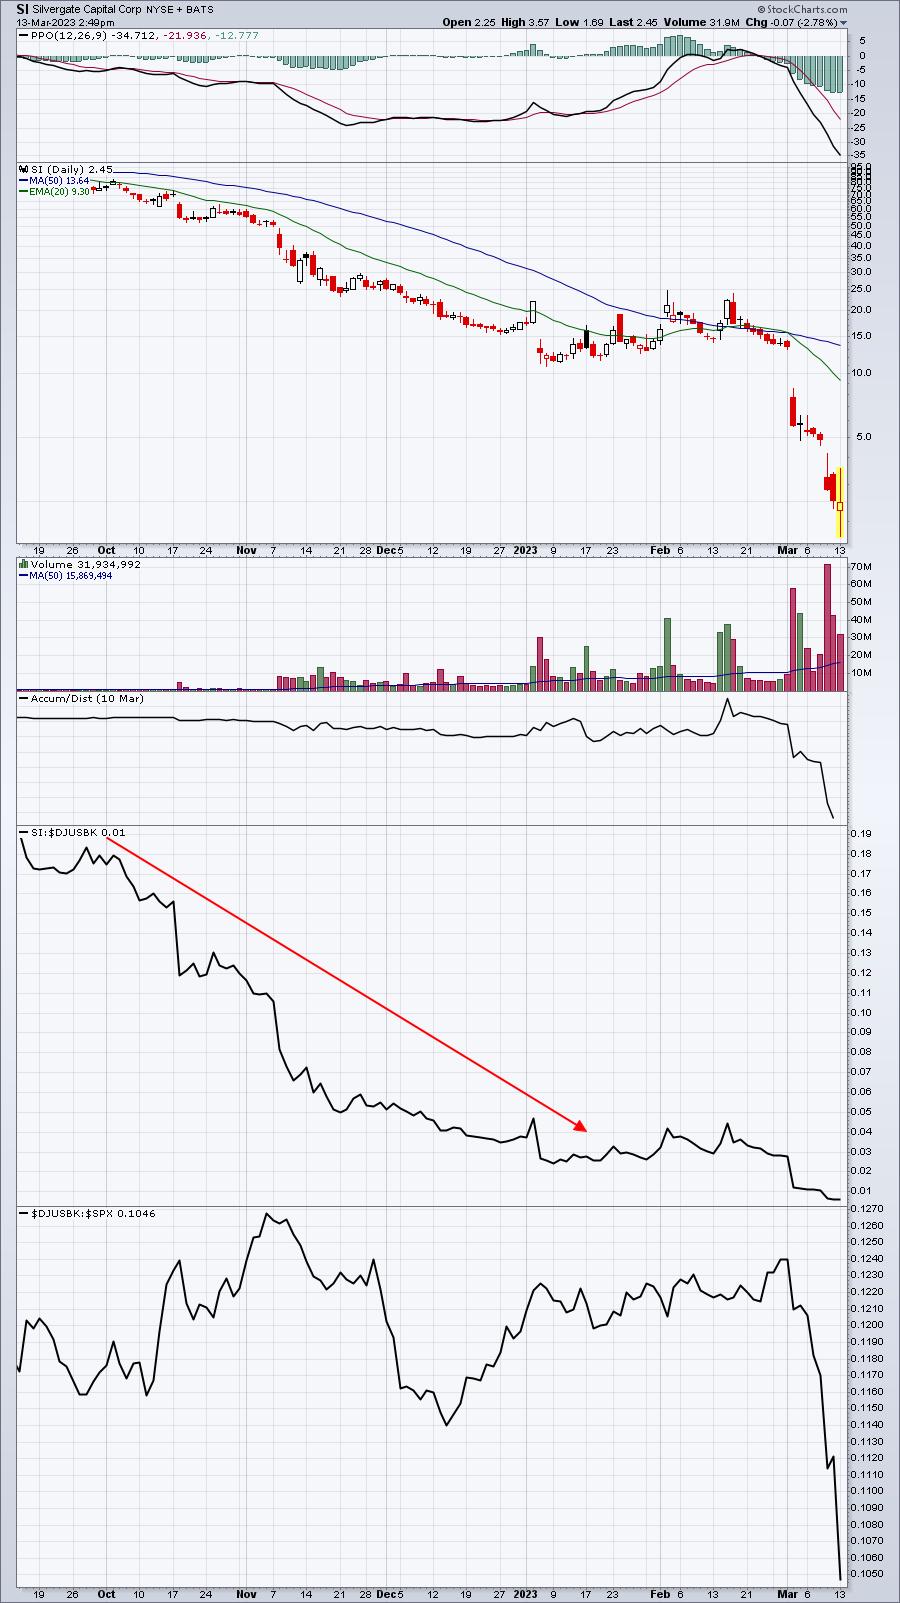
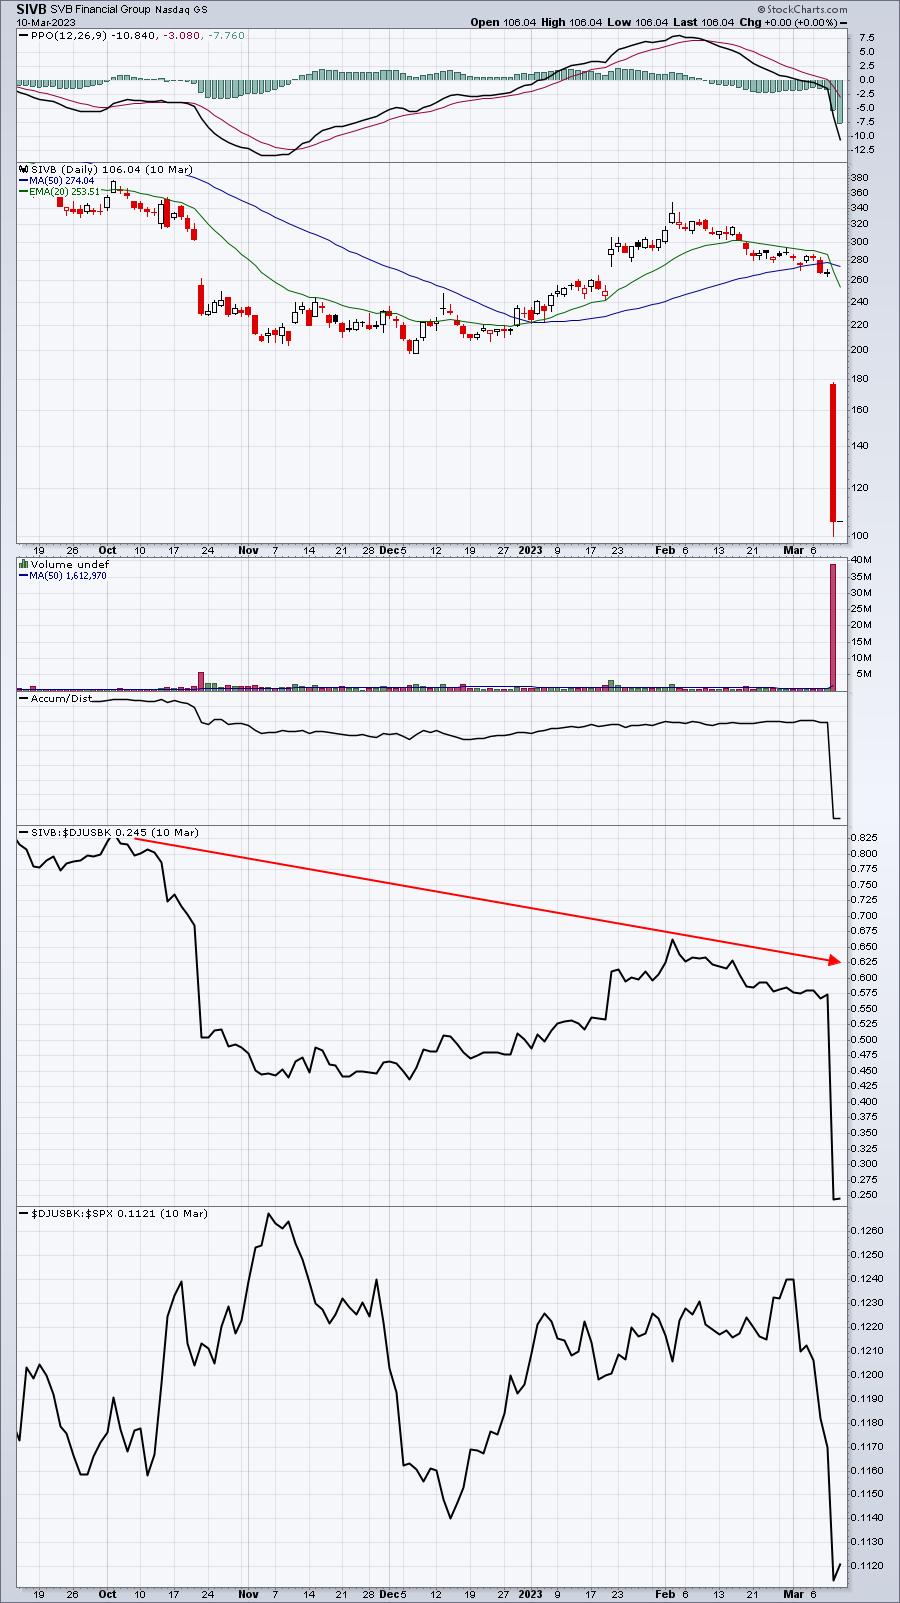
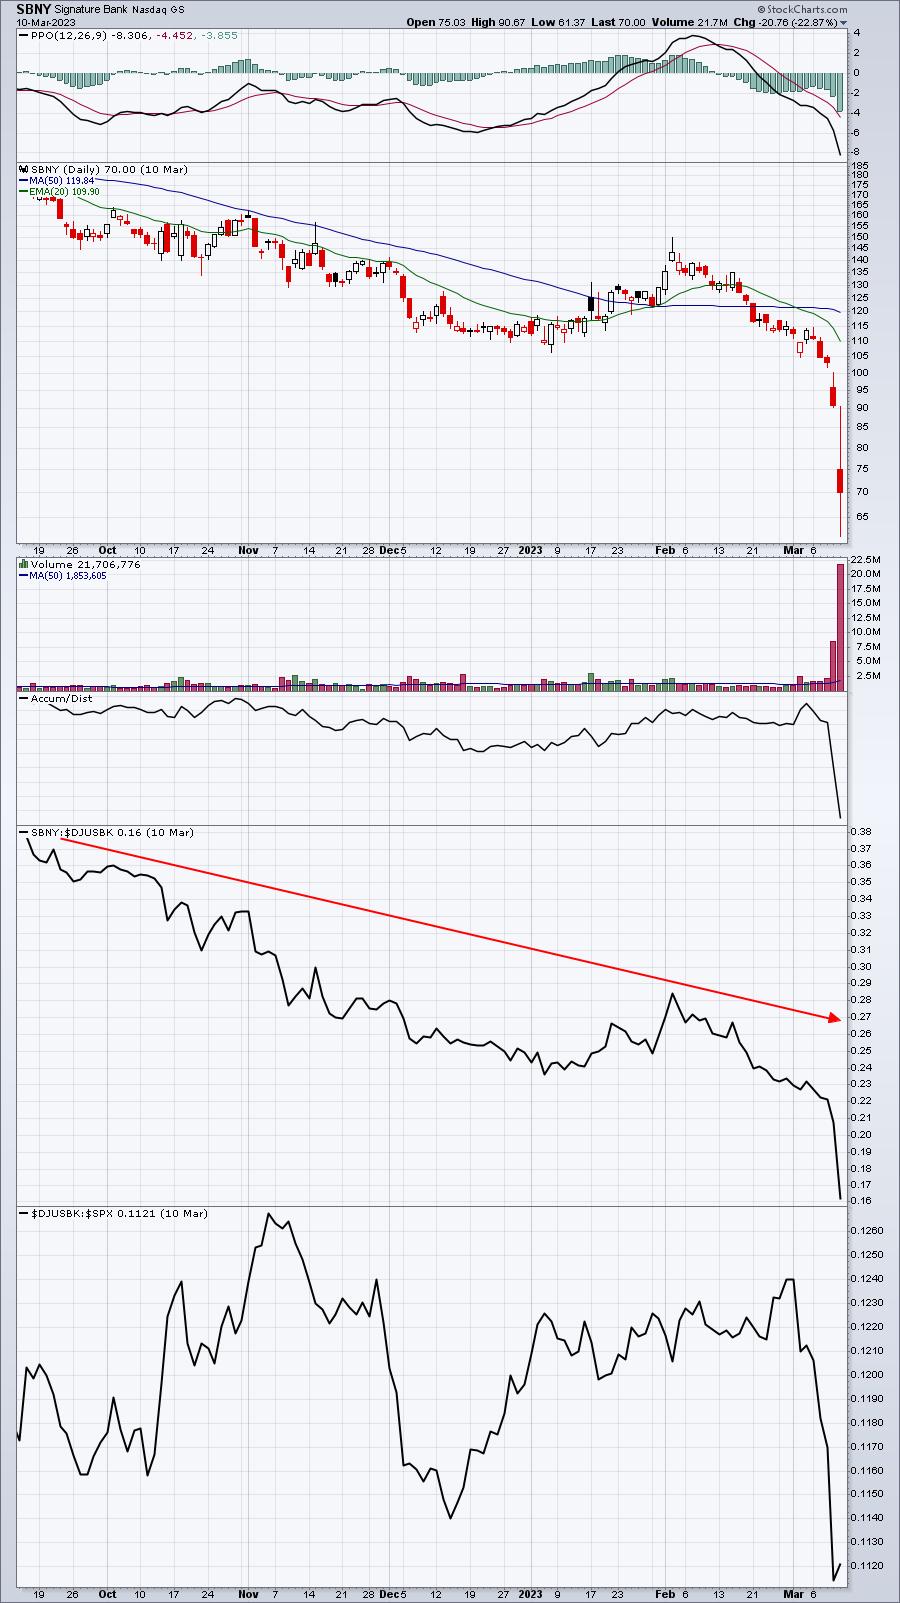
It's all clear as mud, right? I wish I knew for certain where we were heading. The one thing this banking fiasco underscores, however, is the notion that we need to "stick with leading stocks". The banks that led to this big selloff to the downside were lagging banks within their group. Check out both SI, SIVB, and SBNY below:
SI:
SIVB:
SBNY:
The bank that we have in our Income Portfolio is JP Morgan (JPM). One look at their relative strength and you'll understand why we picked that one:
JPM:
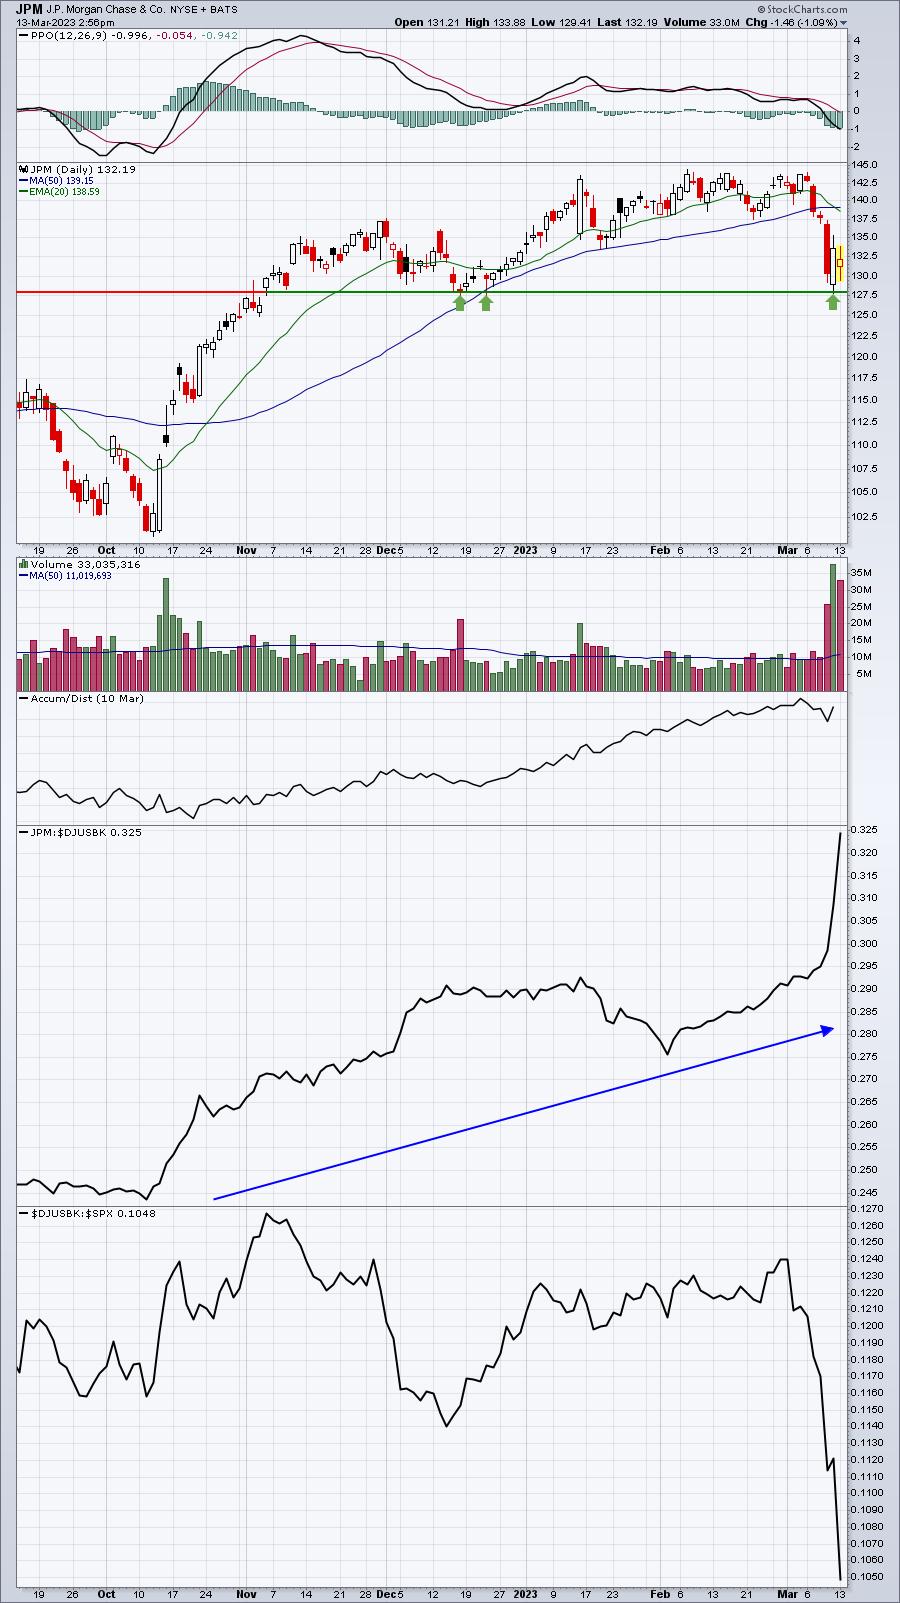
If JPM closes beneath 127.50, then moving to the sidelines probably makes sense, simply to avoid a more panicked selloff, should one occur. For now, however, JPM remains a very strong bank performer and is likely a great trading opportunity on the long side closer to this price support.
Like I said, this is going to be a crazy week. I'll continue to report on what I'm seeing, but if the VIX rises again, just remember that everything turns irrational with a VIX over 30. If there is one chart that truly deserves your attention in coming days and weeks, it's the VIX chart.
Happy trading!
Tom