
EB Daily Market Report - Tuesday, March 14, 2023
ChartLists Updated
I mentioned in Sunday's EB Weekly Portfolio Report that we had updated several ChartLists over the weekend. I meant to post this in the DMR yesterday, but forgot. So here's another reminder that the following ChartLists have been updated through last Friday's close:
- Strong Earnings (SECL)
- Strong Future Earnings (SFECL)
- Raised Guidance (RGCL)
- Bullish Trifecta (BTCL)
Executive Market Summary
- Futures were strong overnight and strengthened further after the February CPI report came in very close to expectations
- All of our major indices gapped higher and have gained upside momentum throughout the morning session
- The Volatility Index ($VIX) has tumbled more than 15% today and is back at 22.50 at last check, well off the 31 high from Monday
- Cryptocurrencies are rallying across the board with bitcoin ($BTCUSD, +6.71%), etherium ($ETHUSD, +5.32%), and litecoin ($LTCUSD, +7.85%) all advancing strongly - see more on BTCUSD below
- Crude oil prices ($WTIC, -2.34%) are falling back to $73 per barrel; energy (XLE, +2.02%), however, ranks as one of the best sectors today
- Communication services (XLC, +2.76%) and technology (XLK, +2.30%) are the two best-performing sectors
- While all 11 sectors are higher, health care (XLV, +0.43%) and consumer staples (XLP, +0.53%) are obvious laggards
- Internet ($DJUSNS, +3.45%) and semiconductors ($DJUSSC, +3.41%) are helping to lead the aggressive sectors higher
- Banks ($DJUSBK, +1.61%) are littering the S&P 500 leaderboard
Market Outlook
I have been tracking the rotation that's taken place in the market between the QQQ and SPY. It makes perfect common sense to me that Wall Street would like to be in more growth-oriented areas of the market prior to a secular bull market advance. I've discussed on many occasions how I believe manipulation is taking place in the stock market currently and has been taking place since May 2022. While the S&P 500 seemingly cannot sustain any move higher, I'd like to point out that with all the bad inflation, higher interest rates, potential recession, hawkish Fed, and now banking uncertainty, the S&P 500 is almost squarely where it was in May 2022. During these last 10 months, money has been rotating into more aggressive areas of the stock market. You can't see it on the surface of the market. But I've been tracking the intraday rotation on a daily basis. You might be shocked to realize that the shift from the SPY to the QQQ hit a 52-week high on Thursday of last week, just as the latest manipulative news story hit The Street. The S&P 500 has been moving lower, but the intraday performance of the QQQ:SPY has been rising beautifully in 2023. I will continue to stick to my theory that Wall Street is manipulating the heck out of retail traders. Check out this chart (please realize that even though the NAME of the chart says SPYQQQ, it's actually the QQQ relative intraday performance vs. the SPY that's being tracked):
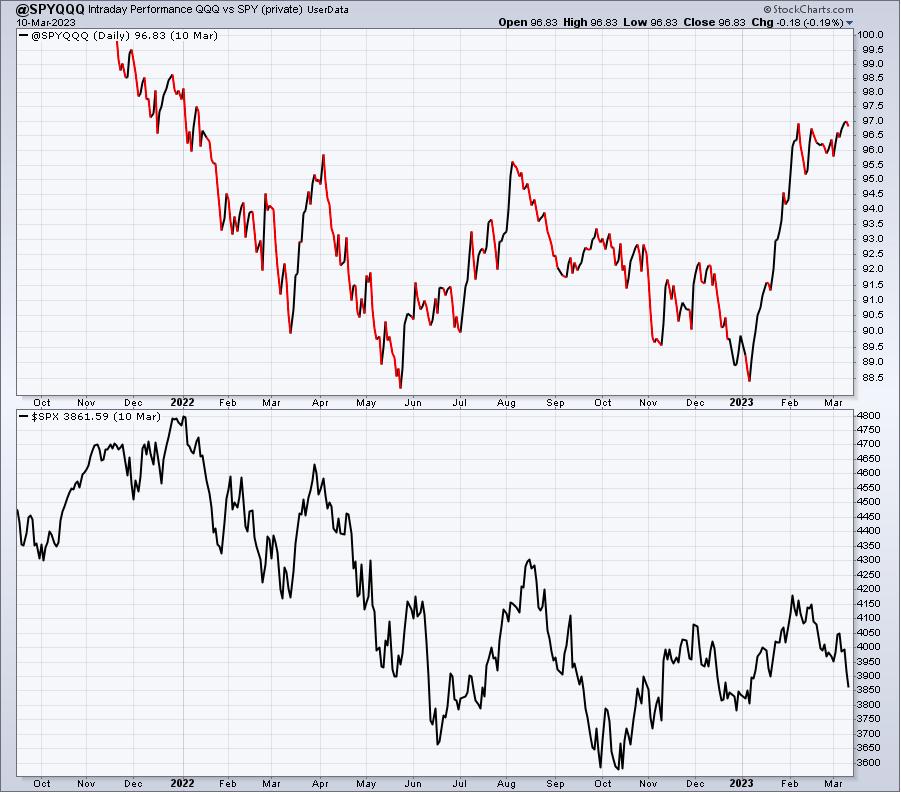
This chart IGNORES gap ups and gap downs. So, in my opinion, it eliminates the manipulation and clearly illustrates the rotation that's been taking place throughout the trading day. Note at the beginning of the chart, in November and December 2021, this intraday rotation was moving AWAY from the QQQ and INTO the SPY (safety) prior to the 2022 cyclical bear market. Now the opposite is occurring. Money is rotating AWAY from the SPY and INTO the QQQ (aggressive) as the S&P 500 moves lower. Manipulation at its finest, if you ask me.
You can agree with me or completely disagree with me and that's fine. I'm not trying to convince anyone. I'm doing what we do at EarningsBeats.com - providing research, guidance, and education. You can use this information in your personal investing decisions, or not. I can tell you that I absolutely use it in mine.
Sector/Industry Focus
Bitcoin ($BTCUSD) is breaking out to its highest level since June 2022. It certainly appears to be a very bullish breakout of a bottoming reverse head & shoulders pattern. Check this out:
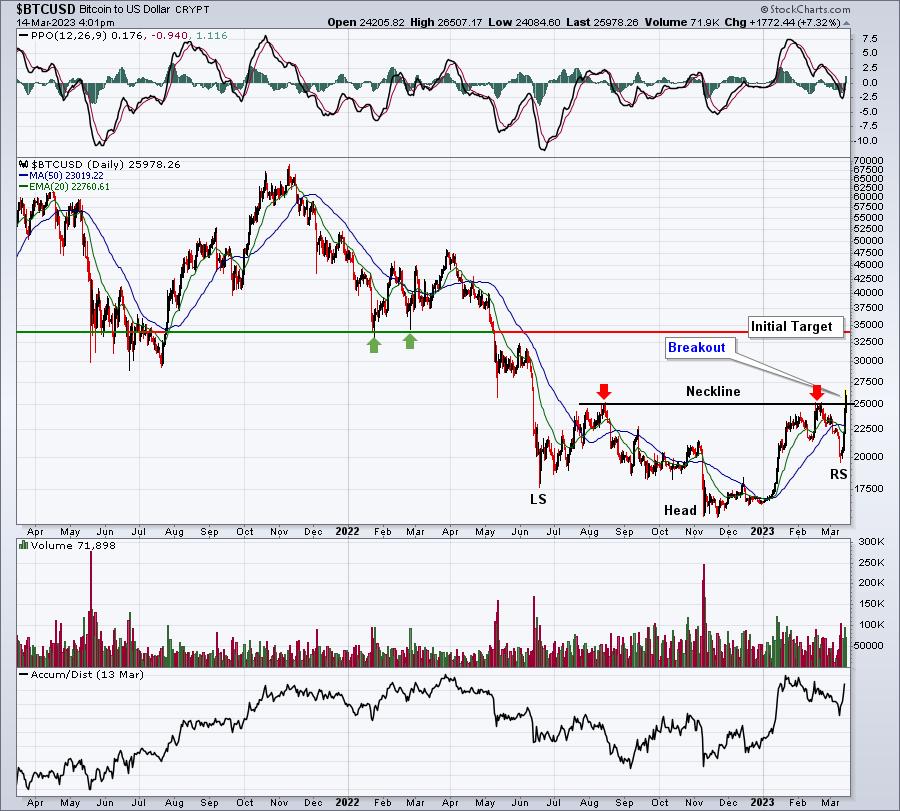
The measurement of this pattern is based on the depth of the reverse head & shoulders pattern. By taking the low at the head and subtracting it from the neckline price, I get an approximate measurement of 9,000, making the initial target somewhere in the 34,000-35,000 range. I expect bitcoin to get there.
ChartLists/Strategies
We've seen a steady decline in equity prices over the past week or so and today we're seeing a nice rebound. It's on days like these that I like to run our "Downtrend Reversal" scan to uncover high quality stocks (high SCTRs) that are potentially reversing. Here is the scan syntax used:
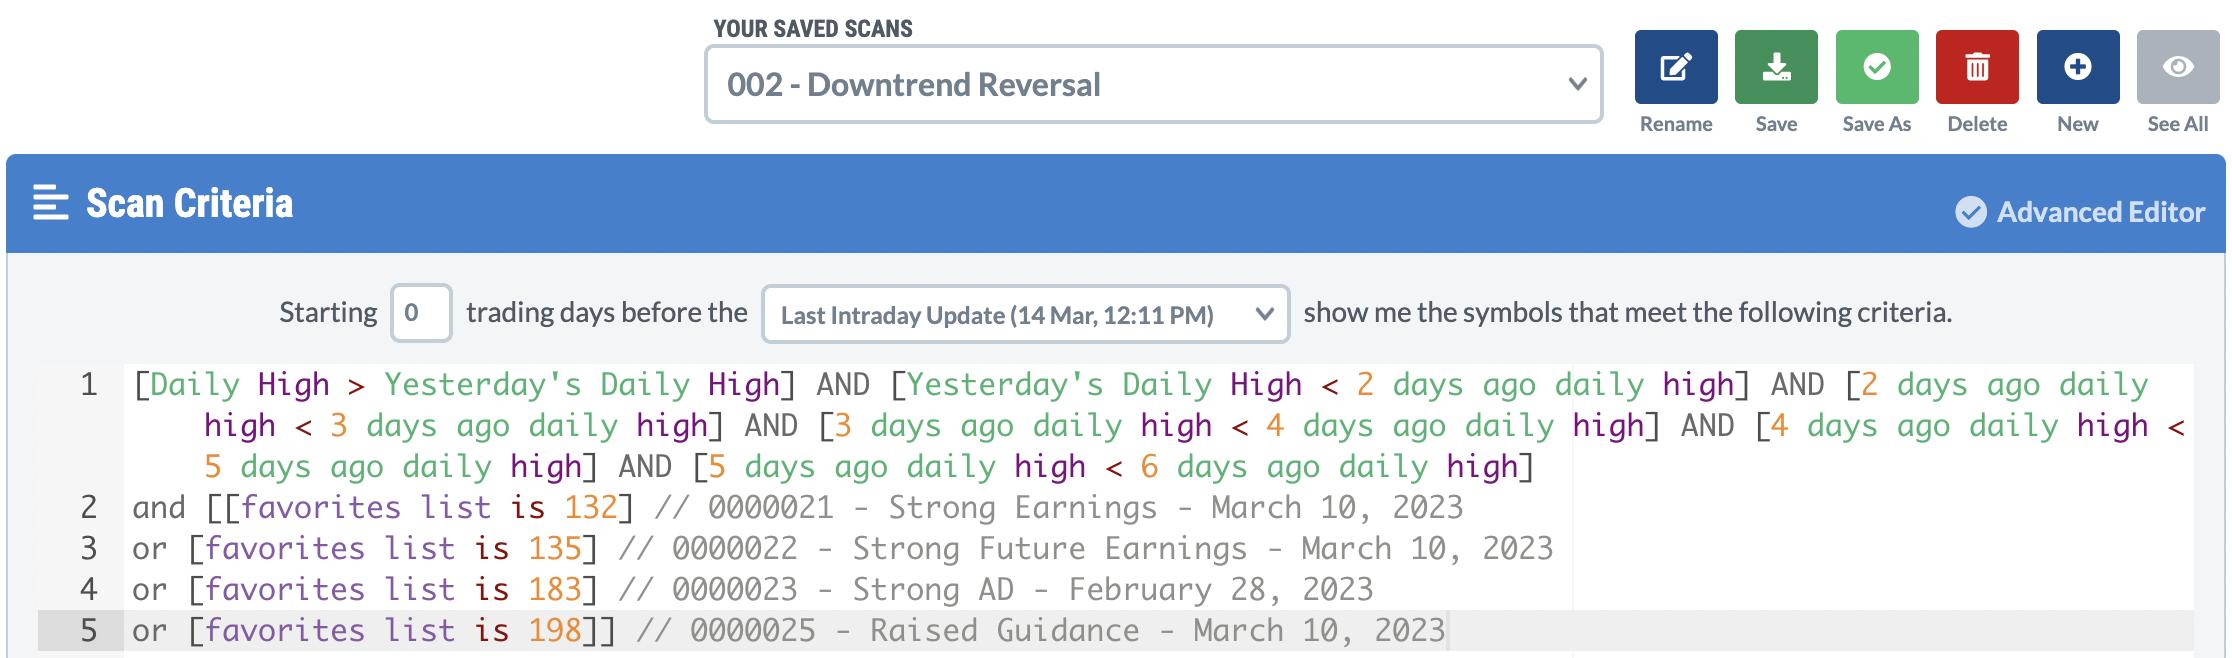
There were 232 stocks returned, so I ranked them in SCTR order and here were the top 10 stocks based on SCTR scores:
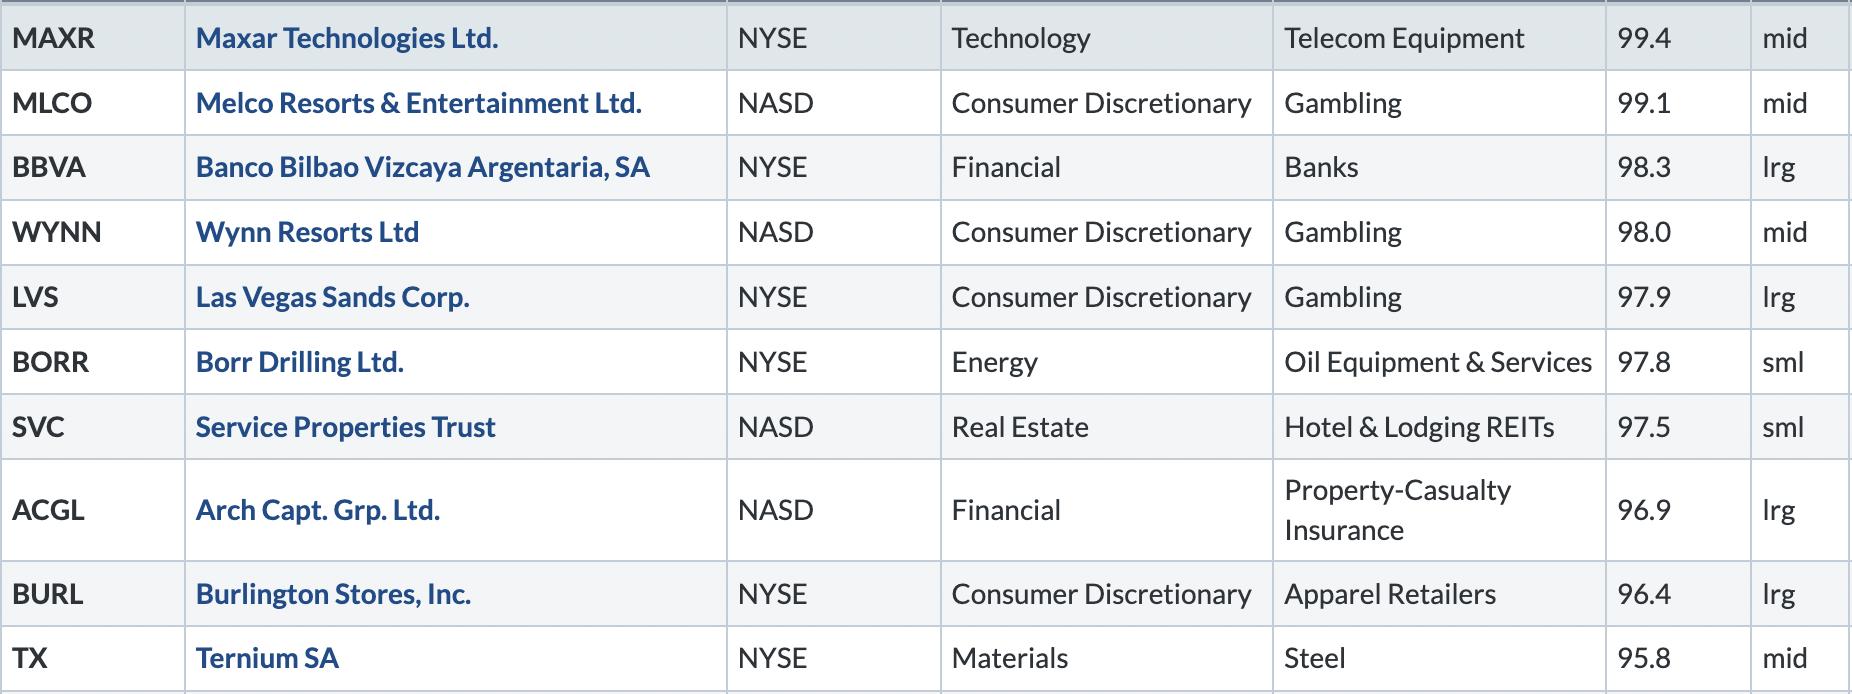
Here are 3 from this list that look very interesting to me:
MLCO:
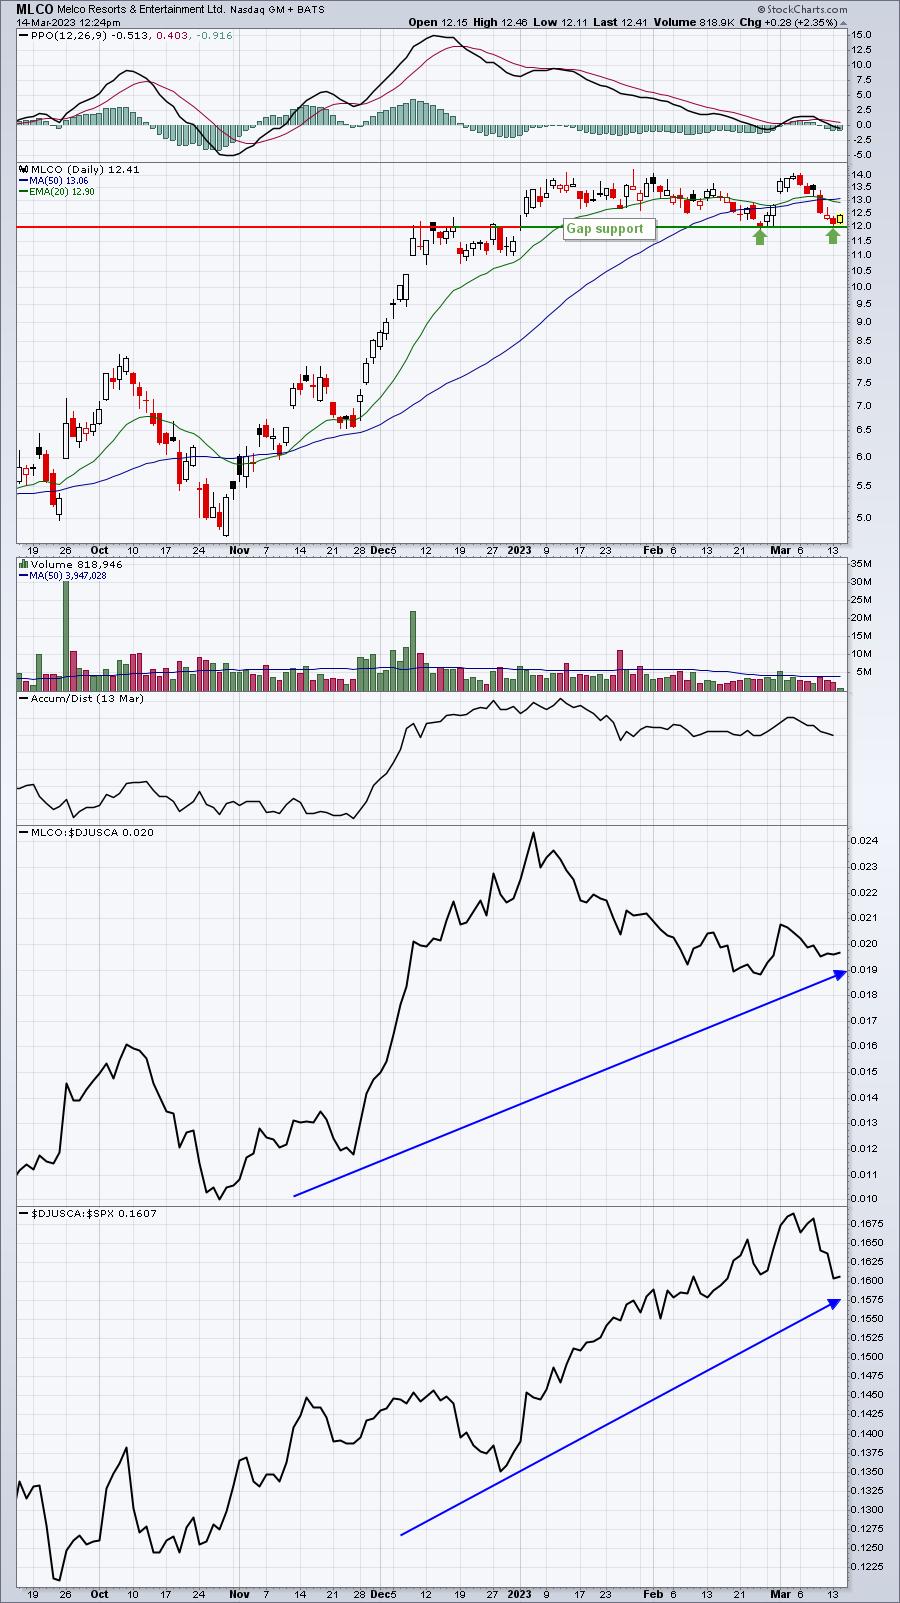
12.00 is a solid price and gap support level. If it's violated, I'd be more cautious, but otherwise, it makes sense to accumulate down in this price neighborhood.
SVC:
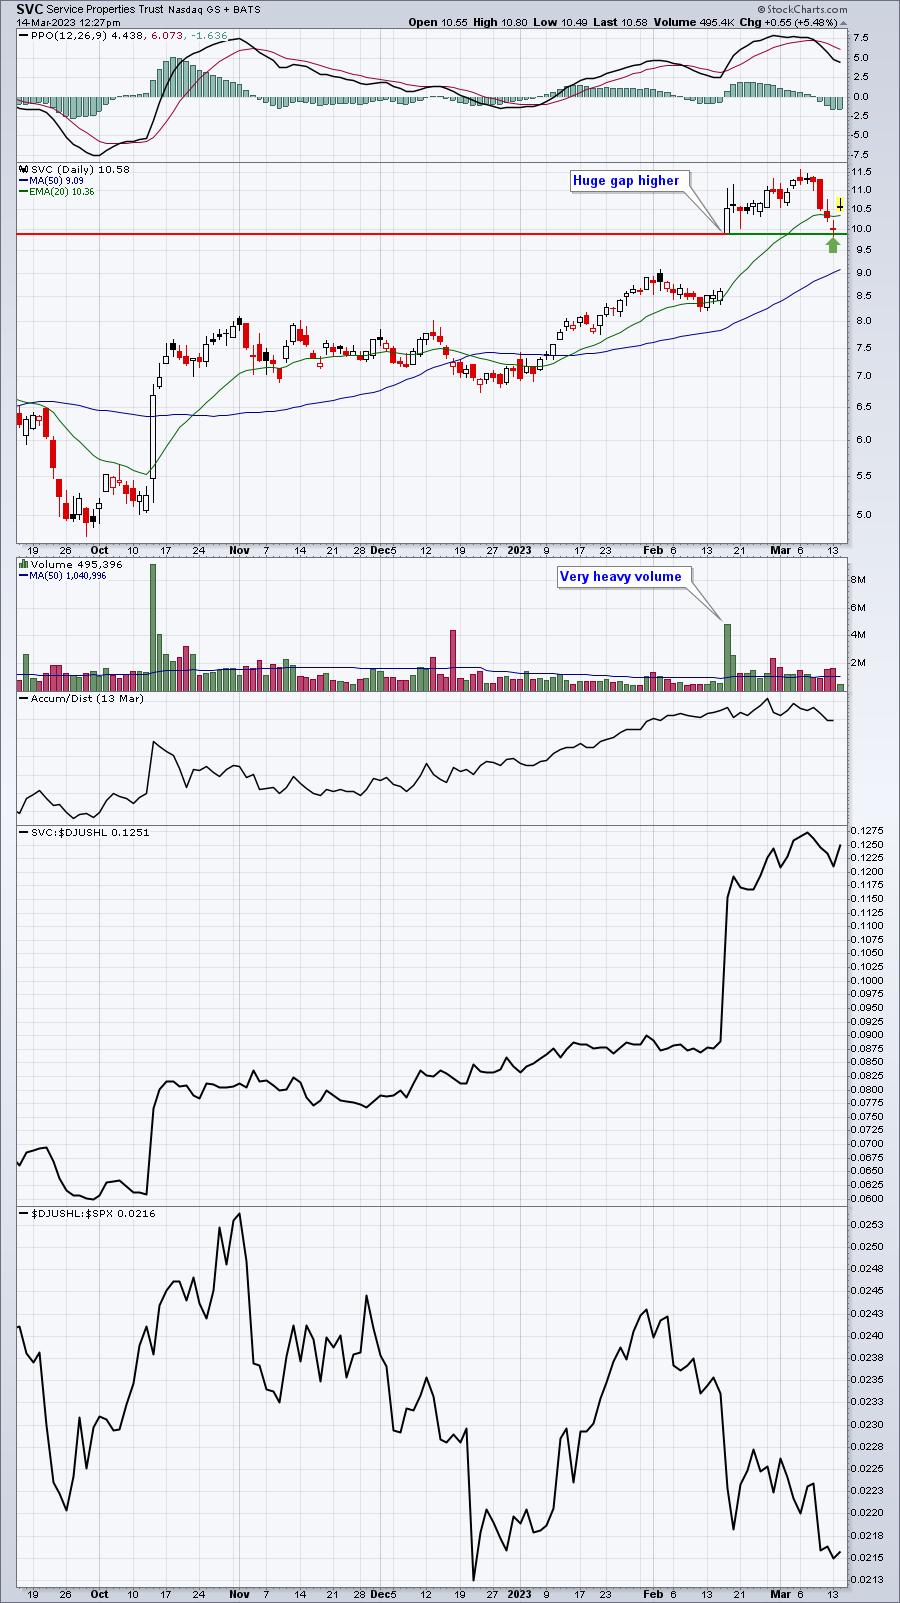
SVC has already seen a big move today, but I wanted to point this chart out, because I LOVE trading stocks that hit earnings-related gap support after a heavy volume gap up and move higher. It's a high reward to low risk kind of trade, which is what successful traders strive for.
ACGL:
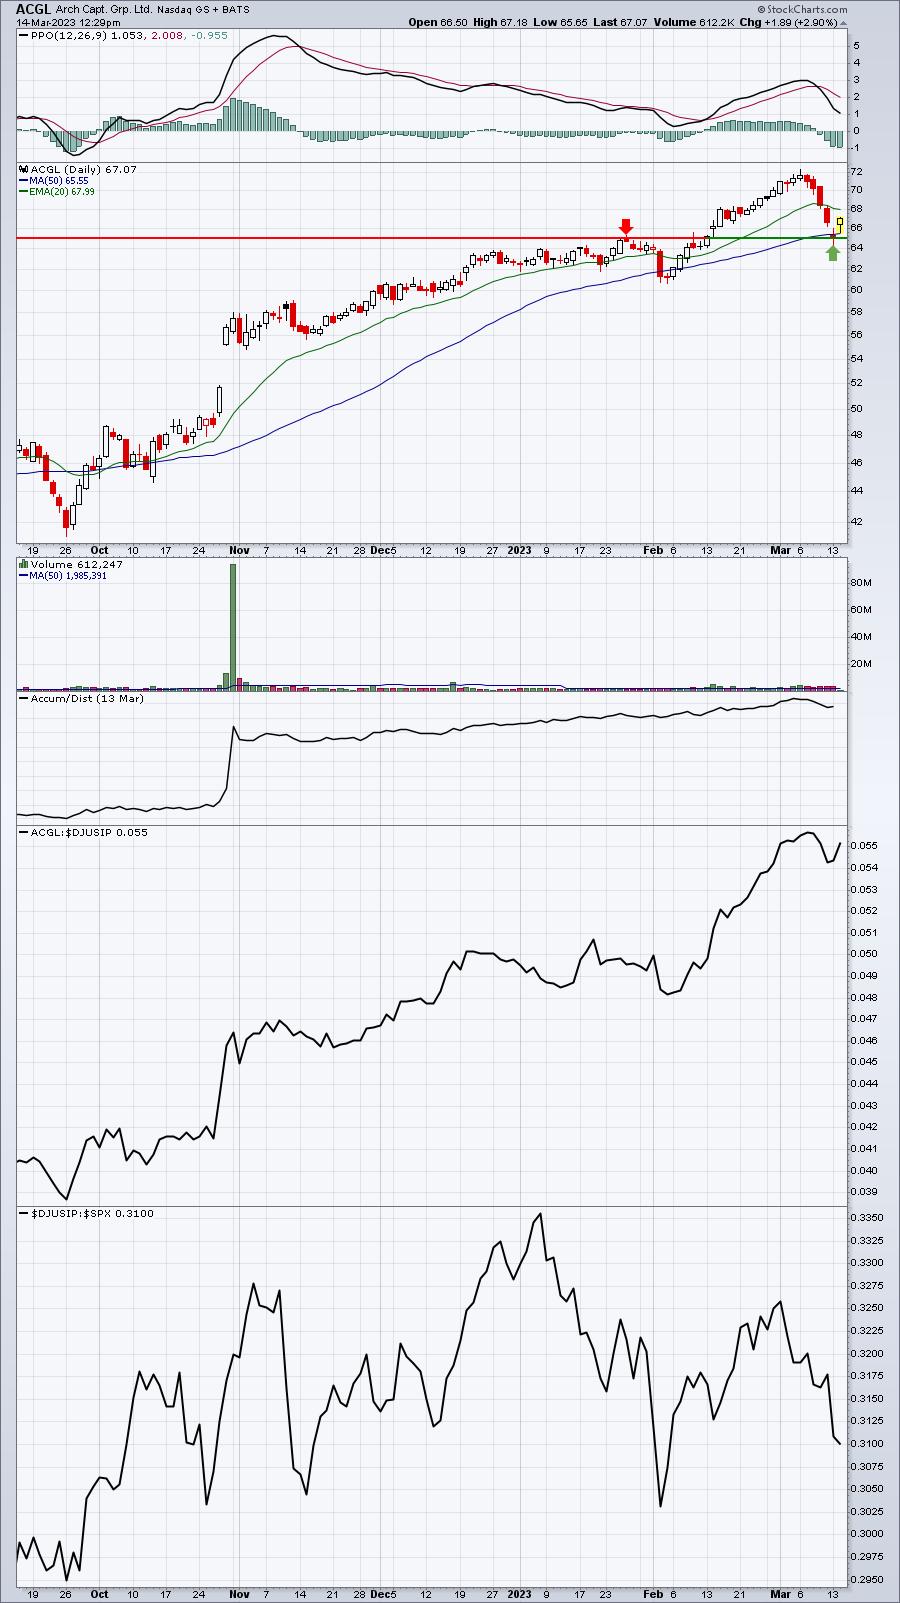
This is a perfect illustration of TA 101 - broken price resistance becomes price support. It also turned beautifully off of its 50-day SMA test.
Earnings Reports
Here are the key earnings reports for the next two days, featuring stocks with market caps of more than $10 billion. I also include several companies with market caps below $10 billion. Finally, any portfolio stocks that will be reporting results are highlighted in BOLD. If you decide to hold a stock into earnings, please understand the significant short-term risk that you are taking. Please be sure to check for earnings dates for any companies you own or are considering owning.
Tuesday, March 14:
LEN, SMAR, S, CVT, MANU, STNE, GES
Wednesday, March 15:
ADBE, FNV, ZTO, FIVE, PATH, ARRY, PD, CPRX, OTLY
Economic Reports
February CPI: +0.4% (actual) vs. +0.4% (estimate)
February Core CPI: +0.5% (actual) vs. +0.4% (estimate)
Happy trading!
Tom