
EB Daily Market Report - Thursday, March 16, 2023
Executive Market Summary
- Futures were lower heading into the open for the third time in four days this week
- Just like the other two, buyers stepped up and we're seeing another serious market rally - especially on the more-aggressive NASDAQ 100 index
- Commodities are mixed today, though crude oil ($WTIC, +0.98%) is rebounding slightly and is back above $68 per barrel
- The 10-year treasury yield ($TNX) is up 9 basis points, but it was down to 3.37% earlier to test yield support from December, January, and February
- Home construction ($DJUSHB, +2.63%) is having a very solid day after February housing starts and building permits came in well ahead of expectations
- Semiconductors ($DJUSSC, +3.49%), a bull market bellwether, are breaking out above 10-month resistance
- Technology (XLK, +2.63%) is soaring and easily today's best-performing sector
- Consumer discretionary (XLY, +1.87%) and communication services (XLC, +1.86%) are also among the 3 aggressive sectors and are enjoying an excellent session
- The only sector lower today is real estate (XLRE, -0.16%), a defensive sector; consumer staples (XLP) is flat
- Adobe Systems (ADBE, +6.20%) is having an outstanding day after reporting better-than-expected quarterly earnings results
- Advanced Micro Devices (AMD, +6.88%) is also having a strong day, leading the semis higher
Market Outlook
One of my favorite sentiment indicators is the 5-day SMA of the equity-only put-call ratio ($CPCE). It provides us a visual of when sentiment has grown too bearish in the very near-term. Historically, the odds of a stock market rally increases significantly with this 5-day SMA reaches .75, and especially .80. Just prior to this current rally, this 5-day SMA hit .846, a very high reading that suggests extreme pessimism. Check this out:
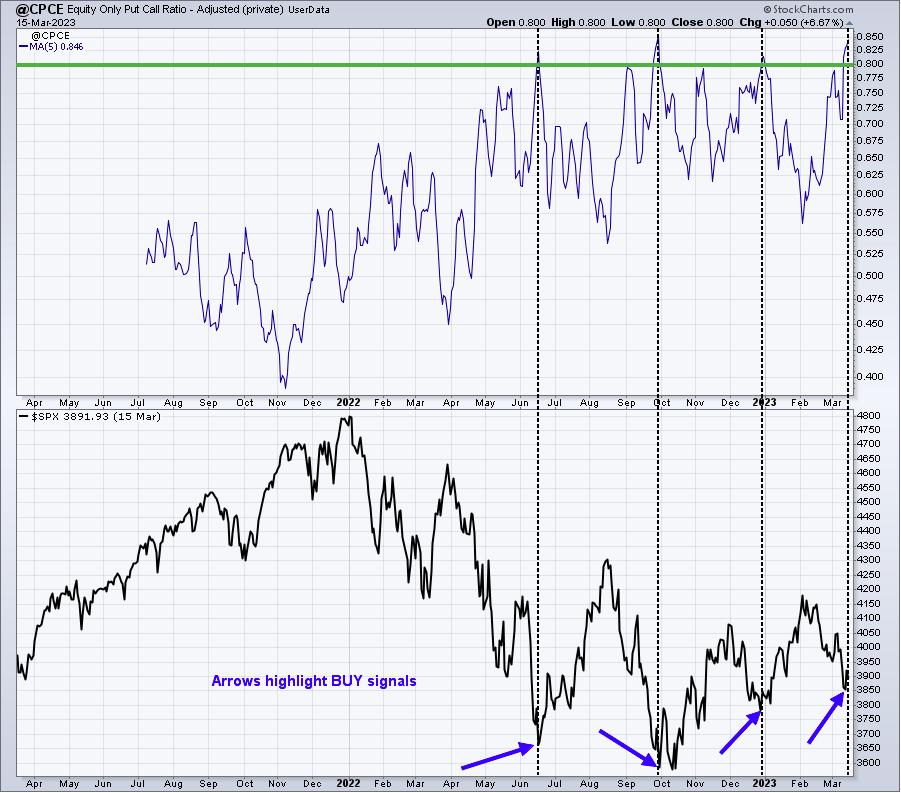
The green horizontal line marks that key .80 level. We've seen 4 recent moves above that level and the last 3 have worked beautifully. It appears this 4th extreme reading is aiding another S&P 500 rally as well.
Remember that I'm now tracking the 5-day SMA of the CPCE using a User-Defined Index at StockCharts.com. I had to adjust several CPCE daily readings back in November and December as this ratio included an unprecedented number of equity puts being traded by institutions. I could tell which days needed to be adjusted based on the MASSIVE increase of equity puts traded on those days during the lunch hour (mostly from 12pm ET to 1pm ET). The purpose of the 5-day SMA is to gauge the psyche of the retail trader. Including these hundreds of thousands of equity puts by institutions was skewing these numbers by a very wide margin. Prior to November, the highest CPCE reading ever was 1.35 back in 2008 during the financial crisis. In November/December 2022, we were seeing CPCE readings WELL ABOVE 1.35, including one reading of 2.40 in late December. It was worthless information. I believe the adjusted CPCEs reflected on the above chart are much more useful for our purposes of trying to catch short-term market bottoms.
Sector/Industry Focus
We saw a very solid housing starts and building permits report for February - well ahead of consensus estimates. That, combined with a big recent drop in the 10-year treasury yield ($TNX), is helping the home construction group ($DJUSHB) lead the market higher today:
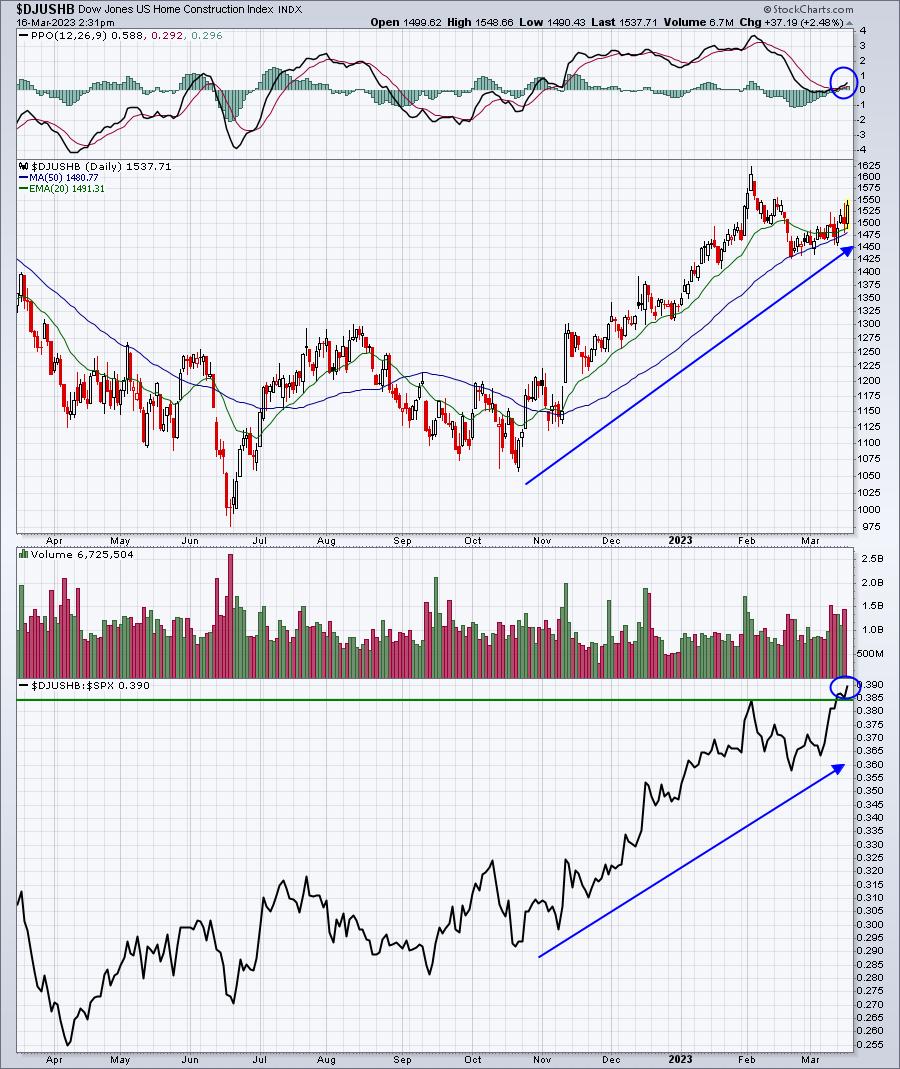
Home construction has broken out to yet another 52-week relative high as its leadership currently is rather clear.
ChartLists/Strategies
Here are a couple of very interesting trading candidates:
ATKR (on several of our ChartLists):
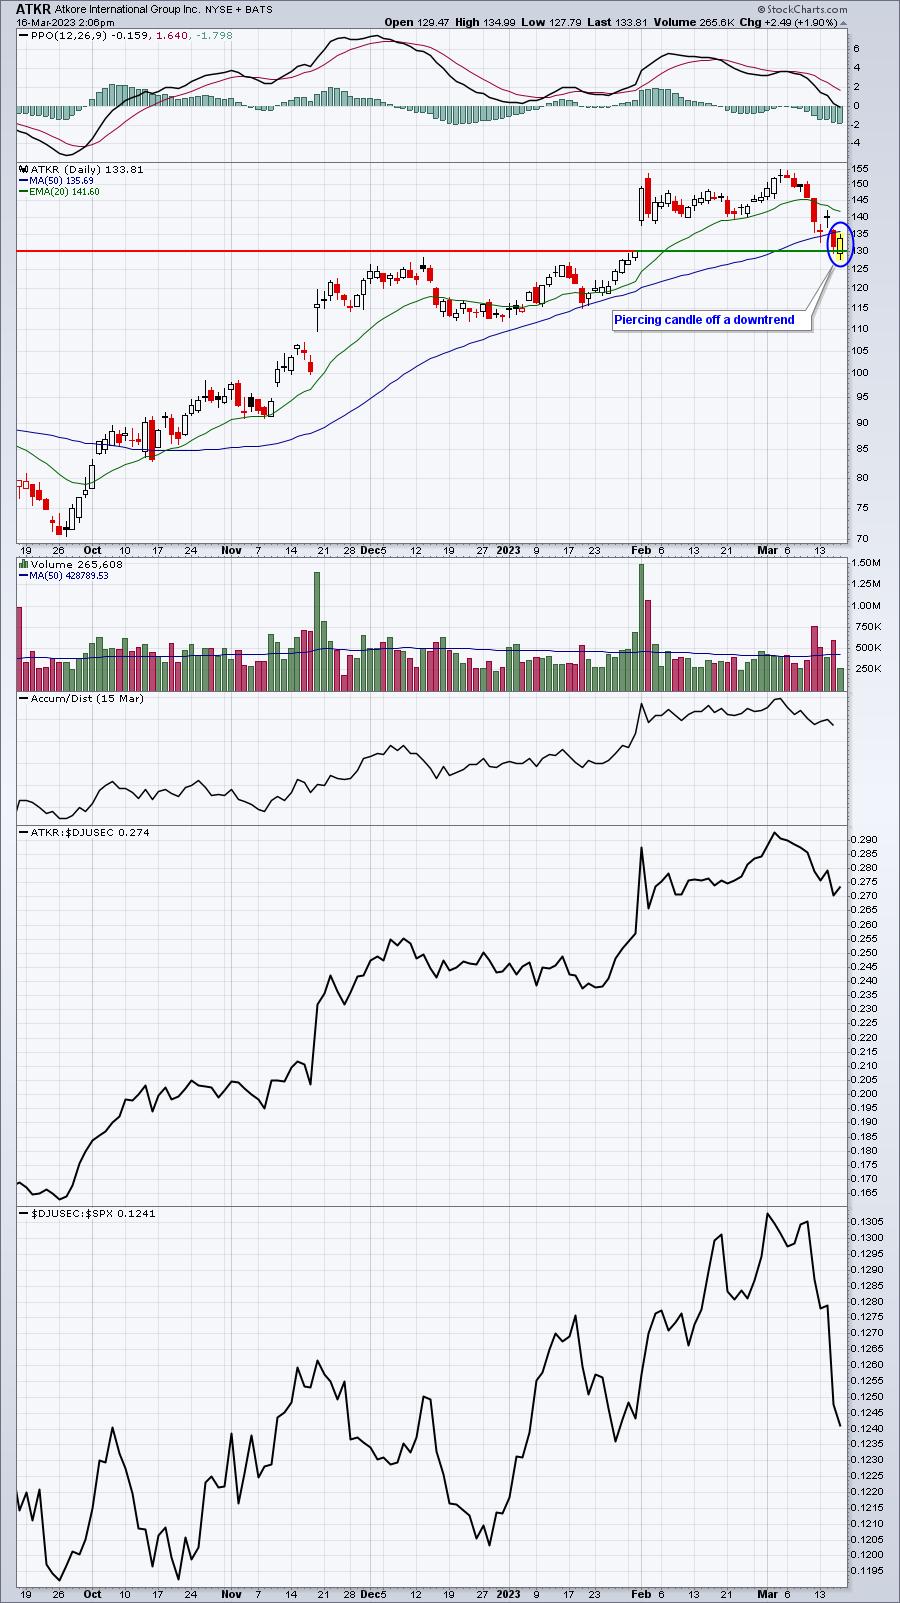
I love the reversing piercing candle at gap support. While this certainly doesn't guarantee a winning trade, I do really like the solid reward-to-risk trade from a bullish perspective.
JPM (on our SECL and SADCL; also in our Income Portfolio):
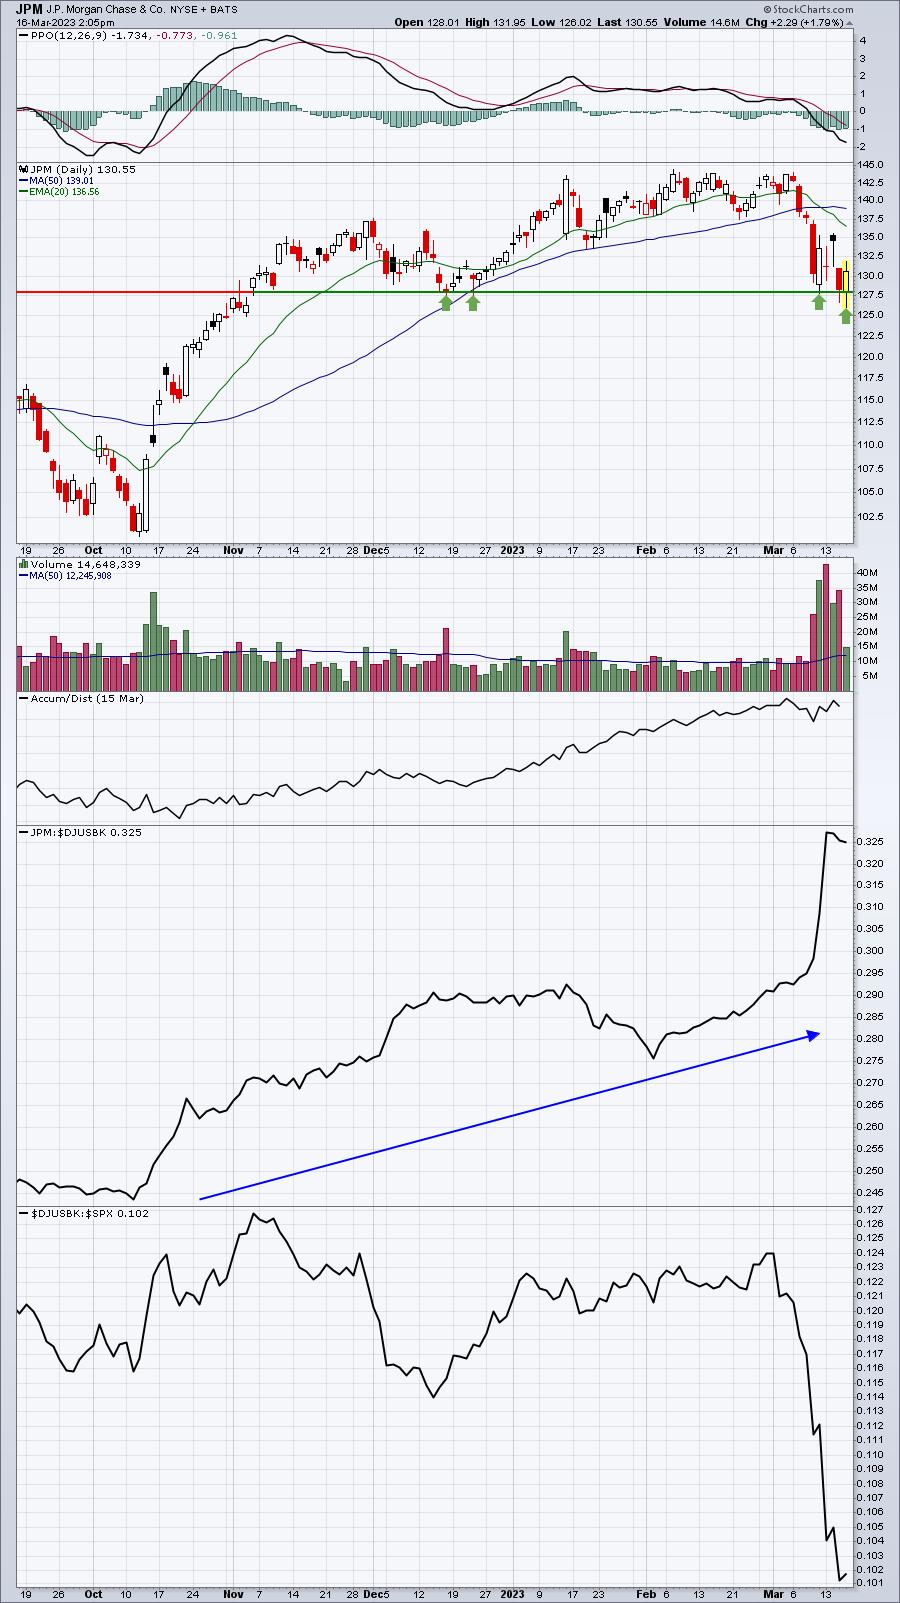
This is another reversing piercing candle that's occurring exactly at key price support. The solid reward-to-risk entry here is rather obvious. Again, no guarantee of a winning trade, but the setup is nice.
Earnings Reports
Here are the key earnings reports for the next two days, featuring stocks with market caps of more than $10 billion. I also include several companies with market caps below $10 billion. Finally, any portfolio stocks that will be reporting results are highlighted in BOLD. If you decide to hold a stock into earnings, please understand the significant short-term risk that you are taking. Please be sure to check for earnings dates for any companies you own or are considering owning.
Thursday, March 16:
FDX, DG, BEKE, JBL, WSM, ASO, SIG, MOMO
Friday, March 17:
WDH, XPEV, BLDP
Economic Reports
Initial jobless claims: 192,000 (actual) vs. 205,000 (estimate)
February housing starts: 1,450,000 (actual) vs. 1,315,000 (estimate)
February building permits: 1,524,000 (actual) vs. 1,340,000 (estimate)
Happy trading!
Tom