
EB Daily Market Report - Friday, March 17, 2023
Executive Market Summary
- Futures were lower on Friday across our major indices, though the NASDAQ is once again claiming a leadership role
- Crude oil ($WTIC, -2.25%) is setting fresh new lows as crude prices have tumbled beneath $67 per barrel
- The 10-year treasury yield ($TNX) is down 16 basis points to 3.43%, again threatening key yield support from 3.37%-3.40%; today's low was 3.38%
- Cryptocurrencies are performing very well, especially bitcoin ($BTCUSD, +6.24%)
- Technology (XLK, +0.19%) is the only sector in positive territory as rotation to growth remains in play
- Financials (XLF, -3.00%) are very weak again, caused primarily by banks ($DJUSBK, -4.55%) and life insurance ($DJUSIL, -4.55%)
- FedEx Corp (FDX, +8.24%) is the top-performing S&P 500 stock after reporting better-than-expected quarterly results
- Meanwhile, First Republic Bank of San Francisco (FRC, -25.97%) is easily the worst performer on the S&P 500, despite $30 billion of deposit pledges from other banks to provide liquidity
Market Outlook
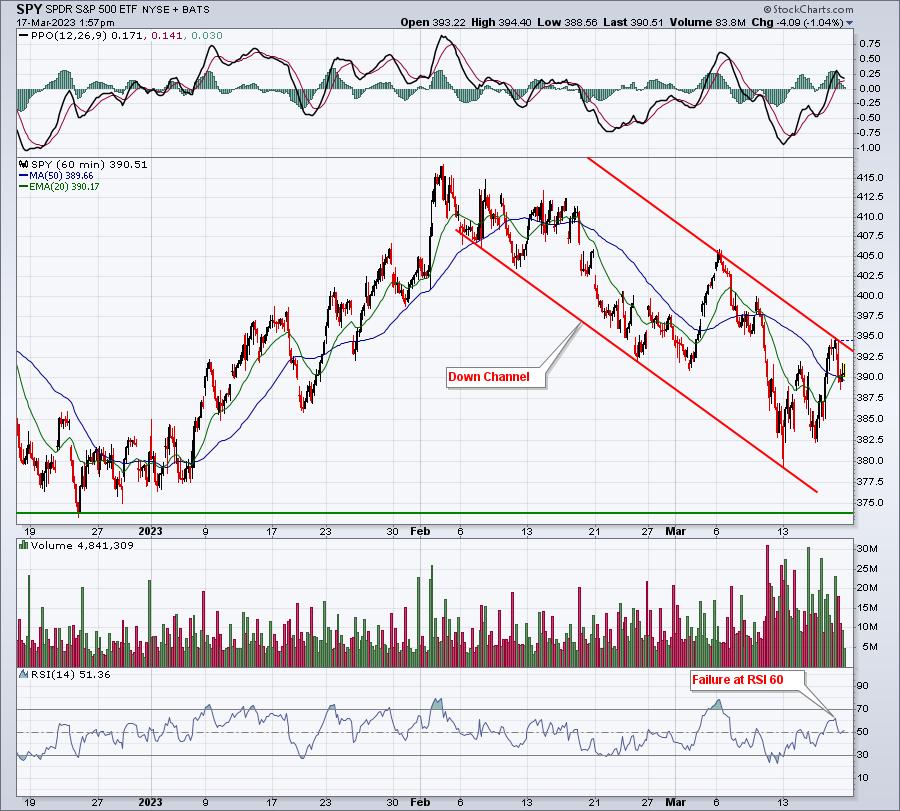
Let's take a look first at the latest 60-minute charts on the SPY and QQQ:
SPY:
QQQ:
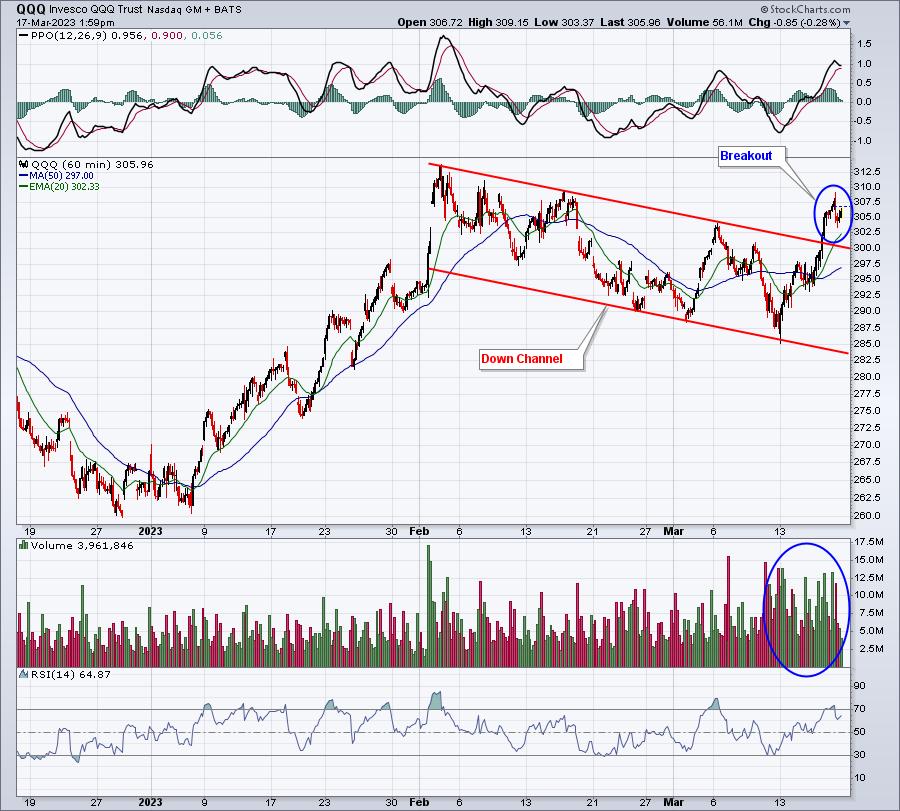
These 2 ETFs tracking 2 of our key indices are certainly trending in different directions. In a secular bull market, we should be seeing ALL indices moving higher, so short-term questions do remain. But if we're going to see rotation, I definitely want to see money moving into growth-oriented areas and the strength on the QQQ chart above illustrates that market participants are becoming much more risk on, a bullish signal. The volume pouring into the QQQ also suggests plenty of interest in this area of the market as well.
Historically, the most bullish time in March is passing at today's close. The next two weeks are much more neutral, though I can provide you a breakdown of this period as follows:
- March 19-22: -22.82%
- March 23-31: +9.94%
Nothing to write home about here, but the early part of next week could be the most challenging, at least if history repeats itself. The above percentages, by the way, are the annualized returns of the S&P 500 since 1950. History isn't a guarantee, but it does give us another clue.
One more pullback could do the trick as we head quickly towards April and our next earnings season.
Sector/Industry Focus
If I told you that Apple's (AAPL) revenues would decline and their production costs would increase for the foreseeable future, what would you do with AAPL stock? Probably sell, right? Well, what's happening in banks ($DJUSBK) is quite similar. Falling long-term 10-year treasury yields ($TNX) cuts into revenues, while a hawkish Fed raising the fed funds rate is costing banks more money. It's the perfect storm for banks. Throw in some panic and indiscriminate selling and the result is a poorly-performing industry group. If the Fed decides to back off from raising rates next week or provides a clear timetable for doing so, we'll likely see a relief rally for this beaten-down group. Here's a long-term 15-year weekly chart of the DJUSBK:
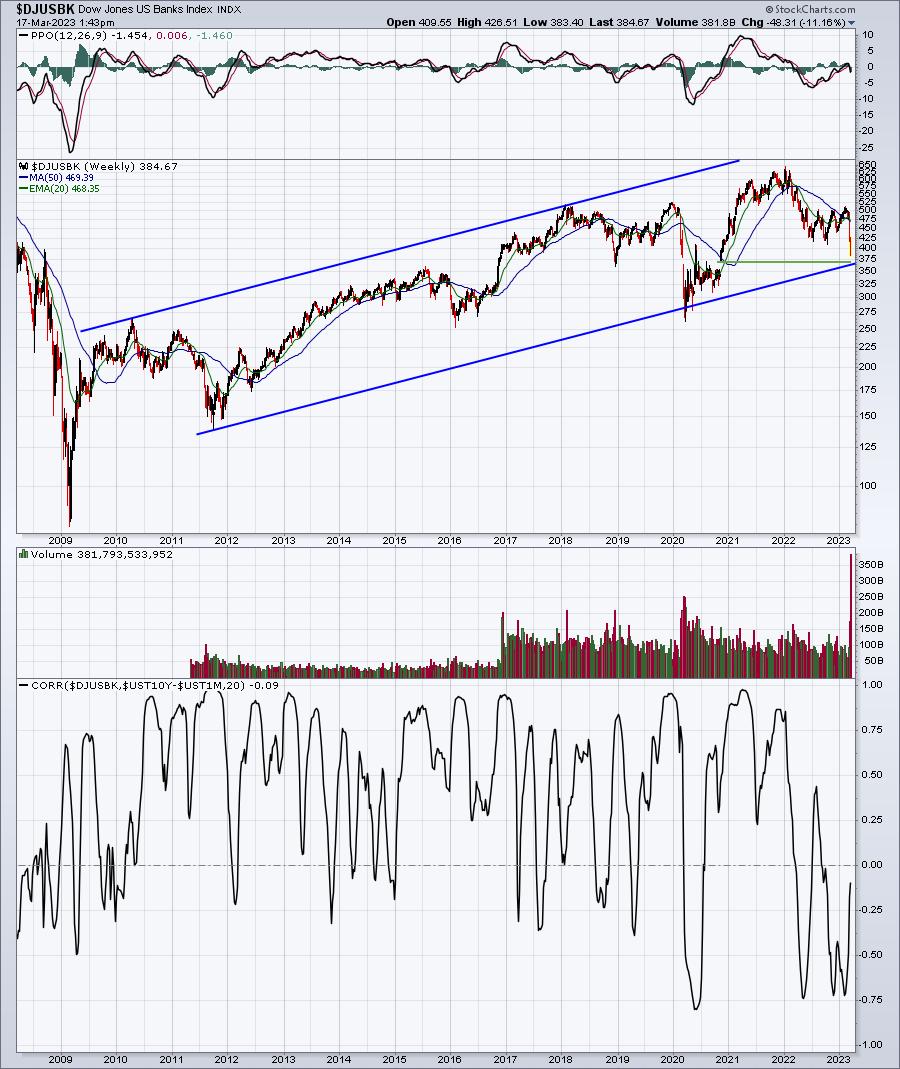
The bottom panel is the correlation coefficient of banks vs. the treasury yield spread (10-year vs. 1-month). It shows a fairly tight positive divergence over the years. So, it makes sense that the short-term performance of banks will likely be tied to what happens at next week's Fed meeting. If the Fed stands pat, I'd expect to see a big relief rally. If the Fed continues to raise, it would be very bad news for banks and could trigger one more selling episode prior to April.
ChartLists/Strategies
Two of the biggest influencers of the S&P 500 and NASDAQ 100 are Apple (AAPL) and Microsoft (MSFT). The latter made an intermediate-term breakout yesterday, while the former is literally sitting on the verge of a very significant breakout. Which direction our major indices move from here could be a simple as following AAPL and MSFT for clues:
AAPL:
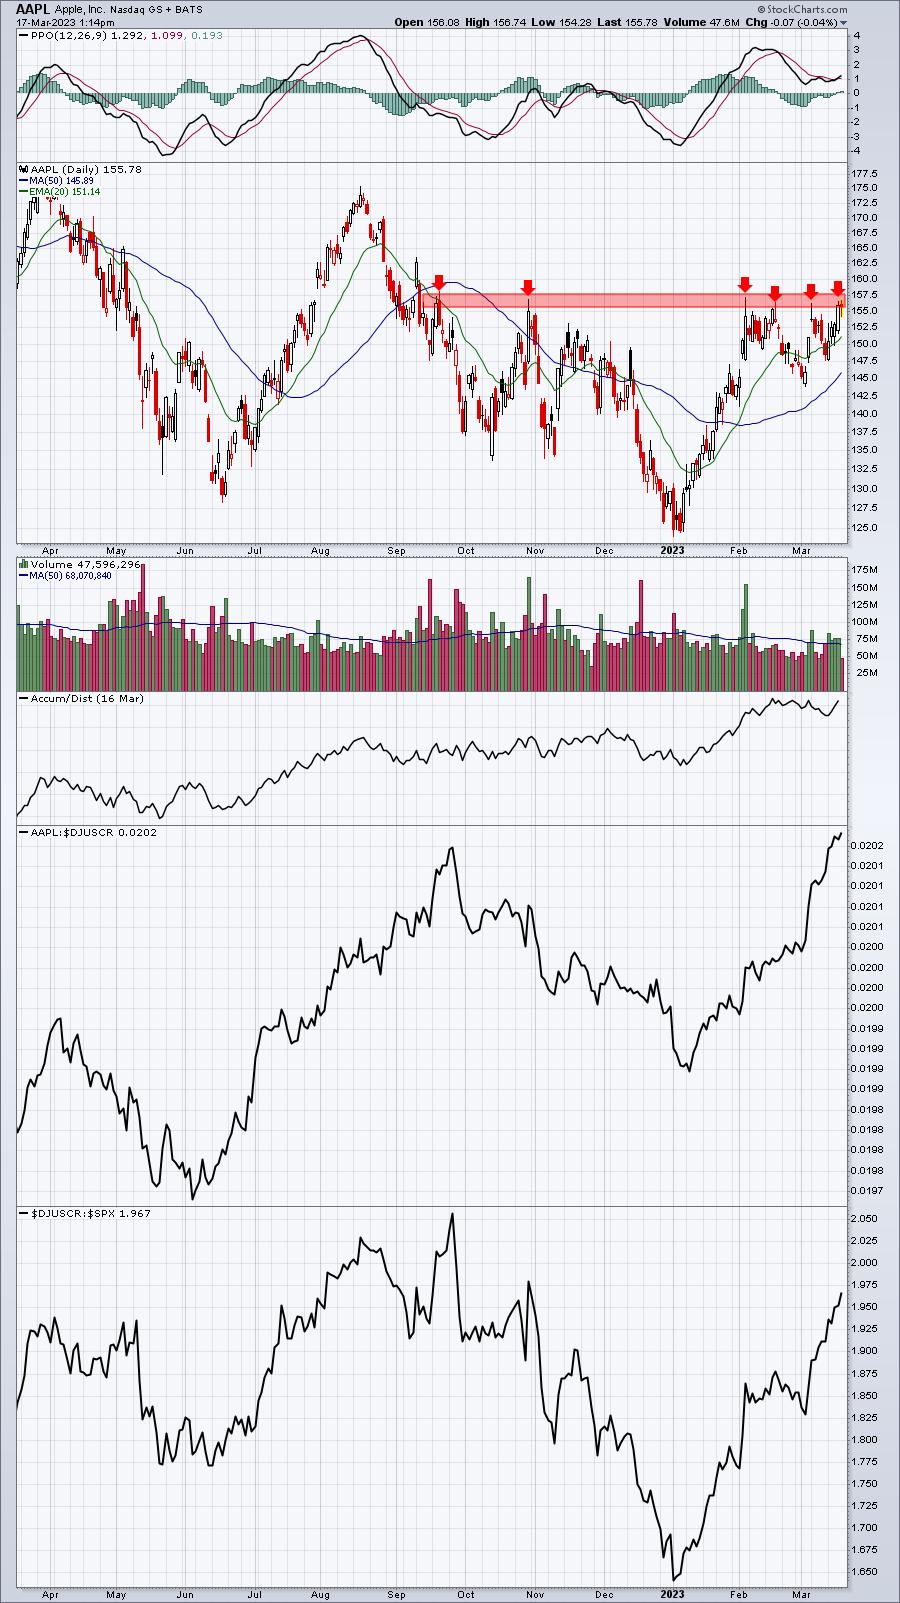
By my count, this is the 6th trip for AAPL since September into its current price resistance range from 155-158, without a single close above 158. Seeing such a close would no doubt add to the current bullishness in growth stocks. Relative strength is exploding for AAPL, as it's just recently hit a new 52-week relative high vs. its peers. The AD line is also threatening yet another breakout. The chart looks good.
MSFT:
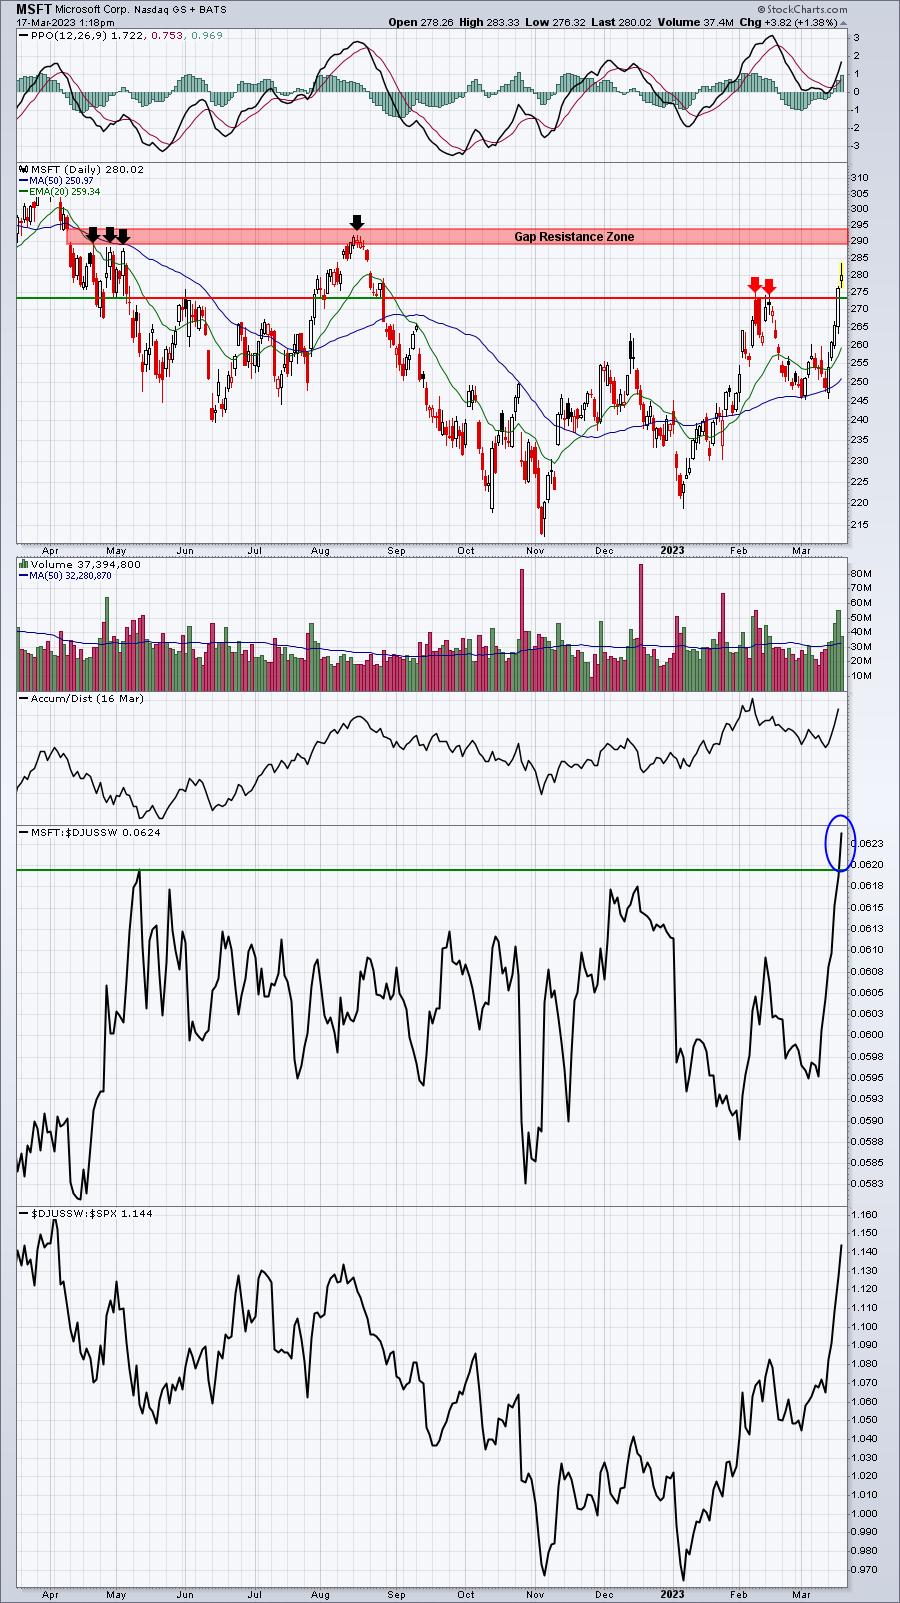
MSFT shows a slightly different picture. First of all, it's setting fresh 52-week relative highs vs. its software peers ($DJUSSW). That's definitely a big plus. Volume has been soaring of late, indicative of significant accumulation during this recent rally. The AD line, nearing another 52-week high, would confirm this notion.
Earnings Reports
Here are the key earnings reports for the next two days, featuring stocks with market caps of more than $10 billion. I also include several companies with market caps below $10 billion. Finally, any portfolio stocks that will be reporting results are highlighted in BOLD. If you decide to hold a stock into earnings, please understand the significant short-term risk that you are taking. Please be sure to check for earnings dates for any companies you own or are considering owning.
Friday, March 17:
WDH, XPEV, BLDP
Monday, March 20:
FL
Economic Reports
February industrial production: +0.0% (actual) vs. +0.4% (estimate)
February capacity utilization: 78.0% (actual) vs. 78.5% (estimate)
March consumer sentiment: 63.4 (actual) vs. 67.0 (estimate)
February leading indicators: -0.3% (actual) vs. -0.2% (estimate)
Happy trading!
Tom