
EB Daily Market Report - Monday, March 20, 2023
Your Daily 5
I recorded a new Your Daily 5 session for StockCharts today and it aired earlier this afternoon. I addressed several (5) intermarket relationships that point to higher S&P 500 prices ahead. If you'd like to check it out, you can CLICK HERE. Be sure to "like" the video and leave me a comment if you agree or disagree.
Thanks!
Executive Market Summary
- Futures were mixed overnight as rotation began moving back towards value stocks
- After underperforming most of last week, value (IWD, +1.24%) is trumping growth (IWF, +0.33%) - at least for a day!
- Bitcoin ($BTCUSD) rallied hard over the weekend and topped 28000 for the first time since June 2022; it's also showing relative strength vs. etherium ($ETHUSD) and litecoin ($LTCUSD)
- Gold ($GOLD, +0.73%) nears $2000 per ounce and is currently at an 11-month high
- Volatility ($VIX, -4.27%) is down on the session, but was considerably higher earlier
- Banks ($DJUSBK, +0.72%) are at today's session low and well off earlier highs; UBS (UBS, +4.21%) is up after announcing its plan to acquire Credit Suisse (CS, -51.93%) at a significant discount to market
- JP Morgan (JPM, +0.80%) is advising First Republic Bank of San Francisco (FRC, -46.16%) on strategic alternatives, but obviously its options are limited - likely looking for a suitor similar to CS and also likely at a discount
- 10 of 11 sectors are higher today as energy (XLE, +2.16%) leads; crude oil prices ($WTIC, +0.88%) are rebounding
- Technology (XLK, -0.05%) is the sole sector in negative territory as software ($DJUSSW, -1.84%) lags
Market Outlook
After lagging badly last week, rotation this week is favoring the Dow Jones ($INDU). If we pull up a 3-month 60-minute chart, you can see the short-term price resistance that this index must negotiate:
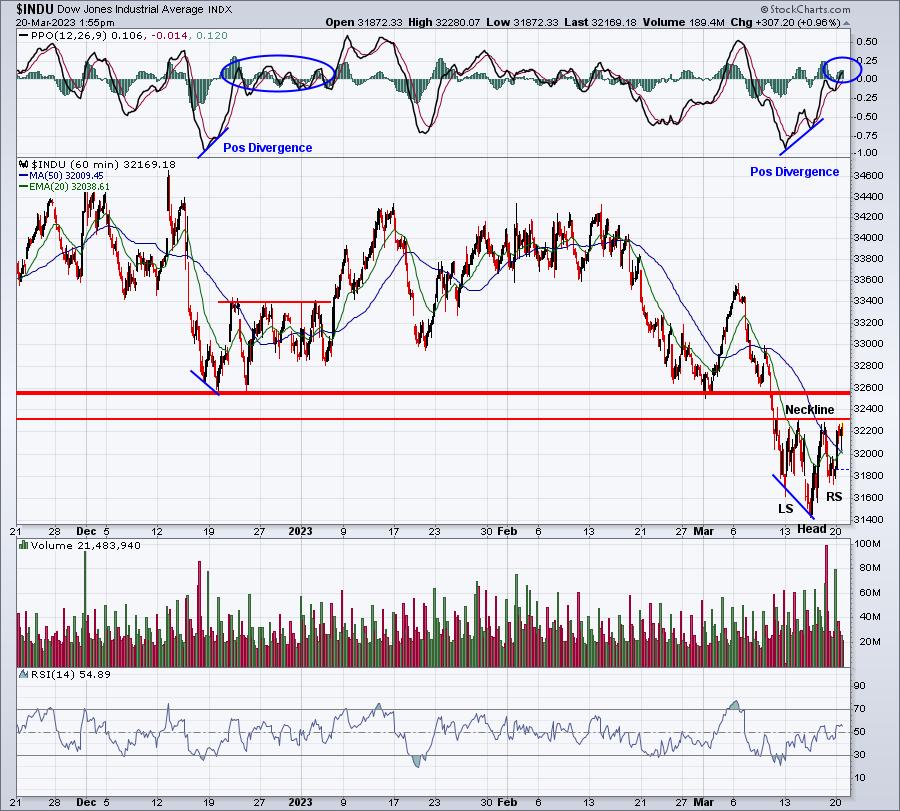
The current setup looks very similar to late December. A positive divergence formed, we rallied back to the 50-day SMA, and then struggled there for a bit, before finally breaking through. I could see a similar next couple of days. We've rallied to test the 50-day SMA and now are facing the overhead price resistance established by that initial high, which also appears to be a neckline in a bottoming head & shoulders pattern.
I remain very bullish and fully expect the next rally will clear key 4300 price resistance on the S&P 500, set last August.
Sector/Industry Focus
Growth stocks soared last week, but there are signs that perhaps near-term we'll struggle a bit. To illustrate, let's look at the 60-minute charts for 3 of the most significant growth-oriented industry groups:
Semiconductors ($DJUSSC):
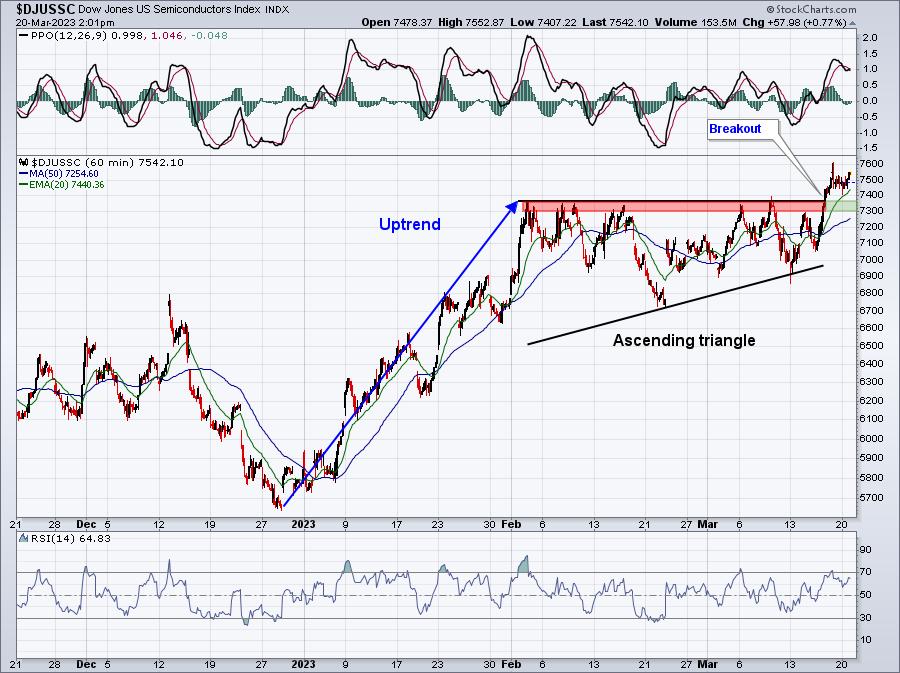
This is the most bullish of the 3 industry charts. I love the bullish ascending triangle breakout, but we do need to realize a possible backtest of the breakout level. That could potentially be in the 7300-7400 area.
Software ($DJUSSW):
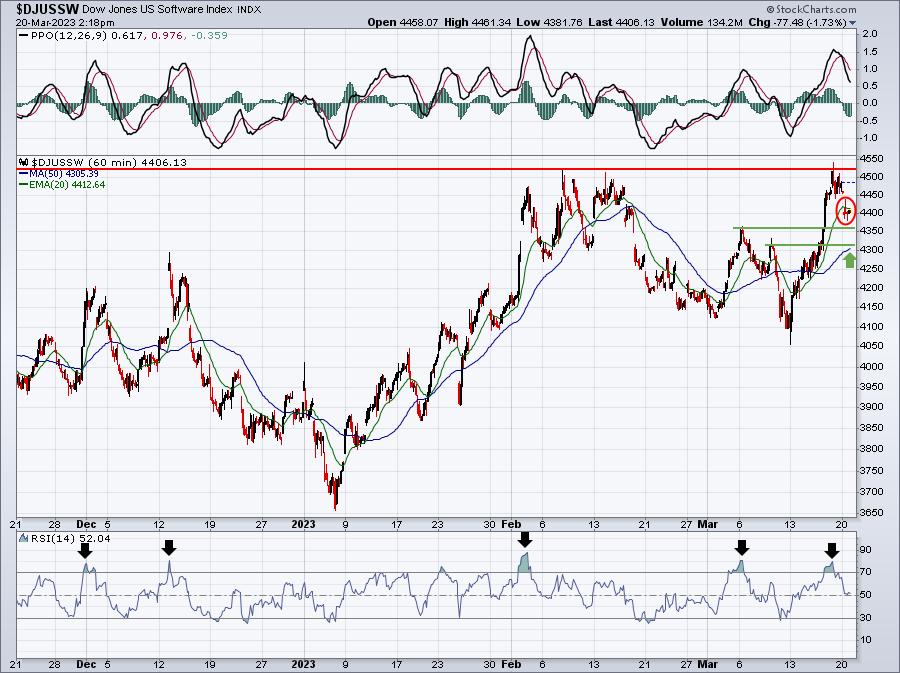
After reaching overbought territory, the DJUSSW has pulled back to relieve the overbought conditions. I see two key short-term support levels at 4360, then 4315. Unlike the DJUSSC, the DJUSSW has not made its breakout and could consolidate further, before a breakout later this month. The red circle highlights the move just beneath the rising 20-day EMA. The DJUSSW needs to move back up through this short-term resistance to get the bullish trend moving again.
Internet ($DJUSNS):
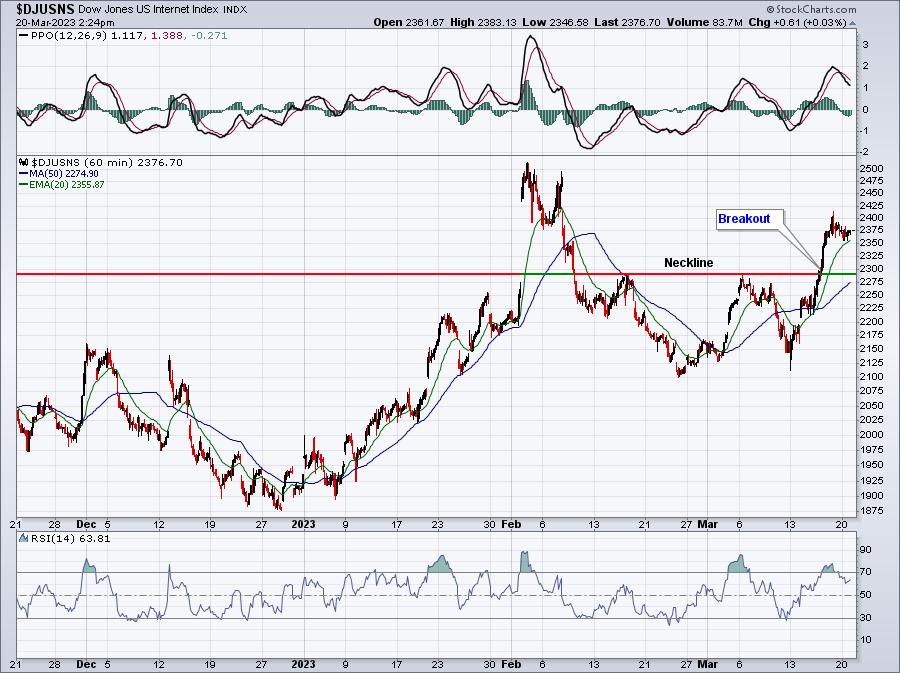
Internet remains well beneath its earlier high. So the DJUSSC has broken out, the DJUSSW has tested overhead resistance, but NOT broken out yet, and the DJUSNS is still well short of price resistance. All 3 of these charts look fine technically, but all are in position to weather a bit of profit taking as well. On the DJUSNS, the price support level to watch, in my opinion, is 2290. A pullback to that level is certainly possible, though not at all a guarantee.
ChartLists/Strategies
As I've said plenty of times before, I love trading off of key gap support. The best way to do this at StockCharts is to use the Alert tool. Here's an example of how I'd use this tool. First, let's look at Dicks Sporting Goods (DKS), a specialty retailer ($DJUSRS):
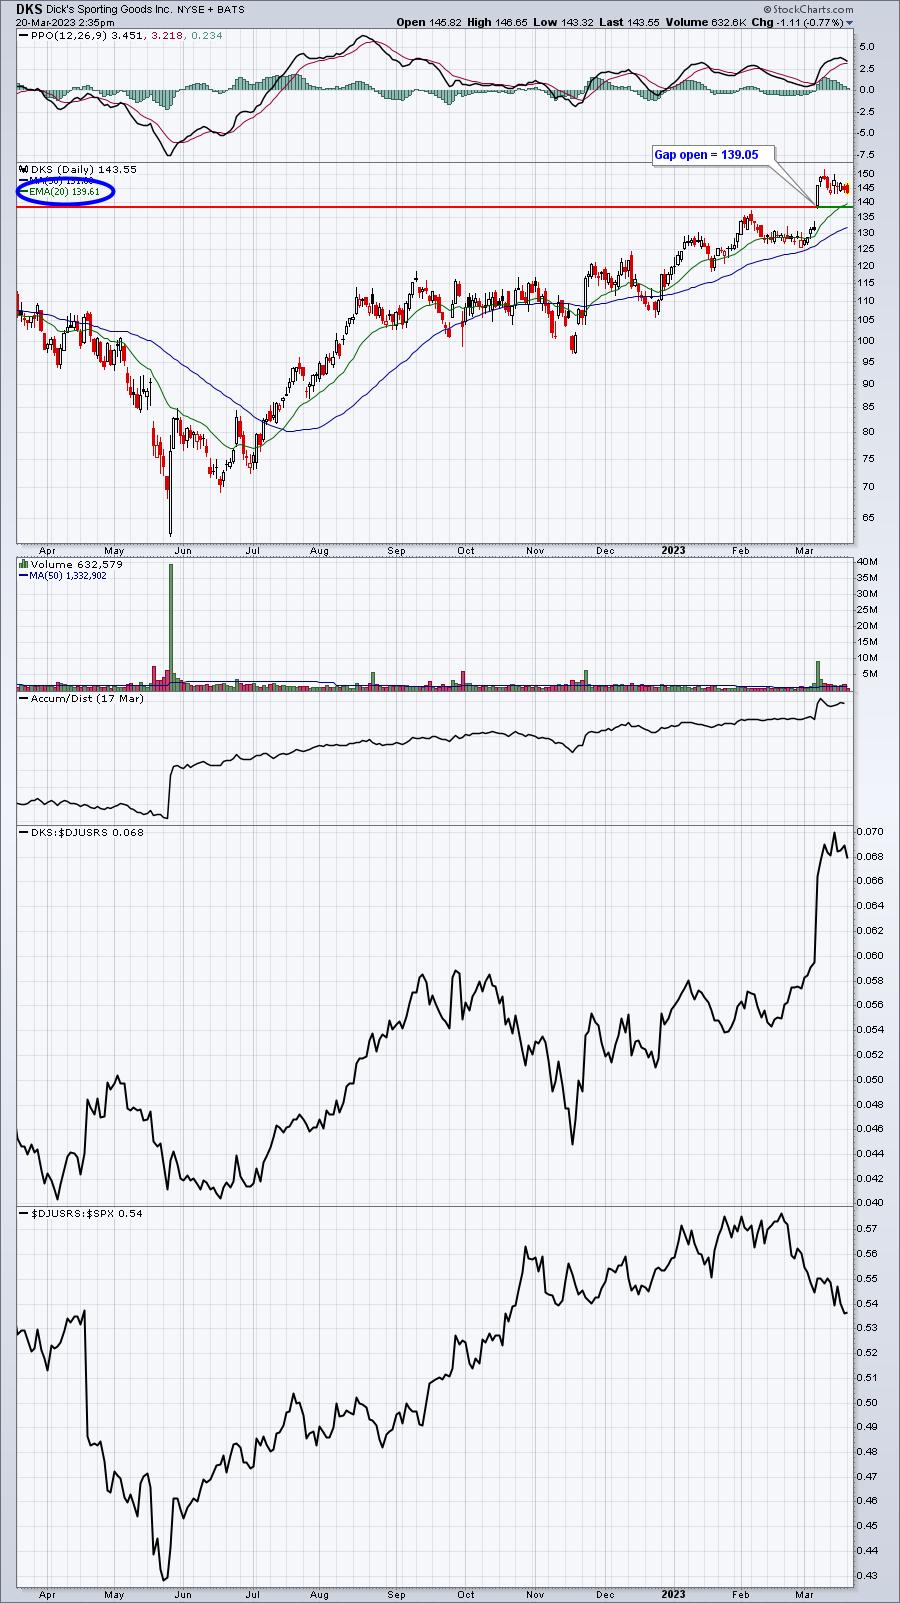
There was a big increase in volume on the day of earnings, DKS gapped higher and continued rolling until it reached the 150 level. There was a reversing shooting star candle on the high and DKS is now trending lower. Gap support is 139.05 and the rising 20-day EMA is at 139.61. DKS is currently trading at 143.55. I don't want to buy it here, because that leaves me more than 4 dollars of downside just to get to support. I want to buy on or very close to support. Now there are thousands of stocks and DKS may not reach 139.05 for several days - or even at all for that matter. But I'm going to be looking at hundreds of other stocks over the next few days and I'll likely miss DKS hitting 139.05, unless I either put in an order at my broker or set an alert at StockCharts. I don't want to simply buy DKS if it hits 139.05 as it could have negative news sending it there or it could be on massive volume. I want to look at the chart before buying, so I prefer to set an alert.
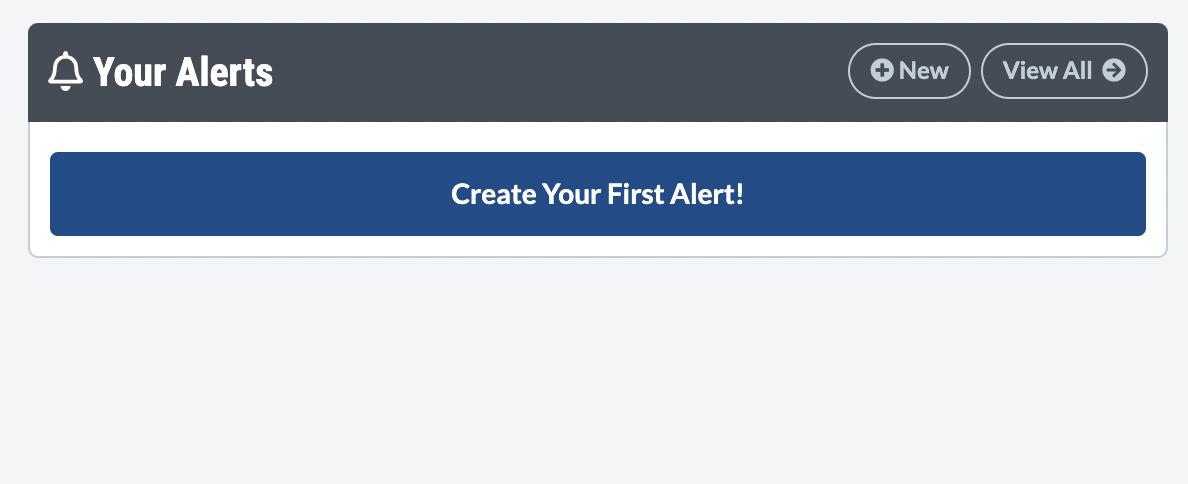
On the StockCharts.com "Your Dashboard", the alerts area looks like this (if you have no current alerts):
In order to set an Alert, you have to establish a "price alert", as follows:
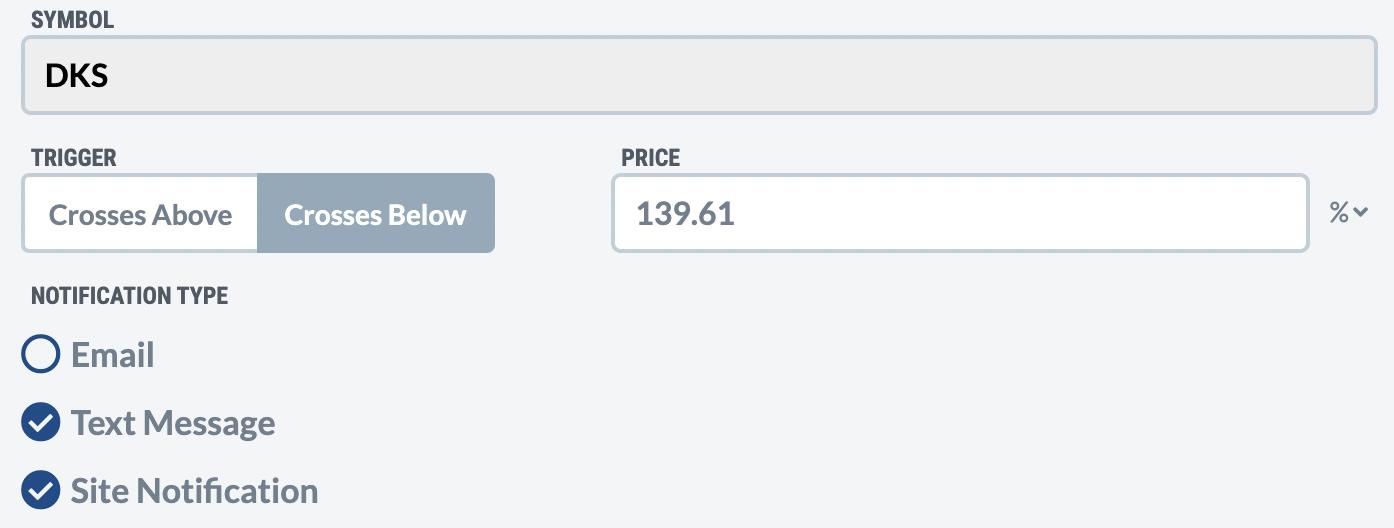
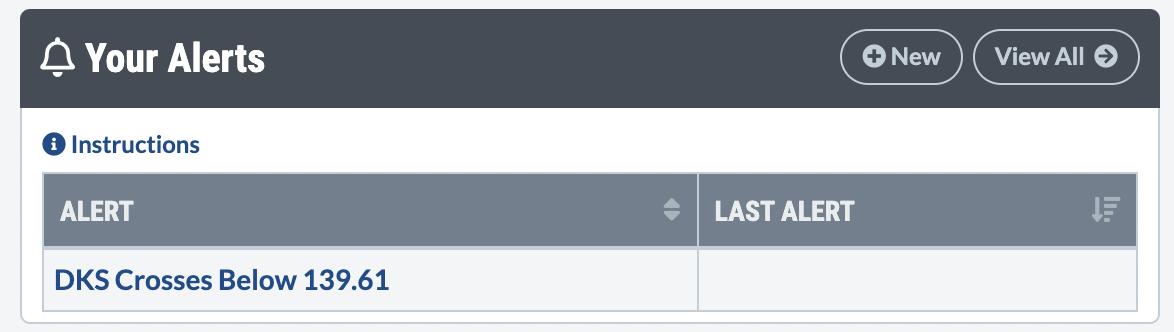
If DKS moves below 139.61 (current 20-day EMA), I'll be notified by text and via site notification (banner will appear at top of your StockCharts page). Once notified, I can then decide how I want to proceed. This will help me to avoid missing out on perhaps the best possible entry point. After I've "Saved" my Price Alert, this is how it will appear on "Your Dashboard":
Give it a try! It'll make a big difference in your trading success over time.
Earnings Reports
Here are the key earnings reports for the next two days, featuring stocks with market caps of more than $10 billion. I also include several companies with market caps below $10 billion. Finally, any portfolio stocks that will be reporting results are highlighted in BOLD. If you decide to hold a stock into earnings, please understand the significant short-term risk that you are taking. Please be sure to check for earnings dates for any companies you own or are considering owning.
Monday, March 20:
FL
Tuesday, March 21:
NKE, ONON, TME, GME, HQY, ARRY, CSIQ, AIR
Economic Reports
None
Happy trading!
Tom