
EB Daily Market Report - Tuesday, March 21, 2023
We are roughly 24 hours away from the next Federal Reserve interest rate decision. While I'm not completely sure what the Fed is going to do, Wall Street consensus is that they will raise another quarter point. I'm also not sure how market participants will react to whatever the Fed does. But, by doing a lot of intermarket research, I am absolutely certain about a few things:
Rotation Continues BIG TIME Into The NASDAQ
I've updated my QQQ:SPY ratio through yesterday's close and it's VERY clear that money is rotating rapidly into the more growth-oriented NASDAQ 100 from the S&P 500. I also know that a rising QQQ:SPY ratio usually leads to a rise in the S&P 500. Take a look at the latest chart here (remember that even though my chart shows "@SPYQQQ", it's really the QQQ:SPY ratio):
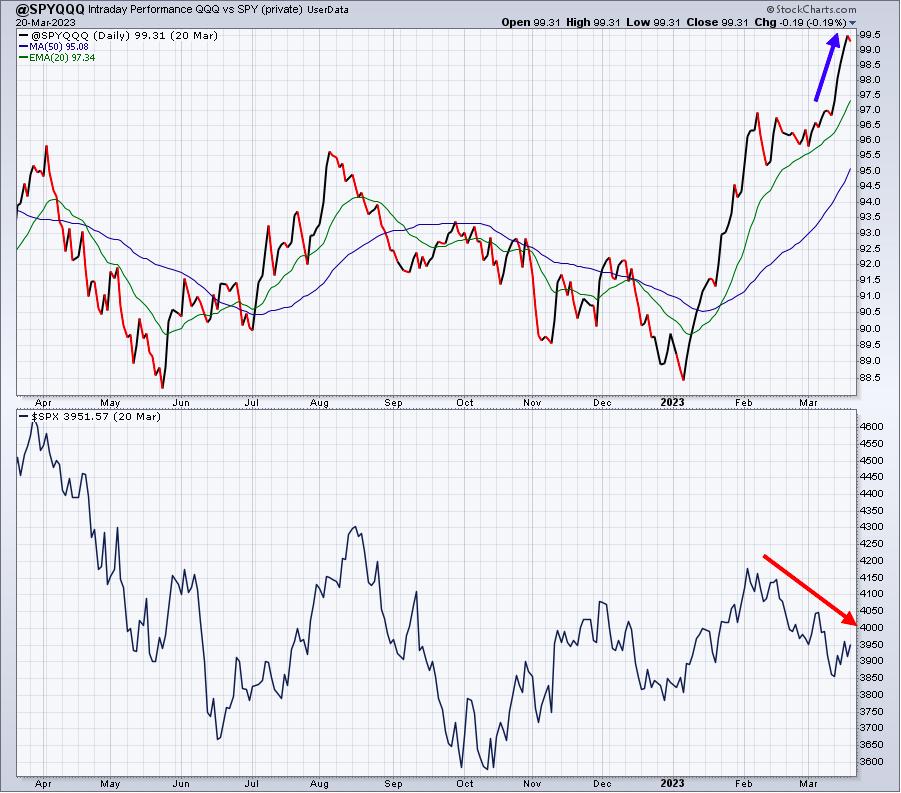
This chart IGNORES opening gaps in very similar fashion to the calculation of the accumulation/distribution line (AD line), which I personally believe is more useful than a standard QQQ:SPY chart. While the S&P 500 has been dropping and conditions appear to be worsening, the QQQ:SPY is SOARING! Wall Street is moving very heavily into the aggressive NASDAQ and I believe I know why. Rates will be coming down soon and we're about to see an explosion higher.
The above chart runs through yesterday. On this next chart, you can see how the QQQ has been performing today vs. the SPY:
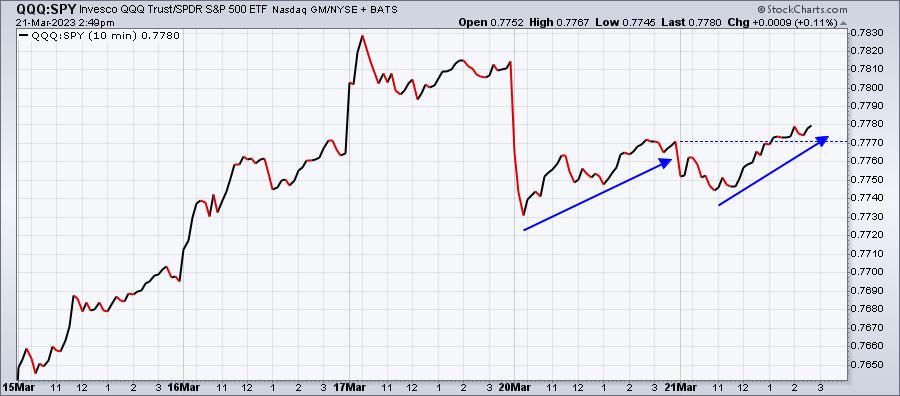
We've seen opening weakness in the QQQ vs. the SPY yesterday and today, but once amateur hour ends around 10am ET, the ratio explodes higher again. The next breakout will be very meaningful given this backdrop.
Rotation Is Also Evident In Discretionary Stocks
As you probably know, one of my favorite intermarket relationships is the XLY:XLP (consumer discretionary vs. consumer staples). I'm in the process of analyzing the intraday action of the XLY vs. XLP, similar to what you can see above in the QQQ vs. SPY. I have all the data through yesterday's close, but I need to input a year and a half's worth of data into the User-Defined Index at StockCharts. I'll have that chart to you soon. But here's what I can tell you. The intraday XLY:XLP is back near its early January 2022 high when the S&P 500 was trading at an all-time high. The low on this ratio occurred on May 24, 2022, when the index value fell to 60.12. The current value as of Monday's close was 84.83. We ended 2022 at 68.15, so there's been tremendous intraday rotation into the XLY and out of the XLP in 2023. These signals, in my view, are extremely bullish.
Sentiment - CPCE
My favorite sentiment indicator is the equity-only put-call ratio ($CPCE). Short-term bottoms are found when the 5-day moving average of the CPCE rises to .80. I've again created a User-Defined Index to adjust certain daily CPCE readings in November and December that were overstated due to large institutional puts bought on key NASDAQ stocks like AAPL, AMZN, TSLA, and GOOGL. These do not represent the retail traders psyche that we're trying to gauge via the CPCE, so I adjusted them out. Here's what this 5-day SMA of the CPCE has looked like over the past year:
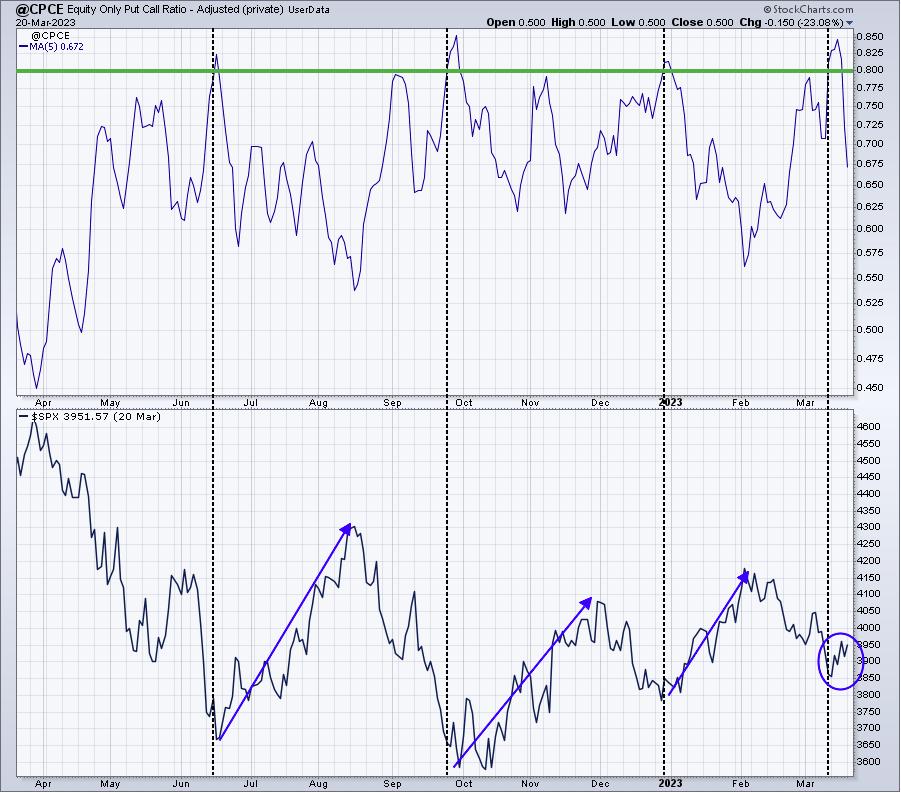
The vertical black-dotted lines identify when the 5-day moving average exceeds .80. In each case, the S&P 500 has rallied strongly.
Now remember back to MarketVision 2022, held on Saturday, January 8, 2022. I talked about sentiment being the biggest issue of 2022. Retail traders had NEVER been so bullish and we needed to see that reset. In other words, we weren't likely to find a market bottom until the masses grew so bearish that they believed the market would never recover. We're there. The 253-day SMA of the CPCE turned UP off of extreme complacency readings in January 2022 and that marked a MAJOR market top. Check out this CPCE chart, highlighting the 253-day SMA:
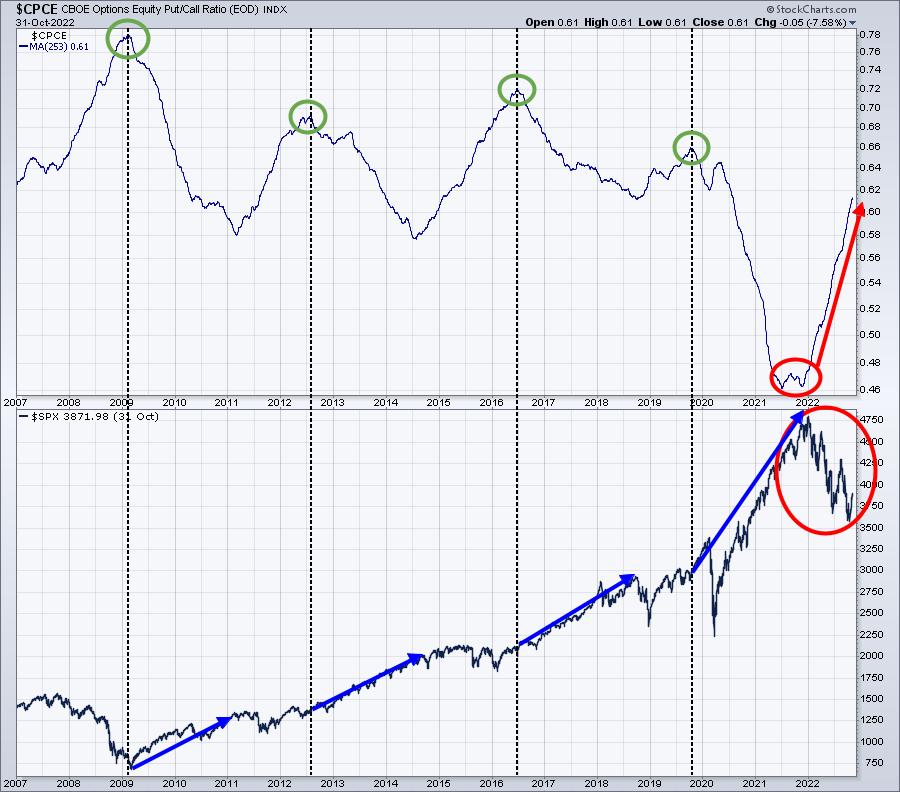
The green circles highlight when the 253-day CPCE rolls over from extreme bearish readings. When this occurs, you can see the resulting rallies in the S&P 500 at the bottom. I deliberately cut off this report at October 31, 2022, because of the inappropriate readings that printed in November and December. Instead, let's look at my User-Defined Index and concentrate on what's happened since October 31st:
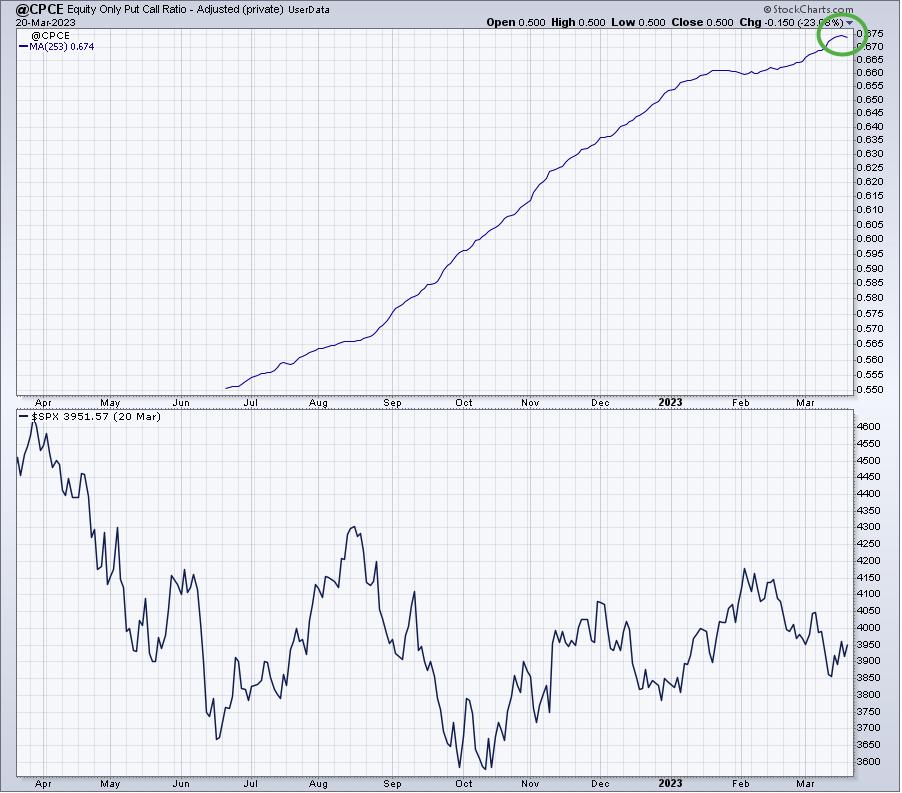
I believe this is FINALLY it. I see this as the confirming signal that you want to be long the stock market from this point forward. I've been long and I've been suggesting that we remain long - at least via the QQQ. I see perhaps one more hiccup in the near-term and that's the combination of the Fed meeting tomorrow and the negative divergences present on both the QQQ and the semiconductors ($DJUSSC)
Beware The Negative Divergence
There is no negative divergence on the DIA or the SPY, only the QQQ. I am remaining long the QQQ to be safe. If we do sell off short-term, because of short-term momentum issues, I'll use resulting weakness to shift into the QLD (2x leveraged ETF) or TQQQ (3x leveraged ETF). I see a major rally coming. But check out these negative divergences on the hourly charts:
QQQ:
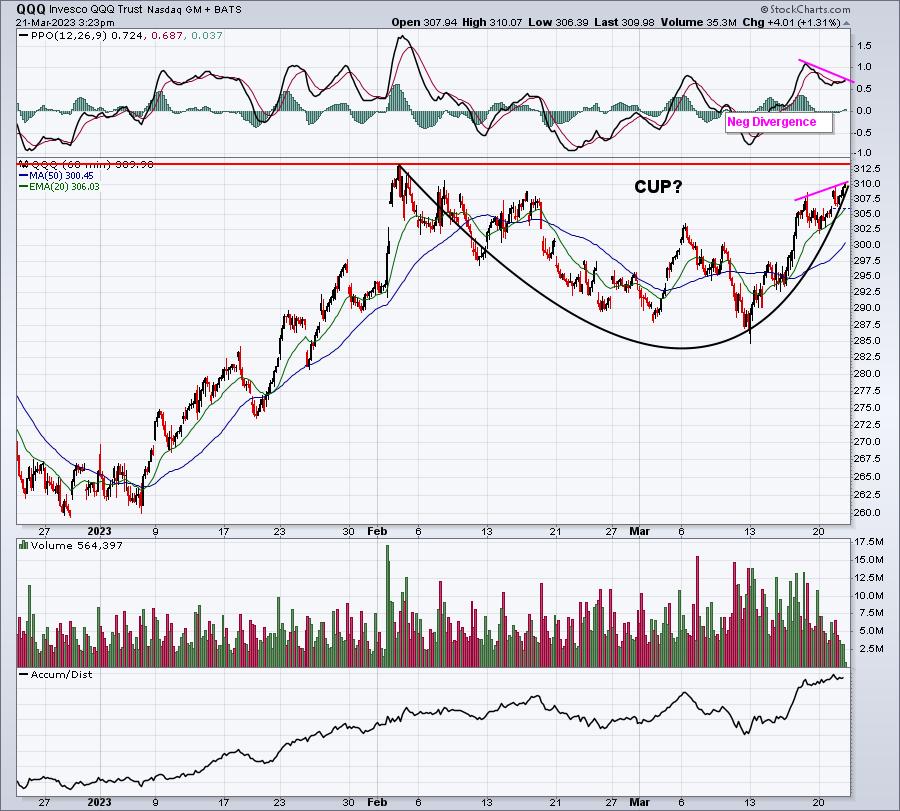
Maybe we hit resistance tomorrow prior to or just after the Fed announcement, then sell off into a handle? Given the negative divergence, it's certainly a possibility. I'm so bullish, however, that I am not letting go of my QQQ. If we pull back, I'll use it to begin shifting into a more aggressive position.
DJUSSC:
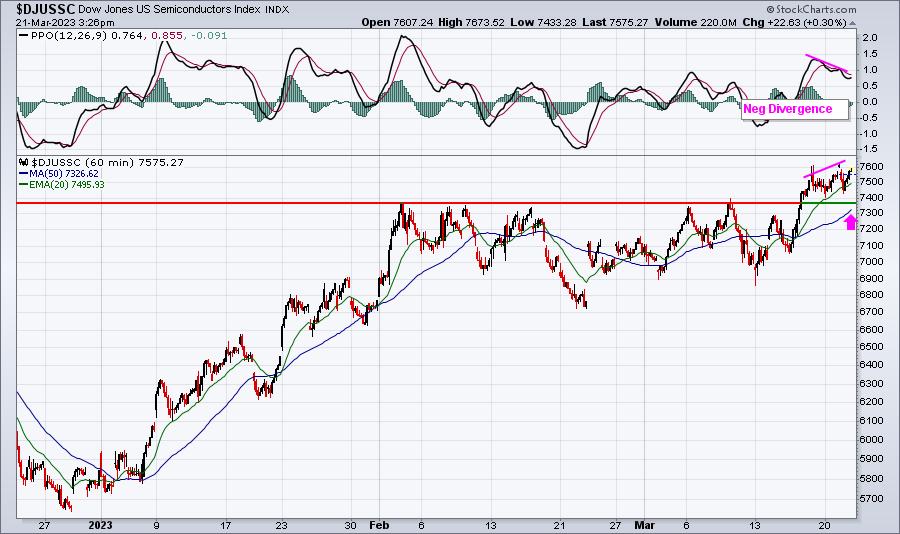
Semiconductors have been on fire and they surely could pause temporarily while a negative divergence resets. If so, a trip back to test the rising 50-day SMA would likely serve a dual purpose. That would also retest the area of the recent breakout above 7375.
Listen, we know how volatile things can get after a Fed announcement. However, my signals are telling me that any crazy selling to the downside could be a FINAL opportunity to buy cheap ahead of a significant rally. We've had patience for the better part of 15 months, awaiting the next major leg of this secular bull market that began in 2013. While I cannot guarantee that's about to take place, my signals are most definitely pointing in that direction.
I just call what I see.
Happy trading!
Tom