
EB Daily Market Report - Thursday, March 23, 2023
Executive Market Summary
- Futures were strong overnight, suggesting a rebound from the Wednesday late-afternoon selloff
- The Volatility Index ($VIX, -8.04%) is back near 20, suggesting that fear is dissipating once again
- Gold ($GOLD, +2.02%) is having a solid day, threatening the $2000 per ounce level
- Copper ($COPPER, +1.26%) is higher for the 6th consecutive session, potentially signaling the market's belief that we'll see improving global economic conditions
- Crude oil ($WTIC, +0.78%) continues its rebound, rising above $71 per barrel today
- The 10-year treasury yield ($TNX) is down more than 3 basis points, now at 3.47%; a drop and close beneath 3.37% would be very bullish for aggressive growth stocks
- Technology (XLK, +2.53%) is leading today's rebound as renewable energy ($DWCREE, +5.65%) and semiconductors ($DJUSSC, +3.36%) strengthen their 2023 leadership roles
- Netflix (NFLX, +9.07%) is the top-performing stock in the S&P 500, leading internet stocks ($DJUSNS, +2.52%) higher
Market Outlook
Talk about volatility! No matter how long you trade the stock market, the two hours that follows the Fed meeting is NEVER easy. The swings back and forth were crazy and can be seen by checking out this 3-day 5-minute chart of the S&P 500:
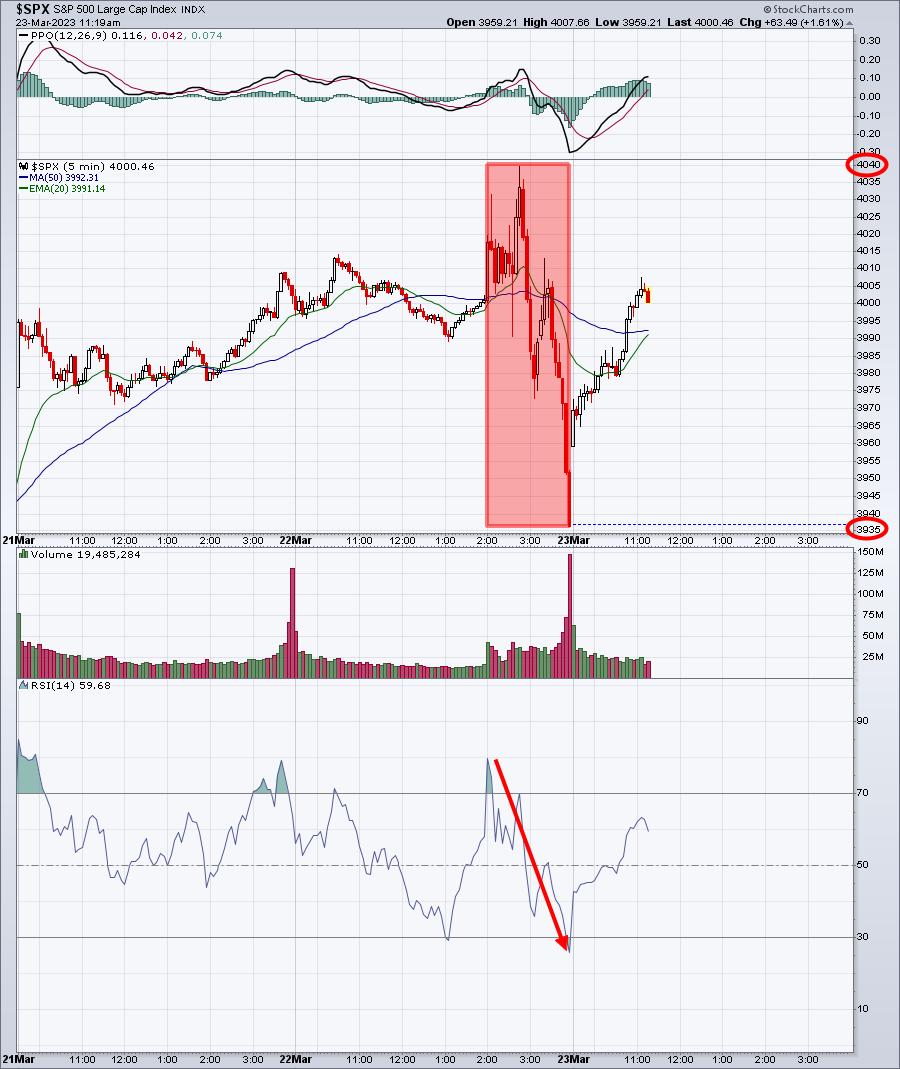
We've rallied steadily today, but need to clear yesterday's intraday high for me to really turn aggressively bullish. We were in breakout territory just before 3pm ET yesterday, but we saw what happened into the close. A similar finish today isn't out of the question. I will remain steadfastly bullish, overlooking the short-term whipsaw action. Note that almost the entire move higher in the Volatility Index ($VIX) last week has been lost as the VIX tumbles another 8% today. Sentiment is screaming to buy this market.
Sector/Industry Focus
The NASDAQ 100 ($NDX) looks quite interesting and yesterday's intraday breakout, and ultimate failure on the close, suggested we'd likely see further selling today - perhaps to print a handle down to the rising 20-day EMA:
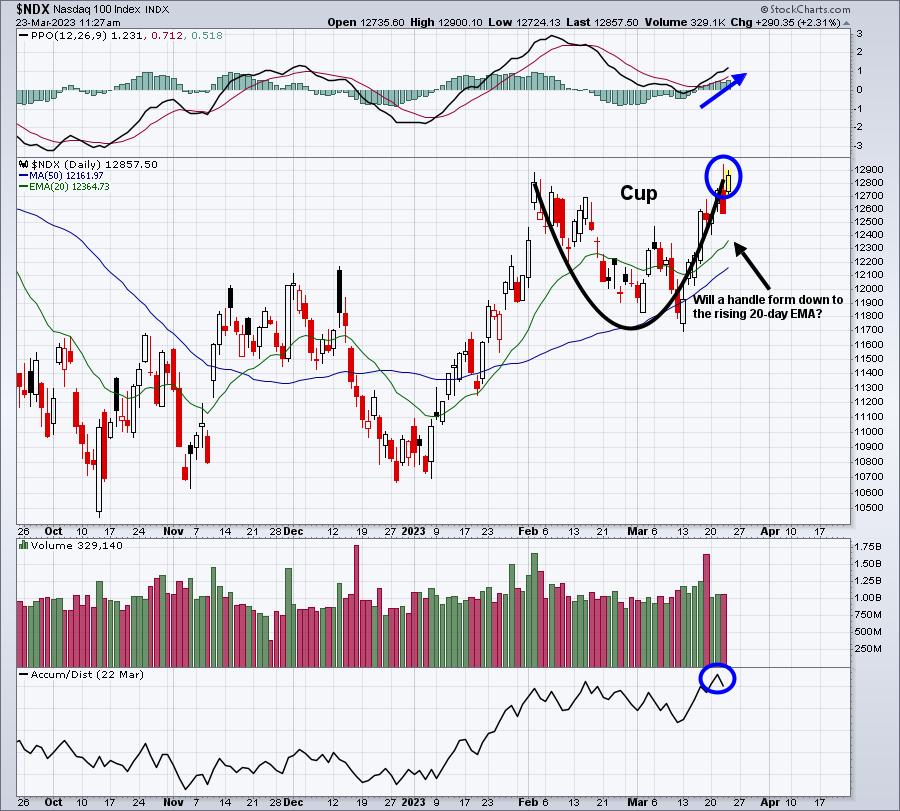
Will we leave another long tail to the top with a weak finish? If so, the odds increase that we'll see perhaps a 20-day EMA test, which would be the "handle" in this current bullish continuation pattern. But there's no guarantee that we settle into some type of continuation pattern. We absolutely could just break out and run. So I've circled the high from yesterday and where we're currently trading. I believe where we go from now through 4pm ET today will dictate whether we're in a continuation pattern or in a breakout.
I've said that I will use weakness to begin transitioning from my QQQ holding into a bit of a leveraged TQQQ position. I could move up to 25-30% into the TQQQ from the QQQ, which adds a lot of risk to my portfolio. Many members have asked me to communicate when I make such a move, so that's what I'm doing. I bought a third of my desired TQQQ stake just before yesterday's close. My plan then, and still, is to transition further IF we sell off. I'd consider transitioning more from QQQ to TQQQ if we reach say 304, then my final transition would be on a QQQ 20-day EMA test. If we keep moving higher into today's close, I'll make no changes. I would only transition further on a 20-day EMA test. Otherwise, I'm perfectly content with my current slightly-leveraged position.
ChartLists/Strategies
I reviewed a few hundred charts this morning and found 2 below that I believe will be significant outperformers - with one caveat. My thesis about continuing rotation into growth needs to be right. If so, then rotation should benefit these two in a big, big way:
TTD:
Trade Desk (TTD) is a $30.6 software stock ($DJUSSW). The DJUSSW has improved significantly in 2023, actually breaking out to an 11-month relative high vs. the S&P 500, so the group is hot. TTD shows a very strong AD line that has been trending higher since mid-December. Its volume with earnings was incredibly heavy and now that we've seen a recent pullback, I believe TTD is poised for a major run to the upside:
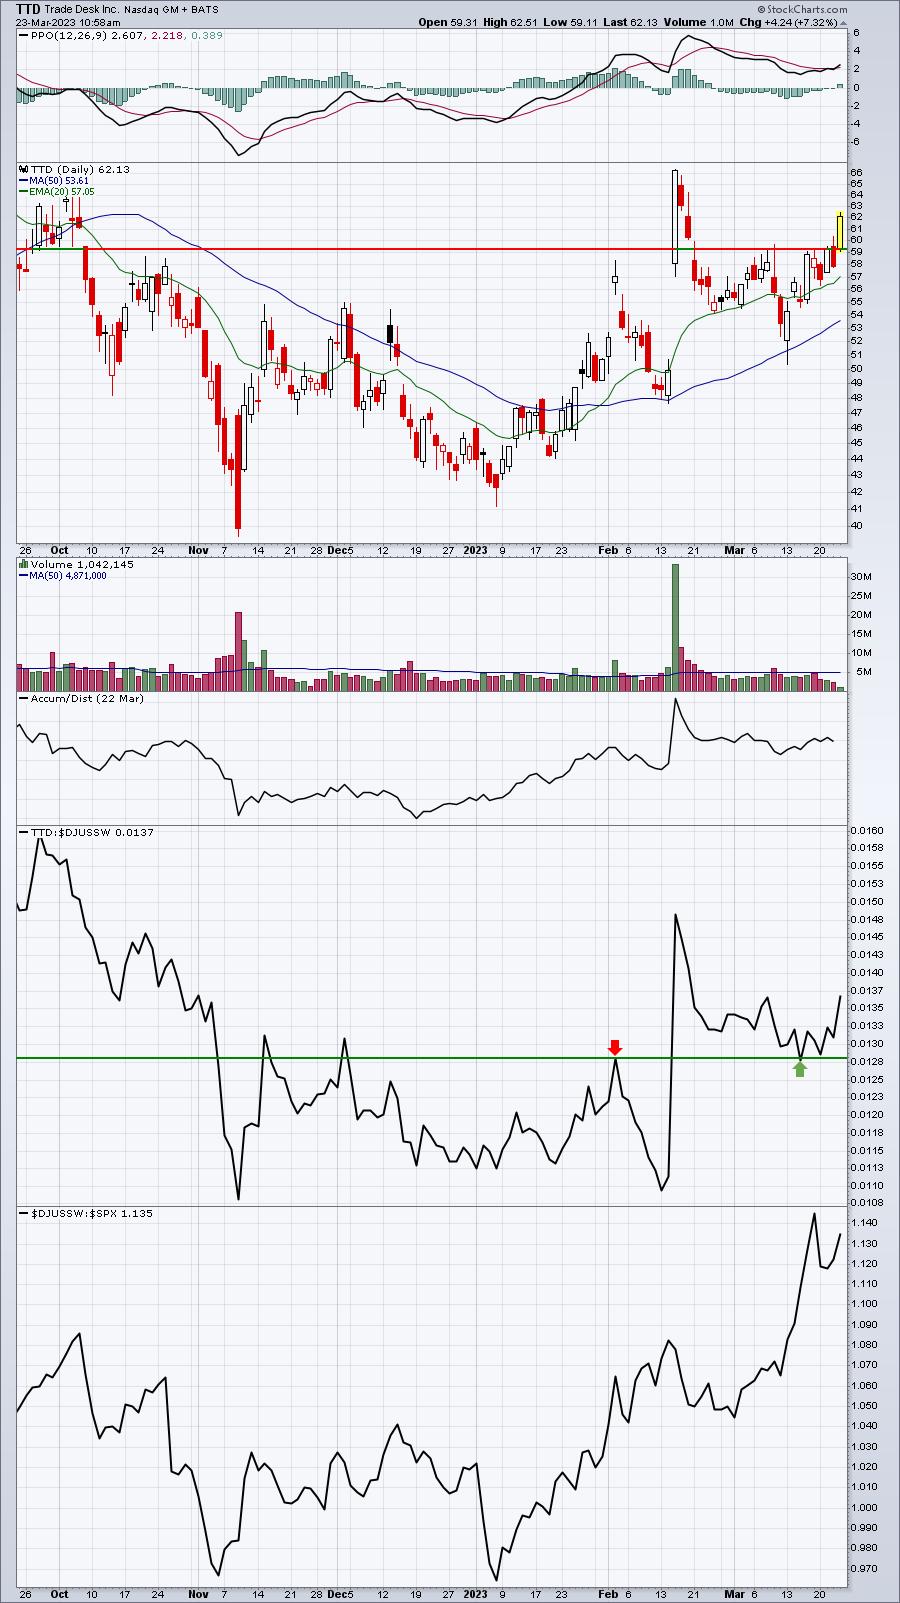
Obviously, the big number will be clearing the close after its recent quarterly earnings report was released. That close was 66.30. Expect some price resistance there, with an eventual closing breakout above.
CRUS:
Cirrus Logic (CRUS) is one of the strongest semiconductor stocks ($DJUSSC) and the DJUSSC (+27.99%) year-to-date trails only automobiles ($DJUSAU, +39.07%) and renewable energy ($DWCREE, +36.71%) as the best-performing industry group of 2023. Right now, CRUS is consolidating in what appears to be a cup or possibly just sideways rectangular consolidation. Either way, these are bullish continuation patterns where we should expect higher prices to come:
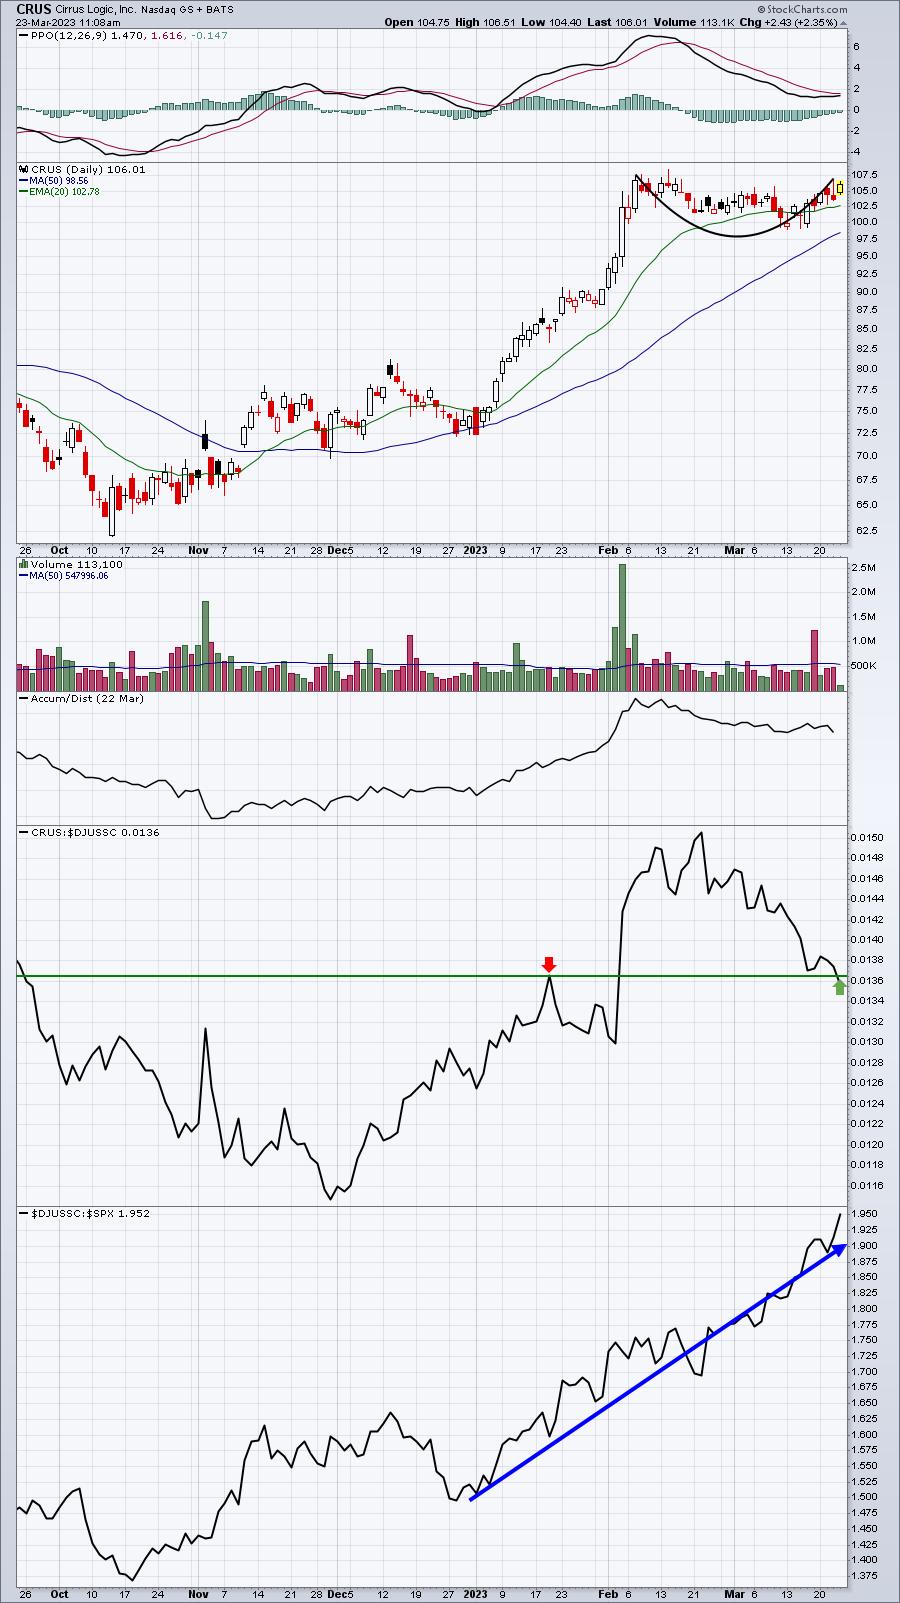
TTD is one of our Aggressive Portfolio stocks and CRUS is one of our Model Portfolio stocks. I liked both of them when we "drafted" our stocks on February 17th. 5 weeks later, I like them just as much, if not more. Further rotation into aggressive growth stocks will add to their current strength, in my opinion.
Earnings Reports
Here are the key earnings reports for the next two days, featuring stocks with market caps of more than $10 billion. I also include several companies with market caps below $10 billion. Finally, any portfolio stocks that will be reporting results are highlighted in BOLD. If you decide to hold a stock into earnings, please understand the significant short-term risk that you are taking. Please be sure to check for earnings dates for any companies you own or are considering owning.
Thursday, March 23:
ACN, GIS, DRI, FDS, CMC, AUY, FIZZ, BAK, OXM
Friday, March 24:
None
Economic Reports
Initial jobless claims: 191,000 (actual) vs. 195,000 (estimate)
February new home sales: 640,000 (actual) vs. 645,000 (estimate)
Happy trading!
Tom