
EB Daily Market Report - Thursday, March 30, 2023
Executive Market Summary
- Futures were very strong overnight and we gapped significantly higher
- The NASDAQ is showing relative strength for the second consecutive session
- Growth (IWF, +0.73%) is also trumping value (IWD, +0.43%)
- The 10-year treasury yield ($TNX) is down 2 basis points and failed in its bid to clear its 20-day EMA at 3.61%
- Gold ($GOLD, +0.79%) is back to $2000 per ounce, threatening its absolute price resistance, but its relative strength is beginning to deteriorate vs. the S&P 500
- Crude oil ($WTIC, +1.71%) has jumped above $74 per barrel, but energy (XLE, +0.44%) lags most other sectors
- Leadership today is from the same sectors as yesterday, with technology (XLK, +1.12%) leading the charge
- Semiconductors ($DJUSSC, +1.69%) are helping to lift technology stocks
Market Outlook
The Volatility Index ($VIX) has been tumbling and currently is beneath the 19 level:
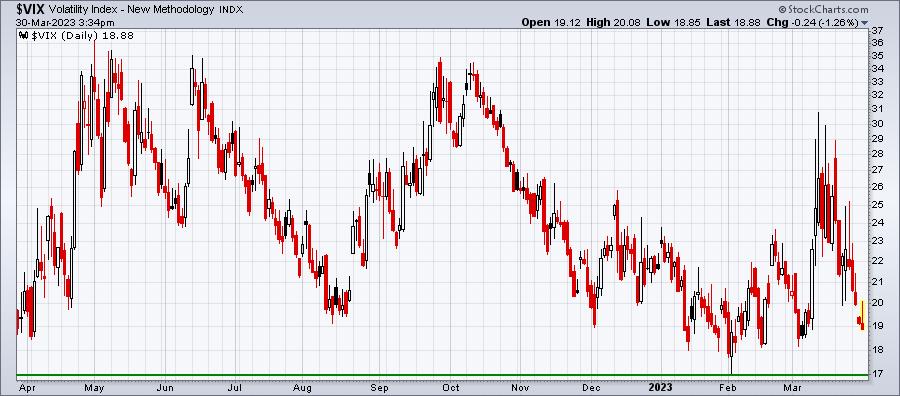
I want to remind everyone that we've NEVER had a SECULAR bear market (long-term) if the VIX drops below the 16-17 level. In other words, every time we've seen a sub-16 reading on the VIX, we've been in a bull market. I point this out, because it would be a confirming signal that we're advancing in a secular bull market, also confirming the bottom call that I made last June (though we did eventually move slightly lower in October).
Sector/Industry Focus
Software ($DJUSSW), a very important industry within technology (XLK), and also a high-growth area that I watch closely, continues to strengthen, adding to its recent absolute breakout, while also showing strong leadership:
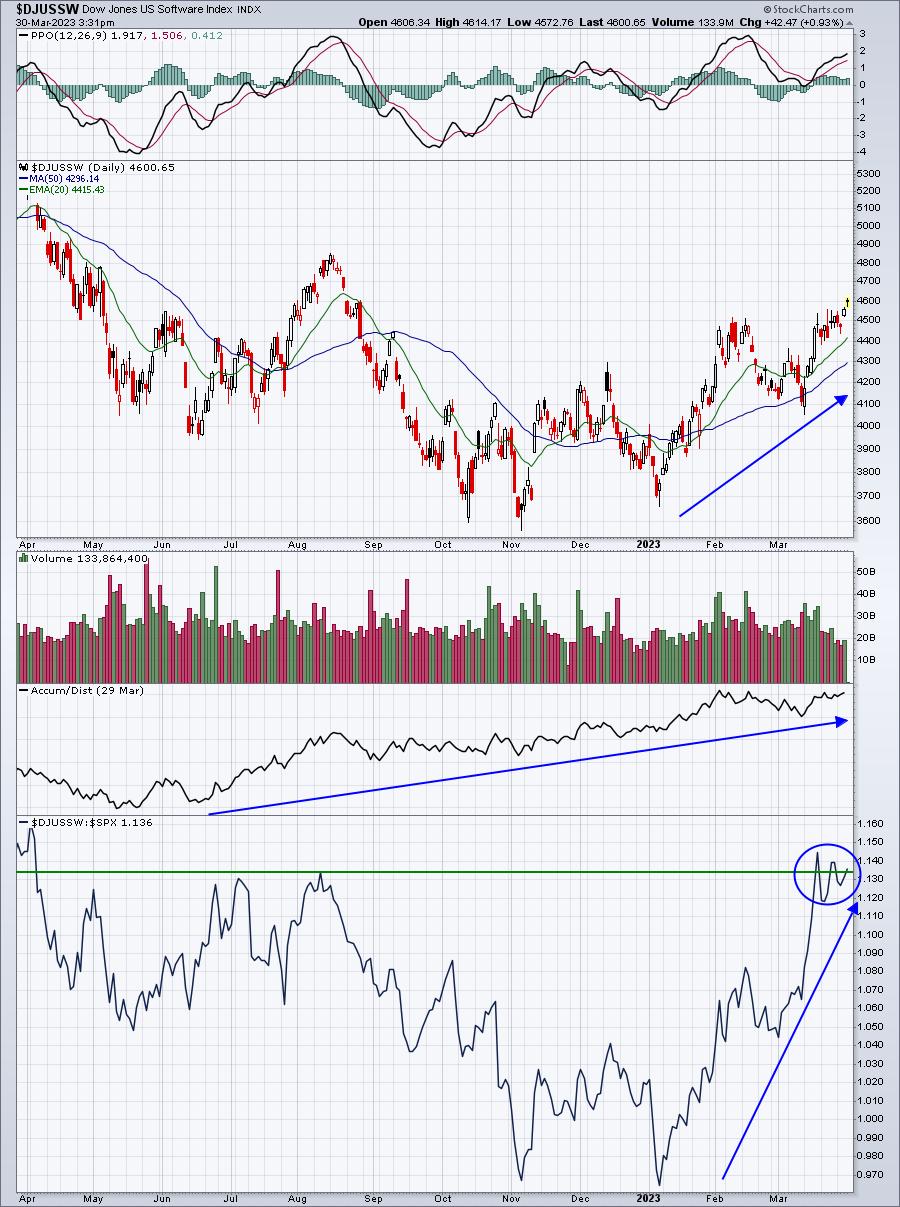
This is just adding to the bullishness that I've been discussing.
ChartLists/Strategies
I spent some time today studying many charts on our Strong Earnings ChartList (SECL) and two stocks caught my attention and I bought both, but for different reasons:
AMZN:
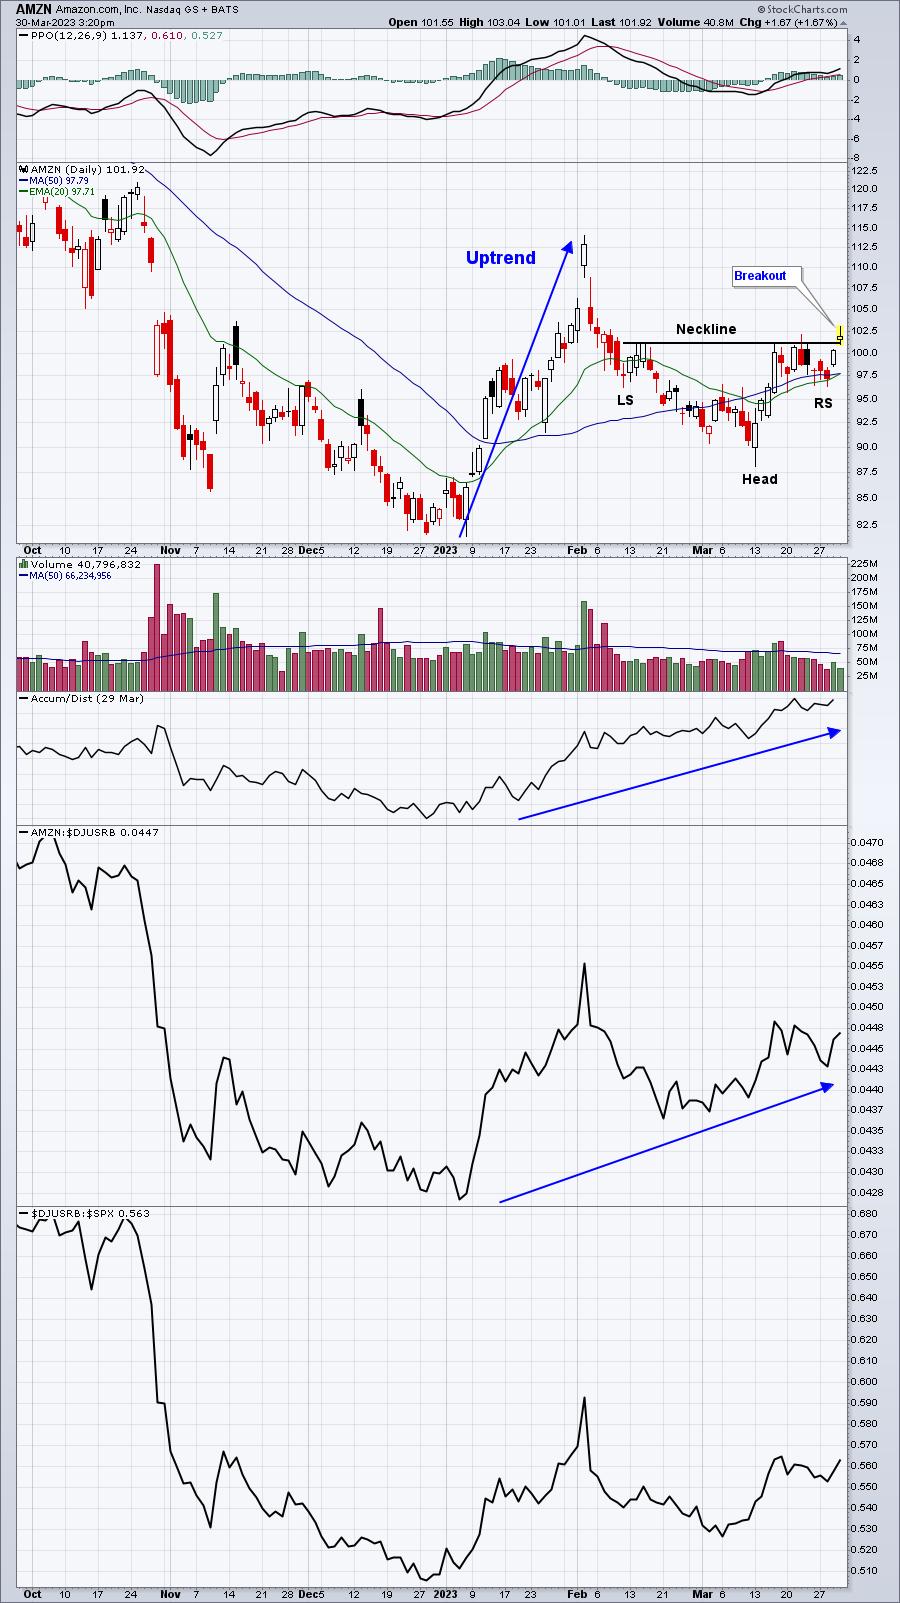
AMZN is breaking out above neckline resistance in a bullish inverse head and shoulders continuation pattern, essentially suggesting that AMZN is poised to rally back to its early-February high:
March and April also kick off the most bullish period for AMZN. The returns on these consecutive months are the best of any 2-consecutive month period of the year - dating back to 2003:
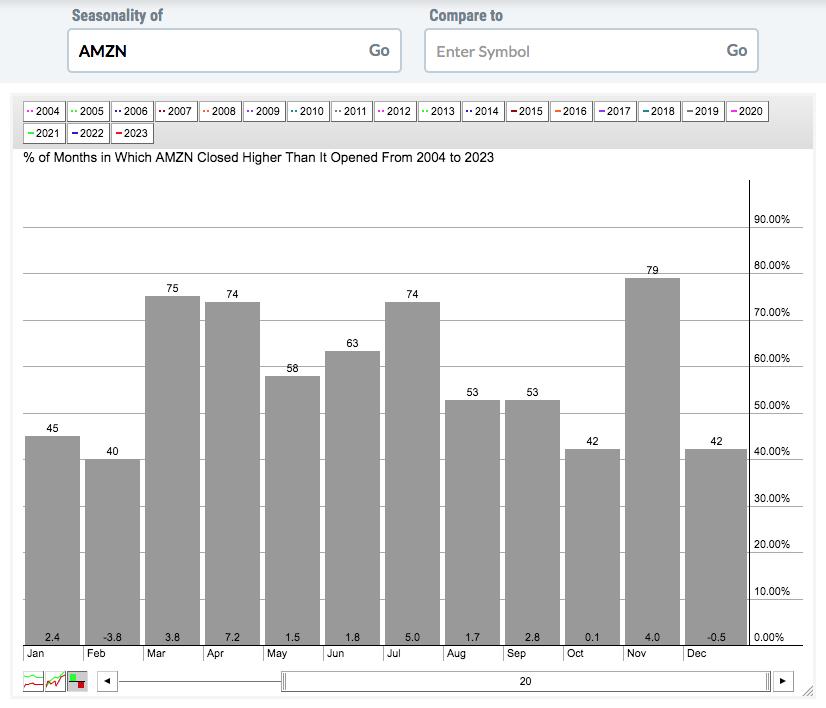
AMZN has averaged gaining 11.0% just during the March-April period. From the chart above, you can AMZN has already performed quite well in March, and now that it's made a technical breakout, I believe it can run back to the February high as it heads towards its earnings report in a month or so.
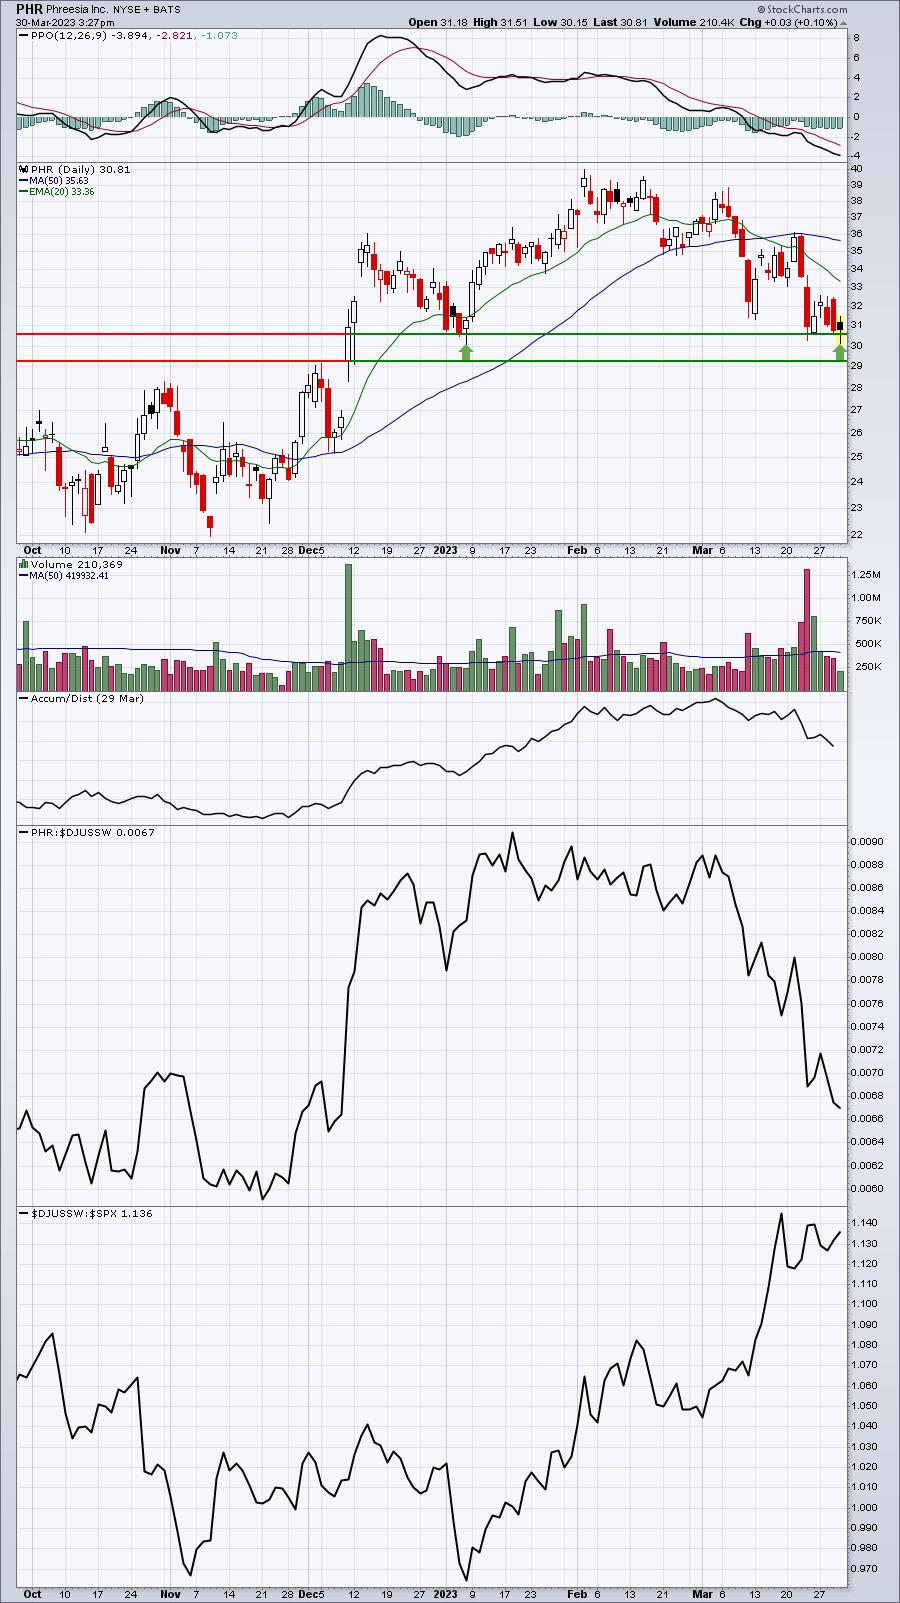
PHR:
I simply like this area of support on the chart. PHR was a big leader in software until it recently topped. It's struggled on a relative basis lately, but that's normal during a period of consolidation. I'm looking for a solid move higher over the next few weeks:
Earnings Reports
Here are the key earnings reports for the next two days, featuring stocks with market caps of more than $10 billion. I also include several companies with market caps below $10 billion. Finally, any portfolio stocks that will be reporting results are highlighted in BOLD. If you decide to hold a stock into earnings, please understand the significant short-term risk that you are taking. Please be sure to check for earnings dates for any companies you own or are considering owning.
Thursday, March 30:
AUY, FIZZ, MANU, BRZE, BB, EVGO, AEHR
Friday, March 31:
None
Economic Reports
Initial jobless claims: 198,000 (actual) vs. 195,000 (estimate)
Q4 GDP (final): 2.6% (actual) vs. 2.7% (estimate)
Happy trading!
Tom