
EB Daily Market Report - Tuesday, April 4, 2023
Executive Market Summary
- Futures were slightly higher this morning as we approached the opening bell
- We opened very slightly higher, but have spent much of the day down in the 0.25%-1.00% range; the NASDAQ has shown relative strength
- Growth (IWF, -0.56%) has led value (IWF, 0.96%) throughout the session
- Crude oil ($WTIC, -0.22%) was higher this morning, but has reversed, sending energy shares (XLE, -2.04%) lower
- We have bifurcated sector action as utilities (XLU, +0.55%) lead, while industrials (XLI, -2.39%) are the hardest-hit group
- Every industry group within industrials is lower today, with several down in the 3%-5% range; commercial vehicles & trucks ($DJUSHR, -4.89%) are struggling the most
- The 10-year treasury yield ($TNX) is down 9 basis points to 3.35%, approaching key short-term yield support close to 3.30%
- Meanwhile, gold ($GOLD, +1.91%) is breaking to a 52-week high and moving closer to its pandemic-driven high near $2078 per ounce from March 2020
- Caterpillar (CAT, -5.75%) is part of that weak $DJUSHR and is weighing on the Dow Jones
Market Outlook
Back in February 2022, I hosted an "Anatomy of a Bear Market" webinar. The purpose was to point out what we should expect over the next several months, until we reached the conclusion of the 2022 cyclical bear market. After downtrending for the next few months, I called a market bottom in June 2022, declaring my belief that the 5 1/2 month cyclical bear market was over. We did end up printing a double bottom in October 2022, falling slightly below the June low. After the June low, I wrote an article at StockCharts and also discussed with EB members what to expect AFTER the conclusion of a bear market. I pointed out that the first 6-12 months of a new bull market historically produced some of the best market returns. The reason is simple. You run out of sellers. That's why a bear market fizzles. Once we have more buyers than sellers and sentiment resets, the bears have no chance. I believe we're at that point now.
I want to repost, however, the table that I produced in late-June 2022, summarizing all bear market since 1950 and the initial 6-month and 1-year returns after those bear markets ended. Check this out:
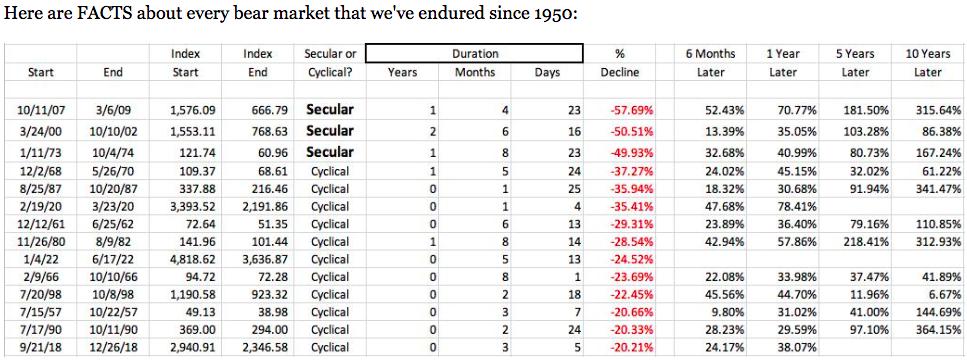
In this table, I show the 2022 S&P 500 bear market at -24.52%. The lower low in October actually resulted in a loss of approximately 28%, before the ultimate bottom printed. There's certainly still a chance that we'll go down and print a lower low, but I personally view the chance of that happening as very slim. There's been waaaay too much rotation into aggressive stocks by Wall Street for me to seriously entertain that idea. I just don't see it.
Anyhow, after the column showing the damage inflicted (%s in red) during each of the prior 13 bear markets, I show the 6-month, 1-year, 5-year, and 10-year rebounds after each. Look at the 6-month and 1-year returns! The worst 1-year return was +29.59% in 1990. The best was +78.41% following the March 2020 pandemic. I don't expect this kind of massive rally, but the average post-bear market rebound was north of 40%. If we tack on 40% to the S&P 500 low of 3491, that would suggest a reasonable chance for the S&P 500 to be challenging all-time highs by this October. I believe there's a very real chance of that happening. It's the reason why I do so much research into stock market history. Calling market tops and catching market bottoms can result in a MASSIVE difference ultimately in your financial nest egg at retirement. We don't have to follow the narrative that Wall Street wants us to follow. We think independently to afford a more secure retirement.
Sector/Industry Focus
Let's take another trip down memory lane and revisit that QQQ chart where we highlight how the QQQ traded throughout the trading day during various periods of market action since 2021:
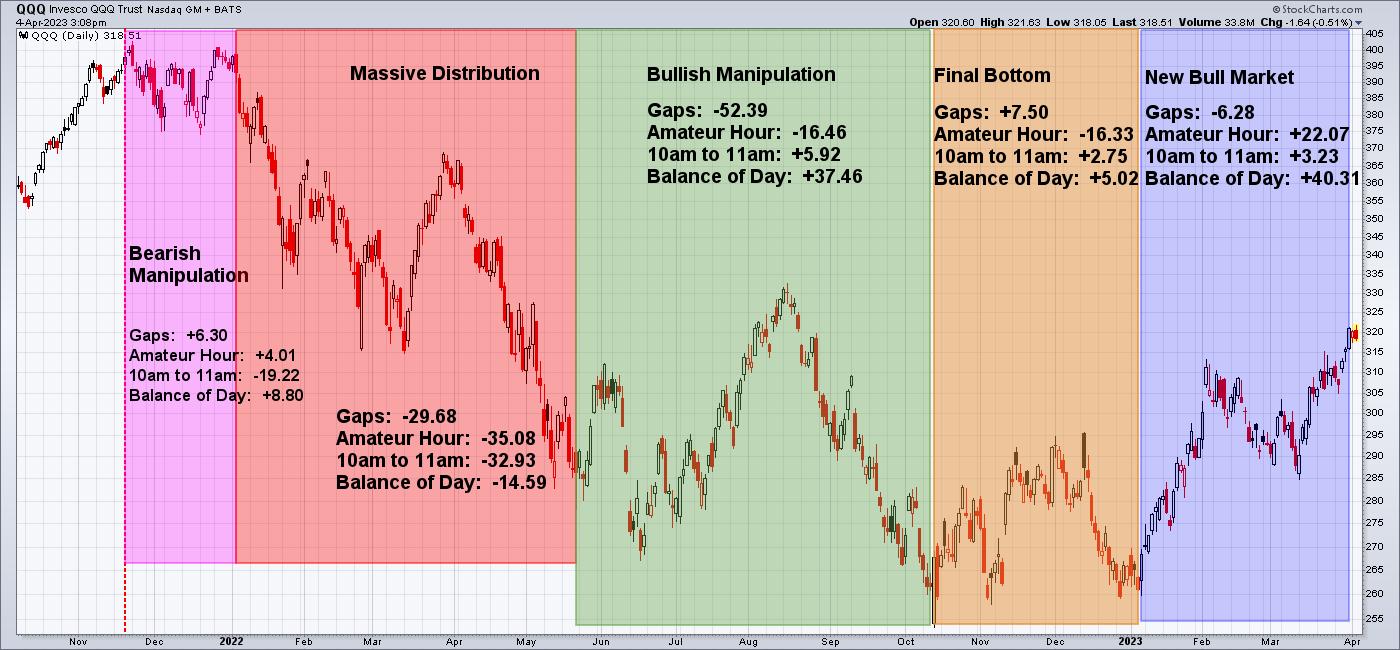
As the final high was set in late 2021, note that we saw gap ups and early morning buying. Then distribution took place as Wall Street began selling ahead of the masses. The next phase was PURE DISTRIBUTION - gap downs followed by intraday selling from open to close. Interestingly, the fear really picked up in the next phase, while the QQQ printed basically a double bottom. There was no further meaningful deterioration in the QQQ, yet there were crazy gap downs and early selling. Retail traders were reacting to the continuing bad news, while the afternoon buying showed Wall Street manipulating the masses, buying all the shares that retail traders panicked out of. In the final bottom phase during Q4 2022, retail traders continued to react to the news and sell in early trading. But once again, Wall Street awaited and bought throughout the balance of the day. We've now entered what I believe is the REAL DEAL, the renewal of the 10-year secular bull market that began in 2013. We will have pullbacks along the way, as we always do, but a series of higher highs and lows are very likely to print.
ChartLists/Strategies
My leveraged trading update: I sold 30% of my leverage this morning after we saw a failed breakout attempt on the QQQ:
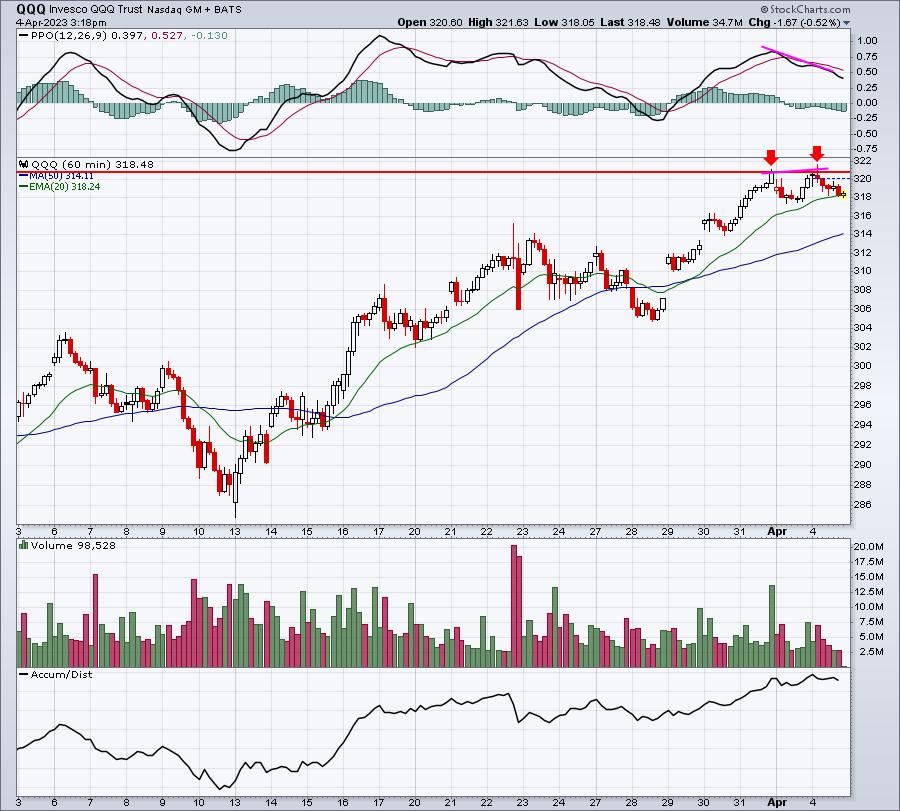
First, if I thought the odds were skewed heavily in favor of the bears right now, I'd move all of my leverage back to the QQQ. Keep in mind, when I sell my leveraged holdings, I take those proceeds and move back into the QQQ. I'm not interested in being in cash during the initial stages of what I believe is the next bull market rally. I'll likely sell another 30-40% of my leverage if the QQQ reaches the 325-326 level, and the final batch if the QQQ reaches or nears the August high. At that point, I would simply hang onto my QQQ until I believe a strong setup for leverage presents itself again.
I try not let greed get in the way. I have one goal with leverage - increase my returns for short-term periods OR take my medicine quickly if the market begins to move against me. To the downside, I'd probably raise my "acceptable level" on the QQQ to roughly 314 - last Thursday's low.
Earnings Reports
Here are the key earnings reports for the next two days, featuring stocks with market caps of more than $10 billion. I also include several companies with market caps below $10 billion. Finally, any portfolio stocks that will be reporting results are highlighted in BOLD. If you decide to hold a stock into earnings, please understand the significant short-term risk that you are taking. Please be sure to check for earnings dates for any companies you own or are considering owning.
Tuesday, April 4:
AYI, MSM
Wednesday, April 5:
CAG, SMPL, SLP, SCHN
Economic Reports
February factory orders: -0.7% (actual) vs. -0.4% (estimate)
Happy trading!
Tom