
EB Daily Market Report - Thursday, April 6, 2023
The Bulls-Eye Forecast
We have scheduled a new event for Saturday, April 15th. The event will begin at 10:00am ET and all EarningsBeats.com members will automatically be registered. There is no need for you to register individually. We will send out room instructions prior to the event.
We're holding this event as a sequel to our MarketVision 2023. I want to update everyone as to where we stand, take a look at bullish and bearish arguments and let the weight of the evidence determine where we're likely headed during the balance of Q2 and full year 2023.
Executive Market Summary
- Futures were lower heading into the open today
- After a bright red open, equities have reversed back to the upside, led by the NASDAQ
- Commodities are mixed again, but with crude oil ($WTIC, -0.35%) still hovering just above $80 per barrel
- The 10-year treasury yield ($TNX) is flat after initial jobless claims jumped significantly above estimates
- Communication services (XLC, +0.60%) and technology (XLK, +0.34%) have regained leadership roles
- Energy (XLE, -1.04%) and materials (XLB, -0.50%) are lagging thus far
- Internet ($DJUSNS, +1.89%) has moved above critical 2500 resistance and is currently at 2512; a breakout would be very bullish for this industry and for the market in general
- DISH Network (DISH, +5.33%) is today's top-performing S&P 500 stock, but it looks like a dead cat bounce to me - heavy volume has accompanied a 50% drop over the past 2 months
Market Outlook
Interest rates clearly play a factor in valuations. I know this from my days in public accounting and doing valuations. Lower interest rates benefit aggressive growth stocks as it makes their future earnings growth rates much more valuable. The NASDAQ 100 ($NDX) is more growth-oriented than the benchmark S&P 500 ($SPX) and this $NDX:$SPX ratio tends to move inversely to the 10-year treasury yield ($TNX) as you can see below:
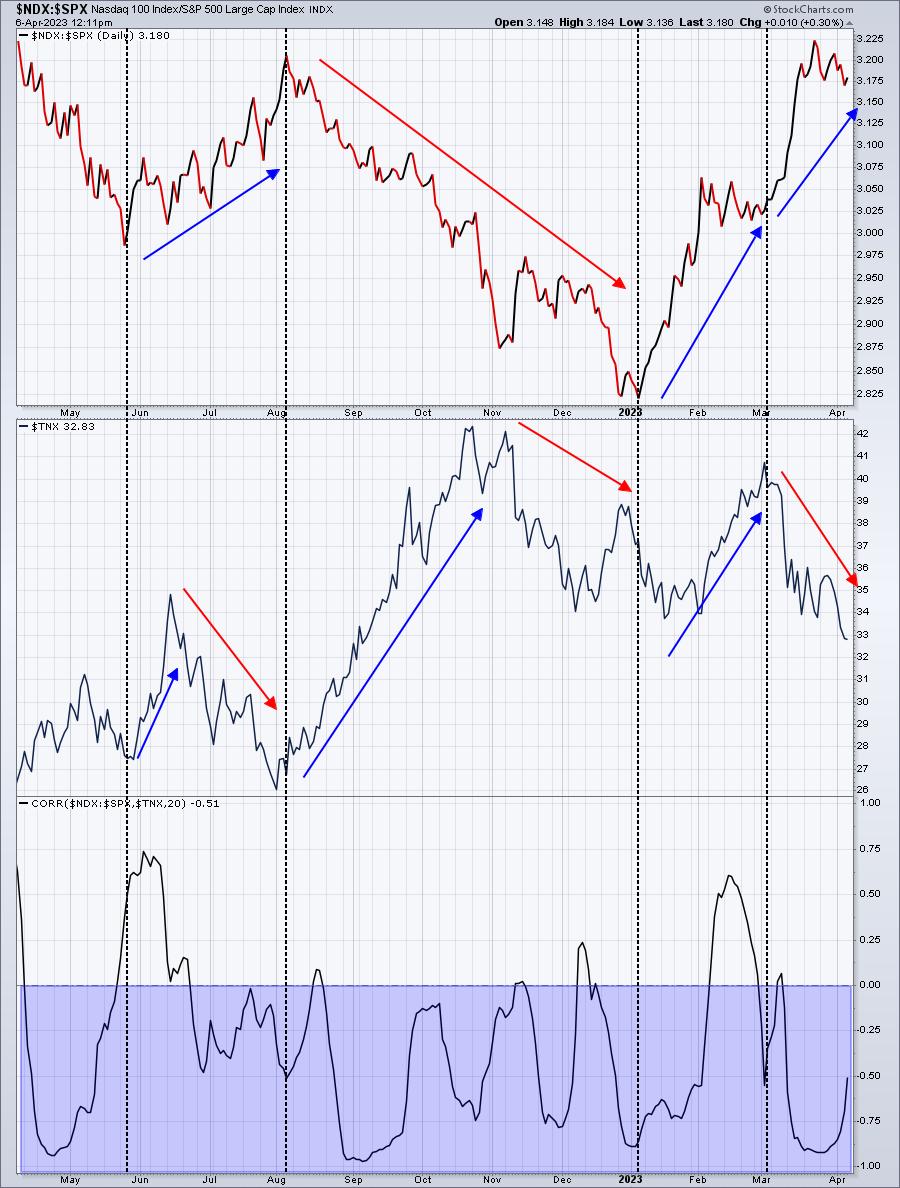
Listen, this isn't perfect inverse correlation, but the blue-shaded area shows us that there's absolutely a strong element of it. The direction of the $NDX:$SPX doesn't always move opposite of the $TNX, but it's clear to me that knowing the direction of interest rates tells me whether to focus on the $NDX (QQQ) or the $SPX (SPY).
Sector/Industry Focus
If you're wondering whether the 2023 rally is sustainable, one thing that I like to follow is "which sectors are leading the rally. Well, if we check out the Sector Summary over at StockCharts.com and we set the period to "YTD", this is what it looks like:
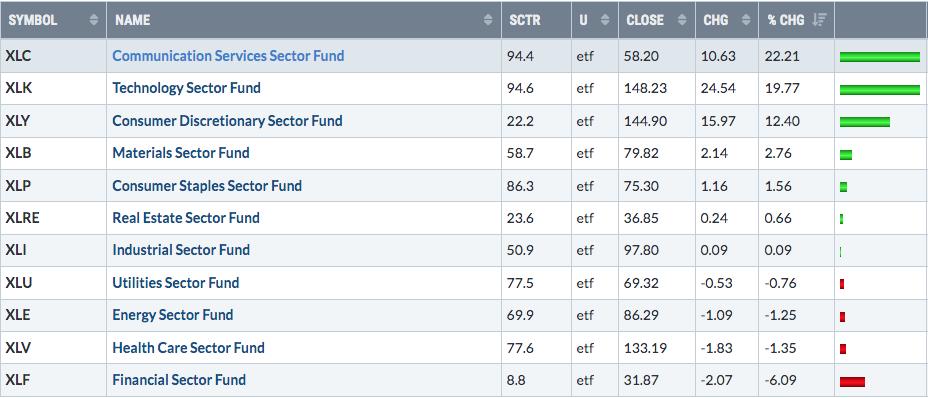
While we have seen other sectors lead the market higher periodically in 2023, is there any question which sectors are behind this rally? Those top 3 sectors - XLC, XLK, and XLY - are our three most aggressive sectors and they're exploding higher. That's great news for the bulls and one signal that certainly keeps on the bullish side.
ChartLists/Strategies
I ran our RSI 40-50 scan to see which stocks on our various ChartLists have solid reward-to-risk trading opportunities. Here are two that I really like from the scan results:
ACLS:
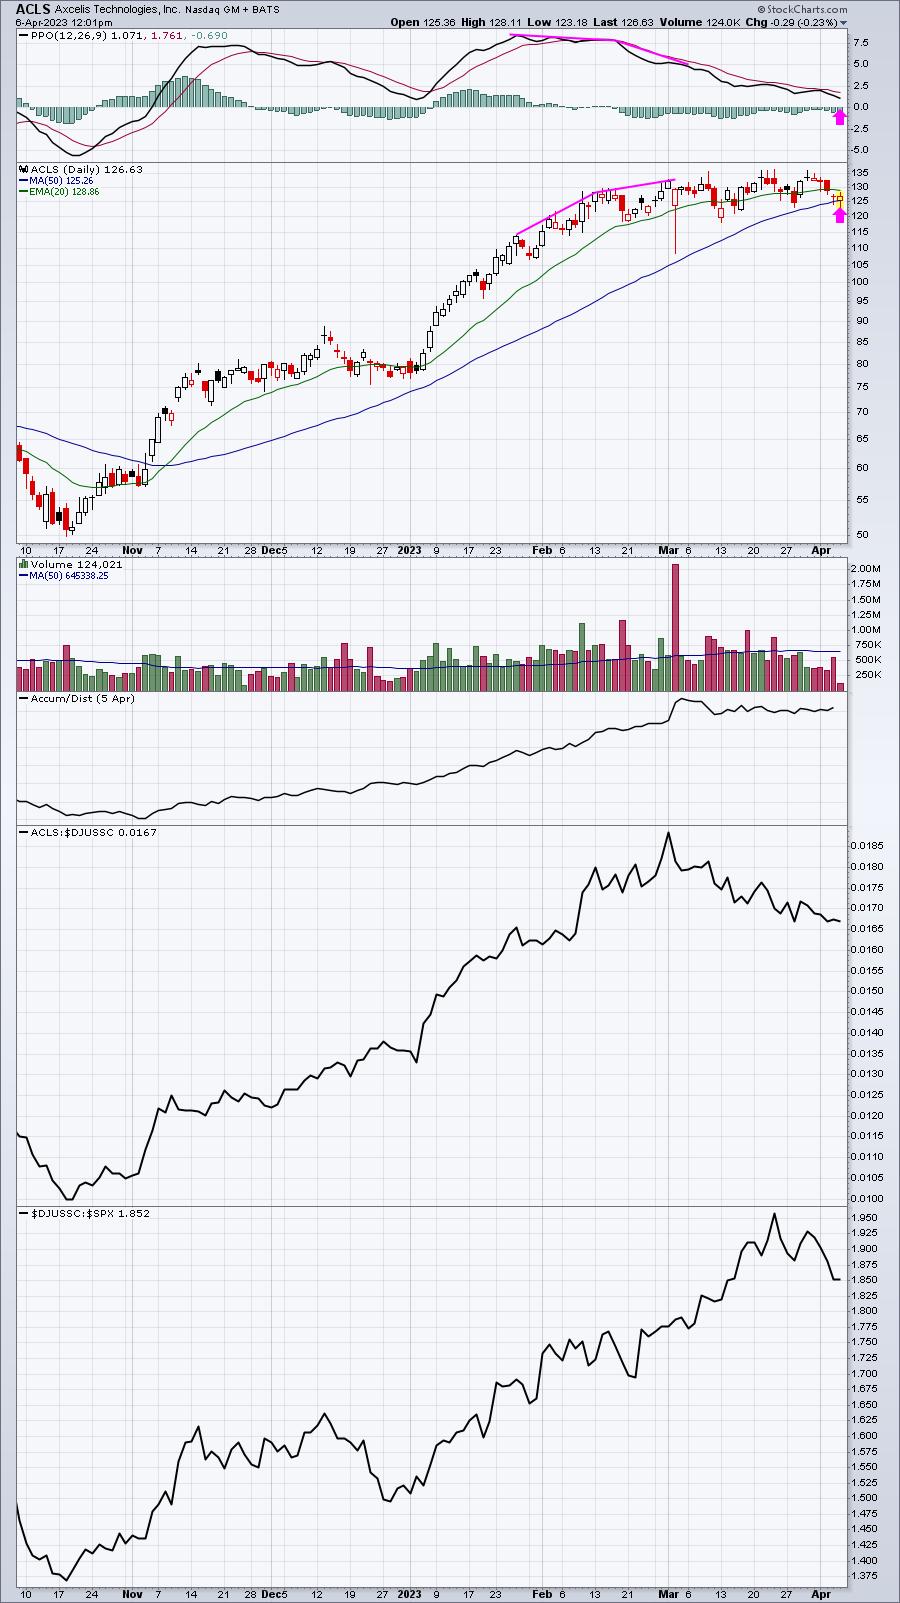
ACLS printed a negative divergence recently, which likely contributed to a period of sideways consolidation. But now that it's fallen to its 50-day SMA, I see an opportunity here.
TMDX:
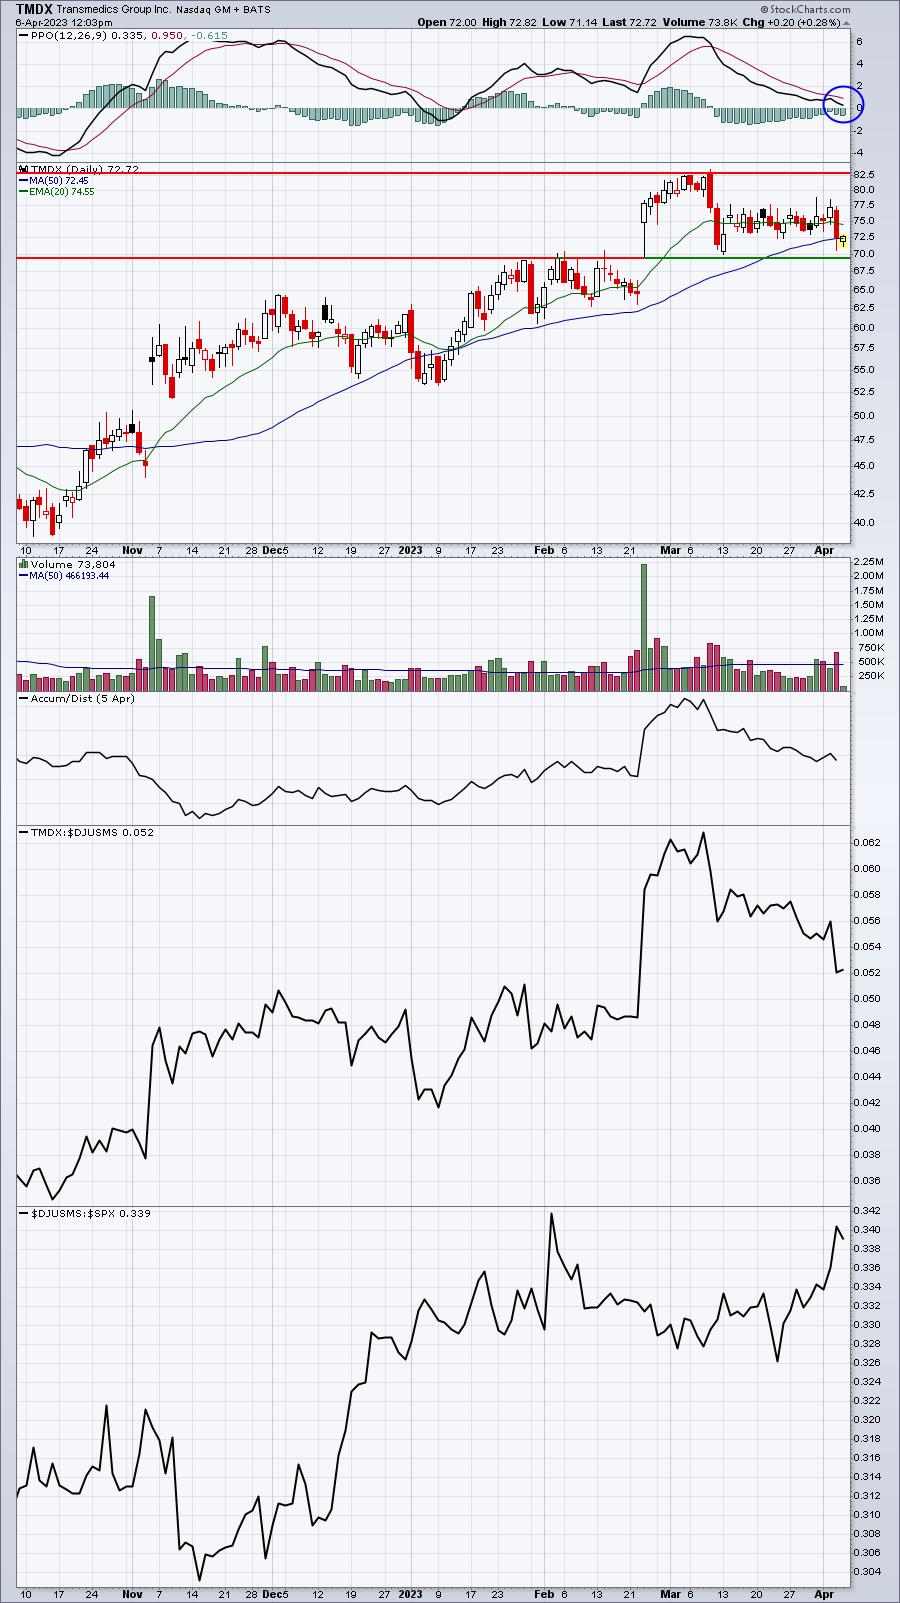
Health care (XLV) has really strengthened of late and here's a medical supplies ($DJUSMS) stock that's back near key support. It previously had gapped up with its earnings report on strong volume. I like it here.
Earnings Reports
Here are the key earnings reports for the next two days, featuring stocks with market caps of more than $10 billion. I also include several companies with market caps below $10 billion. Finally, any portfolio stocks that will be reporting results are highlighted in BOLD. If you decide to hold a stock into earnings, please understand the significant short-term risk that you are taking. Please be sure to check for earnings dates for any companies you own or are considering owning.
Thursday, April 6:
STZ, LW, RPM, LEVI, WDFC
Friday, April 7:
None
Economic Reports
Initial jobless claims: 228,000 (actual) vs. 201,000 (estimate)
Happy trading!
Tom