
EB Daily Market Report - Wednesday, April 12, 2023
The Bulls-Eye Forecast This Saturday!
Just a quick reminder that our special event will be held at 10:00am ET on Saturday. Hope you can join us! We will send out room instructions, so there's no need for EB.com members to register.
Executive Market Summary
- Futures shot higher this morning after the March CPI report was released
- The headline number was much better than expected, but the Core CPI matched expectations
- Cryptocurrencies are taking a break after their recent upside tear; bitcoin ($BTCUSD, -1.22%) is slightly below the psychological 30,000 level
- Commodities are mostly higher, especially crude oil ($WTIC, +2.15%), which may close above $83 per barrel for the first time since November
- The 10-year treasury yield ($TNX) is down 2 basis points to 3.41%
- Most sectors are lower, led by consumer discretionary (XLY, -1.41%) and communication services (XLC, -0.99%)
- Of the 3 sectors moving up, industrials (XLI, +0.27%) and energy (XLE, +0.13%) are leading
- The Dow Jones is performing better on a relative basis today as a few of the value stocks lead the way
- Remember recently when DISH Network (DISH, -9.42%) was the best performer on the S&P 500 after its recent collapse? Well, the downtrend has resumed as DISH leads the S&P 500 lower
Market Outlook
We've been trending higher, so I haven't had to spend too much time considering support levels in the short-term. I do believe that the 311-313 level on the QQQ is fairly significant support - in the short-term. Here's the visual:
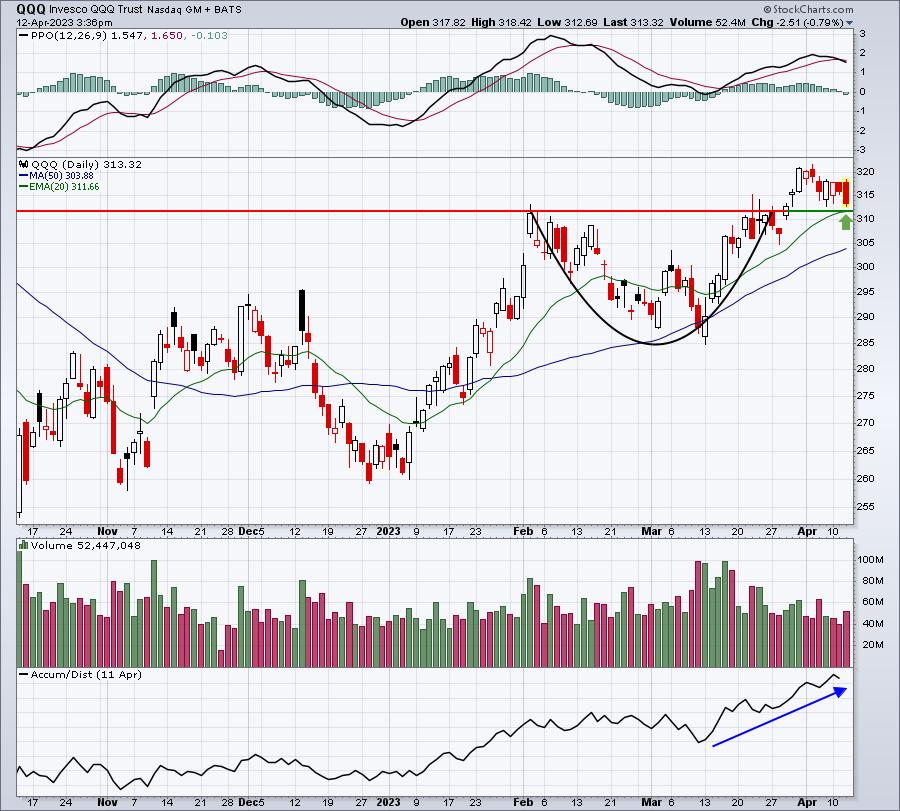
The breakout of the cup with handle occurred at approximately 311. Also, the 20-day EMA is currently at 311.66. Therefore, I'd look for this area to provide solid short-term support. If that fails, the next stop would be the 50-day SMA. Personally, I will use a 20-day EMA test to re-establish my leveraged position in the TQQQ.
Sector/Industry Focus
If you weren't able to listen to my TP Live show this morning, I discussed how I view bitcoin ($BTCUSD) as a "risk on" investment. So, in other words, when bitcoin is rising, it's a positive or bullish signal for U.S. equities. Here's a 5-year weekly chart that supports this theory:
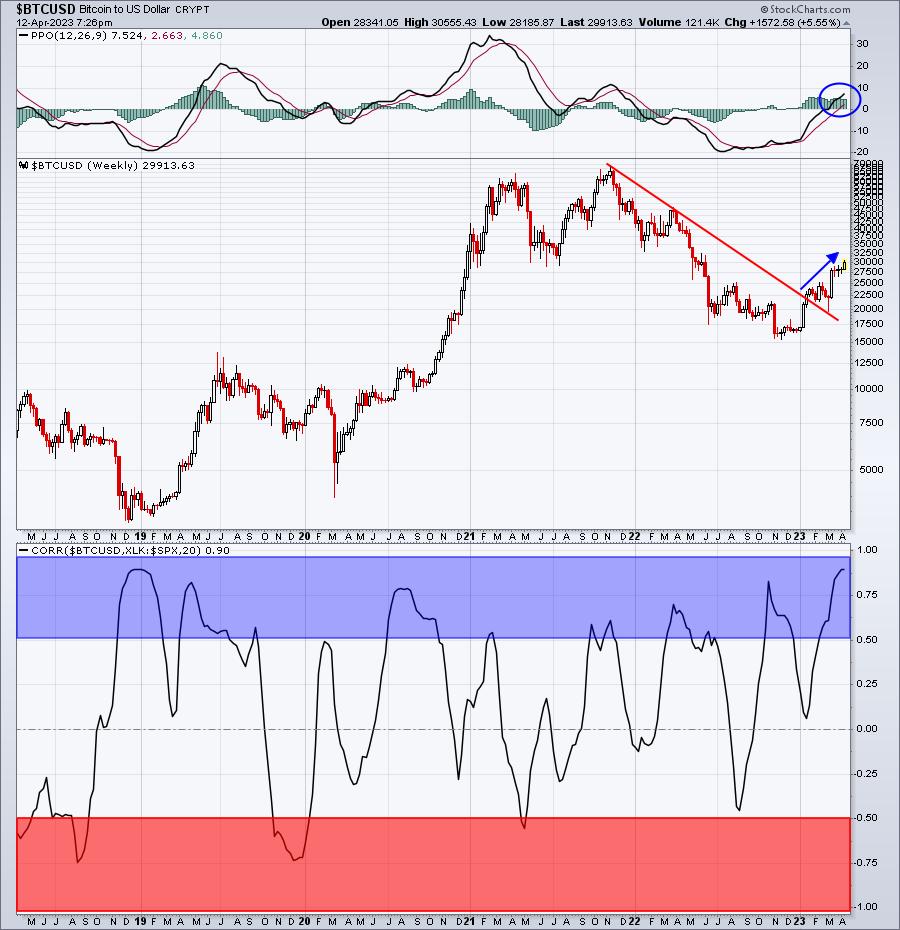
The blue-shaded area highlights positive correlation. The fact that there have been so many trips above 0.50 tells us that these two (bitcoin and technology relative strength) are positively correlated. Meanwhile, check out how often correlation stretches into the red-shaded area below 0.50 - 3 times in 5 years.
ChartLists/Strategies
We've seen some afternoon selling the past two days, so it probably makes sense to see a bit of strength before pulling the string on individual stock trades.
Let's revisit trading candidates on Thursday. I will say that there are currently 18 stocks on our key ChartLists (SECL, SFECL, SADCL, RGCL) that have seen higher highs print for at least 5 consecutive days. Therefore, if we see a reversal tomorrow or Friday, these are stocks that could rebound strongly. Here they are, in SCTR order (highest to lowest):
MGNX, EVER, EDU, WDAY, TW, SSYS, BOWL, KDNY, BIDU, ENR, ADEA, STGW, BTU, ATHM, WPC, TRIP, AMZN, XPER (no SCTR score for XPER)
Earnings Reports
Here are the key earnings reports for the next two days, featuring stocks with market caps of more than $10 billion. I also include several companies with market caps below $10 billion. Finally, any portfolio stocks that will be reporting results are highlighted in BOLD. If you decide to hold a stock into earnings, please understand the significant short-term risk that you are taking. Please be sure to check for earnings dates for any companies you own or are considering owning.
Wednesday, April 12:
INFY
Thursday, April 13:
PGR, FAST, DAL, FIZZ
Economic Reports
March CPI: +0.1% (actual) vs. +0.3% (estimate)
March Core CPI: +0.4% (actual) vs. +0.4% (estimate)
FOMC minutes released at 2:00pm ET
Happy trading!
Tom