
EB Daily Market Report - Friday, April 14, 2023
The Bulls-Eye Forecast Tomorrow Morning!
We're hosting our "Bull's-Eye Forecast: Outsmart Market Manipulation for More Profitable Trades in Q2 & Beyond" webinar tomorrow beginning at 10am ET. Join us for a session filled with insight, strategy, and more. It will be recorded for those unable to attend live. If you haven't already registered, we will register you this afternoon. You will receive a Zoom-generated email with your own unique link to access the room; you must use this link to access the session tomorrow. We will not have a room link posted on our site. If you do not receive an email by tomorrow, or otherwise have questions, please send an email to "[email protected]" and a member of our team will assist you.
We anticipate having a large audience of folks unfamiliar with me or EarningsBeats.com. Therefore, there will be plenty of charts that EB.com members have seen before that will be necessary to share. They will serve as a nice refresher, especially considering that they will be up-to-date (through today) with current price information.
I hope to see you tomorrow morning!
Executive Market Summary
- Futures were lower overnight and our major indices gapped down to start the session
- There was an early recovery, however, led by the Dow Jones and large banks
- JP Morgan (JPM, +7.17%) reported better-than-expected quarterly results and is helping the Dow Jones digest and offset the big losses in Boeing (BA, -5.75%) and Unitedhealth Group (UNH, -2.76%)
- UNH is lower, despite beating Wall Street estimates as to quarterly revenues and EPS
- Etherium ($ETHUSD, +3.31%) is having a nice day after clearing important overhead resistance at 2000
- March retail sales came in well below expectations and the widely-diversified S&P Retail ETF (XRT) sold off hard after very early gains this morning
- Commodities are mixed as gold ($GOLD, -1.75%) falls back near $2000 per ounce
- The 10-year treasury yield ($TNX) is up 7 basis points and slightly above its 20-day EMA, suggesting potential upside ahead
- Financials (XLF, +0.88%) is the only sector in positive territory; defensive sectors are lagging today
- Banks ($DJUSBK, +2.92%) have kicked off earnings season in grand style, but keep in mind that many of their relative leaders reported today - things could turn lower next week as more banks report
Market Outlook
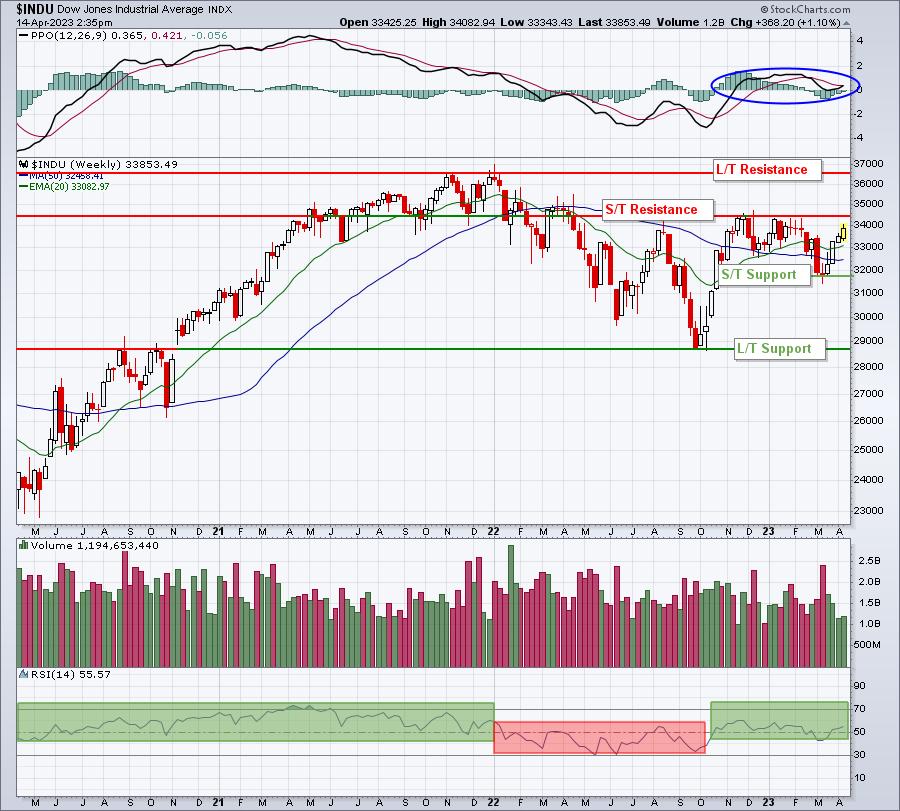
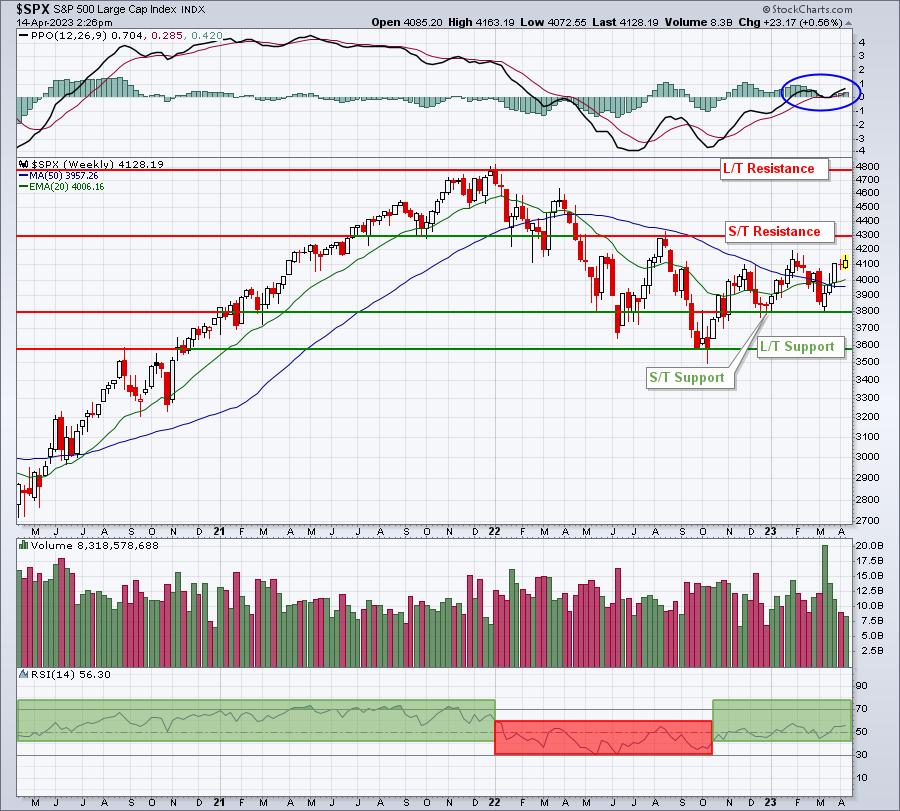
Here's a quick glance at the long-term weekly charts for each of our major indices:
Dow Jones:
S&P 500:
NASDAQ 100:
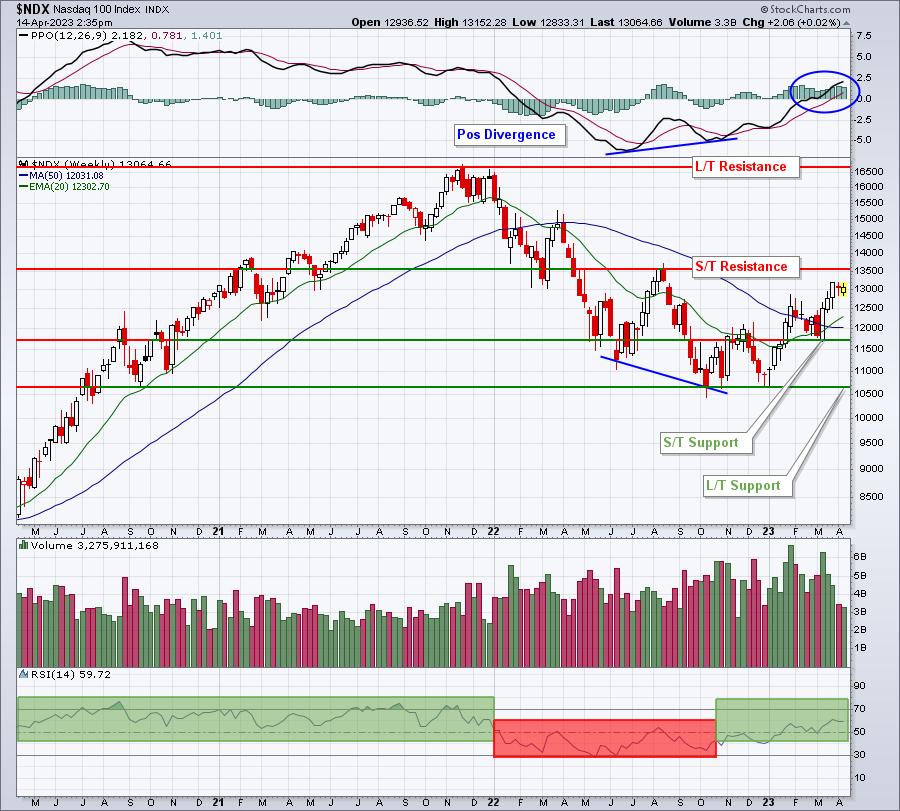
I've laid out what I'm looking at as price support and resistance. For the RSI in the bottom panels, during uptrends, the RSI typically bottoms around 40-50 (green-shaded areas) and during downtrends typically tops from 50-60 (red-shaded areas). We have yet to clear RSI 60, so some might consider us still in a downtrend. Technically, we are. However, I've seen enough bullish signals to have called bottoms in June and September 2022. Therefore, I'm viewing the 2023 advance as a resumption of the secular bull market. That's why I show the RSI green shaded.
Sector/Industry Focus
I pointed out the recent absolute and relative strength of health care (XLV), but that was on a more near-term basis (daily chart). Today, I want to show you the longer-term weekly chart as the XLV is reaching a fairly important cross road:
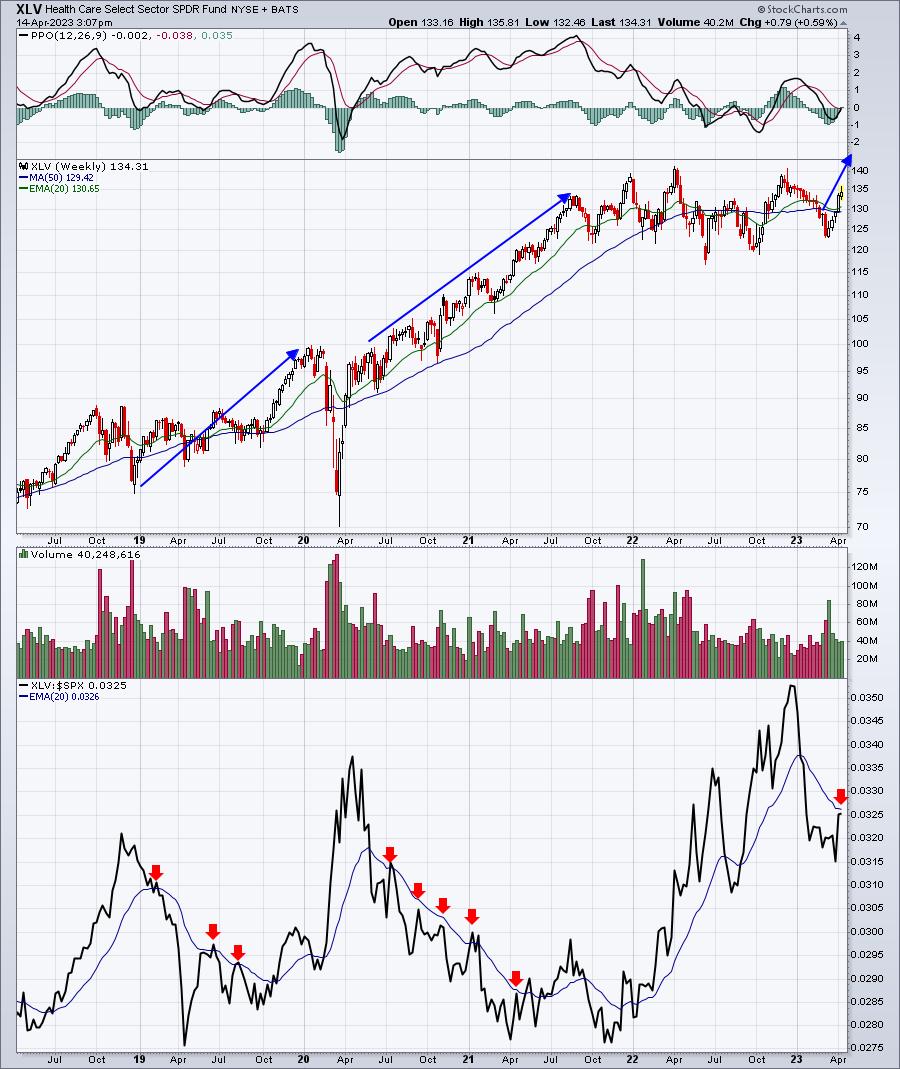
Health care moves higher during secular bull market advances, BUT its relative strength tends to fall. That's what the red arrows in the bottom panel are pointing out. Note where we are on the relative chart right now. We look to be turning down from a relative 20-week EMA test. Should the stock market continue moving higher, as I believe it will, I'd expect the XLV to participate on an absolute basis, but underperform on a relative basis - similar to what we've seen in prior secular bull market advances.
ChartLists/Strategies
Let's revisit trading strategies and individual stocks next week. Personally, I'm beginning to trade more individual stocks (though the majority of my portfolio remains in the QQQ), but it remains quite treacherous to do so. I've done much better trading the QQQ and its related leveraged products (QLD/TQQQ) and avoiding the temptation to trade individual stocks. I do not consider shorting stocks or ETFs when I believe a bottom is in. Instead, I focus on bull market rules, which, for me, means longs only.
Earnings Reports
Here are the key earnings reports for the next two days, featuring stocks with market caps of more than $10 billion. I also include several companies with market caps below $10 billion. Finally, any portfolio stocks that will be reporting results are highlighted in BOLD. If you decide to hold a stock into earnings, please understand the significant short-term risk that you are taking. Please be sure to check for earnings dates for any companies you own or are considering owning.
Friday, April 14:
UNH, JPM, WFC, BLK, C, PNC
Monday, April 17:
SCHW, STT, MTB, JBHT, ELS
Economic Reports
March retail sales: -1.0% (actual) vs. -0.4% (estimate)
March retail sales less autos: -0.8% (actual) vs. -0.4% (estimate)
March industrial production: +0.4% (actual) vs. +0.3% (estimate)
March capacity utilization: 79.8% (actual) vs. 78.8% (estimate)
February business inventories: +0.2% (actual) vs. +0.3% (estimate)
April consumer sentiment: 63.5 (actual) vs. 62.7 (estimate)
Happy trading!
Tom