
EB Daily Market Report - Tuesday, April 18, 2023
April Max Pain Event Today!
We're hosting one of our favorite monthly events - April Max Pain - at 5:00pm ET this afternoon. We'll provide our short-term outlook based on where current prices stand relative to max pain levels. We often refer to options-expiration week as Opposite George (week), because of its potential impact on advancing and declining stocks, ETFs, major indices, etc.
I hope you can join us later today!
ChartList Update
We've updated a number of our key ChartLists as follows:
- Strong Earnings (SECL)
- Strong Future Earnings (SFECL)
- Raised Guidance (RGCL)
- Bullish Trifecta (BTCL)
- Short Squeeze (SSCL)
Our website has been updated, so you can now visit and either view or download these ChartLists. I typically change all earnings dates on RGCL stocks, which I did this time as well. That's particularly important, because as many as 25% saw their estimated earnings dates change. If you rely on earnings report dates on the RGCL, then you should absolutely view/download this ChartList.
Executive Market Summary
- Futures strengthened overnight and opened higher, especially on the NASDAQ
- Johnson & Johnson (JNJ, -2.82%) and Goldman Sachs (GS, -1.05%) are weighing on the Dow Jones after each reported their latest quarterly results before today's opening bell
- The Volatility Index ($VIX, -1.47%) has fallen to 16.70, a level that has suggested bear markets have ended in the past
- The 10-year treasury yield ($TNX) is down one basis point to 3.58%
- Most commodities are up fractionally, led by crude oil ($WTIC, +0.28%) and gold ($GOLD, +0.63%)
- Sectors are nearly evenly split with 6 higher and 5 lower; energy (XLE, +0.59%) is providing leadership, while health care (XLV, -0.65%) lags
- NVIDIA Corp (NVDA, +3.12%) is leading semiconductors ($DJUSSC, +0.84%) higher today, but is testing key overhead price resistance with a negative divergence - be careful with this one, especially is it closes weak today
Market Outlook
I want to start with a headline and a few bullet points that I saw on CNBC.com this morning. Check this out:

Now the key bullet points.....
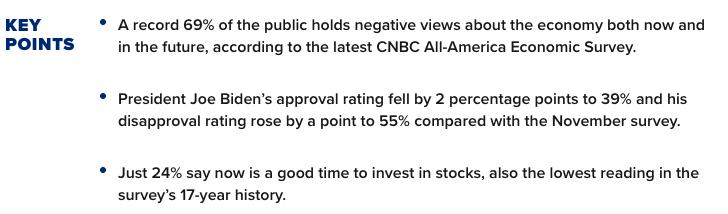
Check out that last bullet point. Only 24% of survey respondents thought this is a good time to invest in stocks - the LOWEST in the survey's 17-year history. Do you recall when I discussed the importance of sentiment "resetting"? I said it was the biggest problem the stock market faced as we entered 2022. It was a big reason why I suggested we could see the S&P 500 tumble to 3500 in a "worst-case scenario". Well, we hit 3491 at the low and NOW the public thinks the stock market has no chance.
Perfect!
The equity-only put-call ratio ($CPCE) is the sentiment indicator that I love in order to get a pulse from retail traders. Interestingly, when I called the market bottom in June 2022 when the S&P 500 was in the 3650 range, retail traders had just begun to grow fearful. Unfortunately, they ALWAYS react after the fact. Here is the S&P 500 decline throughout 2022. Note that the 5-day SMA of the CPCE didn't hit our key .80 level until after the entire decline was felt:
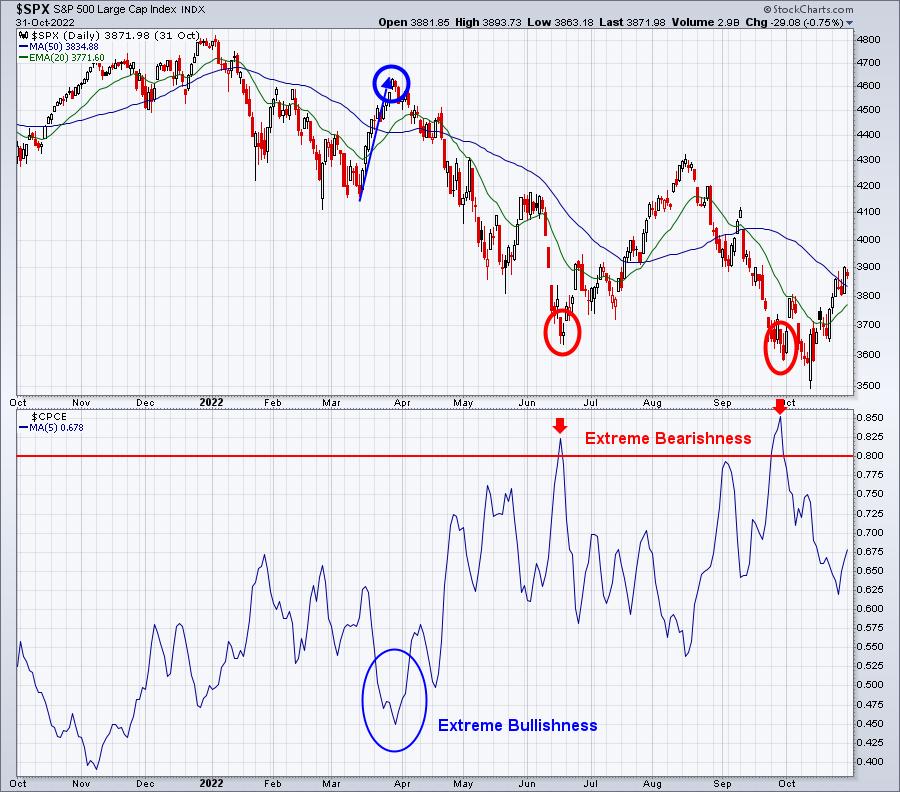
Every significant bottom this century has occurred with a 5-day CPCE reaching at least .75, with most occurring at or above .80. Once we reached that level, I knew most, if not all, of the bad news was priced into the chart. It's amazing, however, that the S&P 500 has to drop 28% and the NASDAQ nearly 40%, before retail traders get bearish. Since they reached that panicked state, the S&P 500 has been on the rise.
And yet, as you can see from the survey information above, investors hold out little hope that the stock market will rise from here. You know what? That's probably the biggest reason why it'll do just that.
Sector/Industry Focus
This afternoon's finish could be quite influential in the short-term. On the QQQ (ETF that tracks the NASDAQ 100), there was a gap up today that cleared prior resistance. Generally, that means one of two things. Either (1), we see follow-through to the upside or (2), a potential top. Given options expiring this week and max pain suggesting lower prices in the near-term, we should be extra cautious if the QQQ finishes weak today. Of course, there are always earnings considerations and Netflix (NFLX) reports its latest quarterly results after the bell. In any event, here is the QQQ chart showing the earlier clearance of resistance:
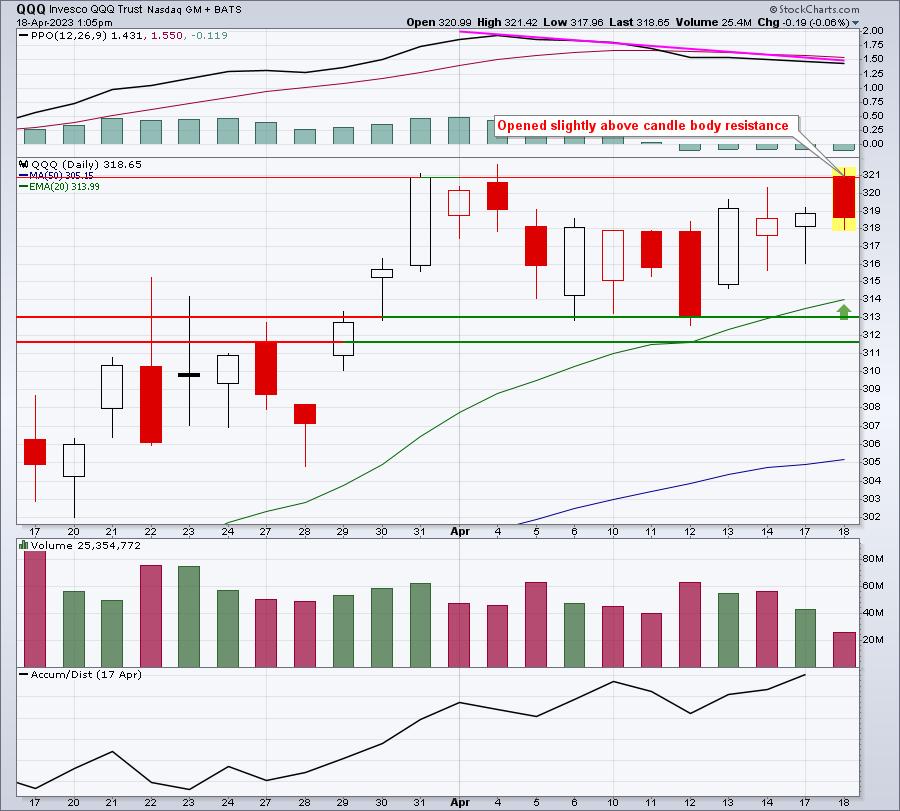
There's a slight negative divergence as we attempt to clear price resistance. That's another technical factor that could drive prices lower later this week.
I remain quite bullish further down the road. Anything I've mentioned above is a short-term consideration only. I do not own any leveraged products, because of the current added risk.
ChartLists/Strategies
Since it's options-expiration week, I'd try to avoid trading many of the aggressive growth stocks on the long side, especially those that have had nice advances over the past month or so. They could be in jeopardy of market maker manipulation in an attempt to reduce net call premium on that particular stock by Friday - or even early next week.
Instead, I'd look to stocks that could benefit from such manipulation. LEVI is one that I like and have taken a small position in since it's bouncing off key price support:
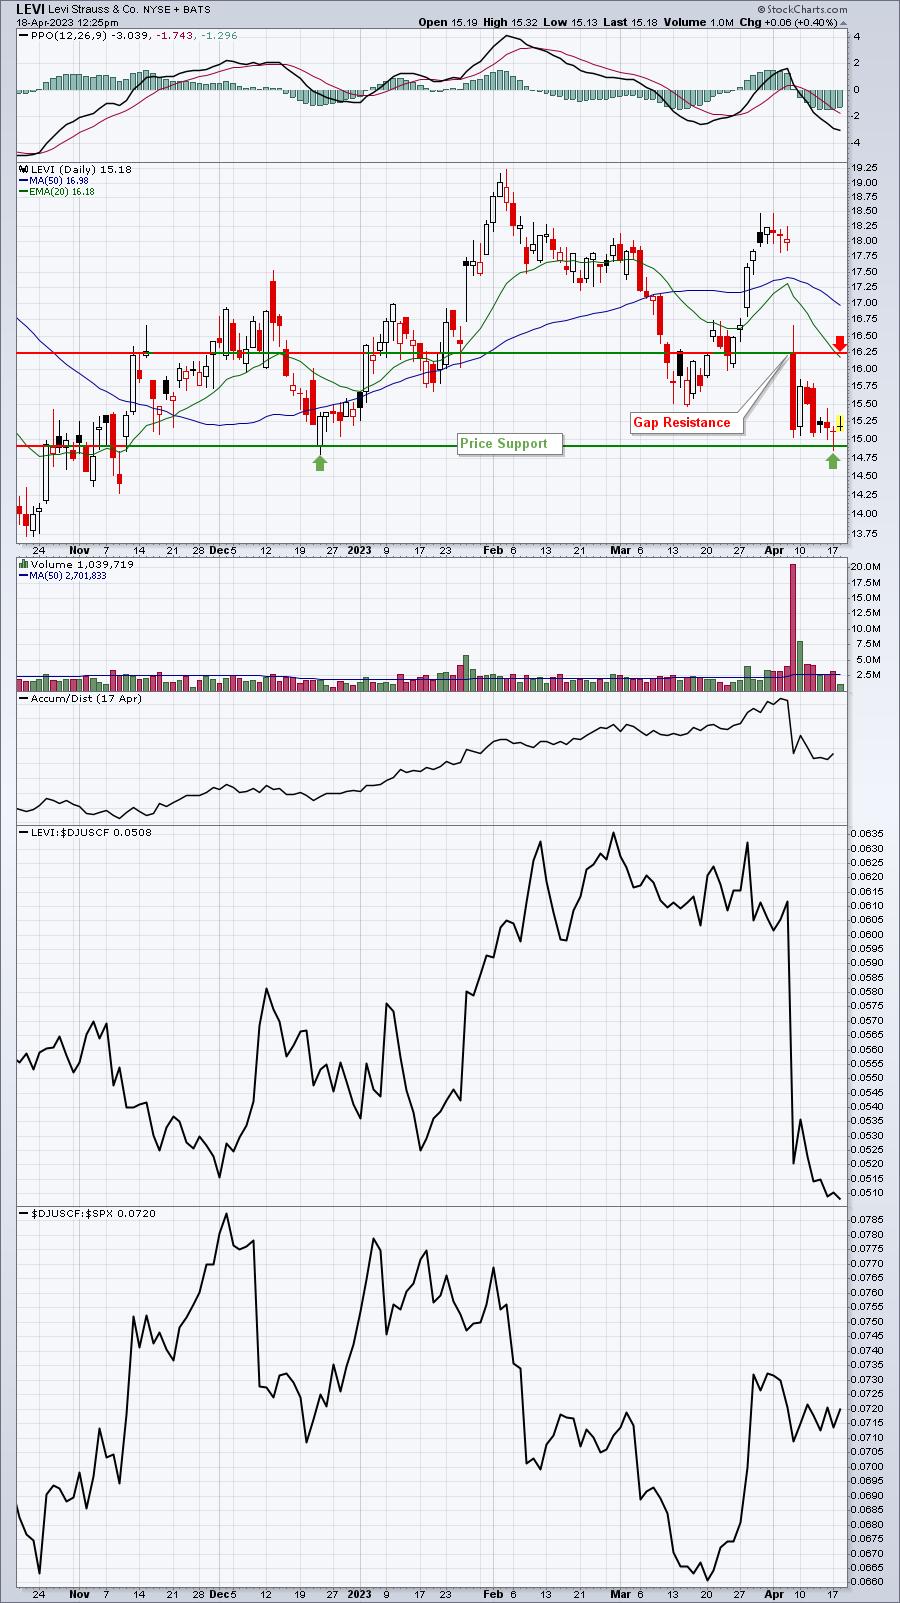
LEVI has almost no calls below 15.00 right now, and has a max pain level closer to 16. There are also 6590 puts at 15.00, which would add to the net in-the-money put premium if LEVI drops beneath 15.00. That doesn't guarantee us that LEVI is heading to 16.00, but at least I know the stock doesn't have options-related downward pressure this week. It's also worth noting that LEVI was added to our Raised Guidance ChartList (RGCL) this morning as it recently raised its guidance.
Earnings Reports
Here are the key earnings reports for the next two days, featuring stocks with market caps of more than $10 billion. I also include several companies with market caps below $10 billion. Finally, any portfolio stocks that will be reporting results are highlighted in BOLD. If you decide to hold a stock into earnings, please understand the significant short-term risk that you are taking. Please be sure to check for earnings dates for any companies you own or are considering owning.
Tuesday, April 18:
JNJ, BAC, NFLX, LMT, GS, PLD, ISRG, BK, IBKR, ERIC, OMC, UAL, CBSH, WAL, HWC, MRTN
Wednesday, April 19:
TSLA, ASML, ABT, MS, IBM, ELV, LRCX, CCI, USB, LVS, KMI, TRV, BKR, NDAQ, DFS, EFX, STLD, CFG, SYF, REXR, FFIV, ALLY, AA, FR, EDU, LAD, RLI, ZION, CALX, LBRT, SLG, MCRI
Economic Reports
March housing starts: 1,420,000 (actual) vs. 1,400,000 (estimate)
March building permits: 1,413,000 (actual) vs. 1,441,000 (estimate)
Happy trading!
Tom