
EB Daily Market Report - Tuesday, April 25, 2023
Guest Hosting The Final Bar
I hosted The Final Bar yesterday, subbing for David Keller, who normally hosts StockCharts TV's flagship show. The show airs from 4:00pm-4:30pm Monday through Friday. I will continue to guest host the show through Thursday. The following guests will join me:
- Tuesday guest, Bruce Fraser
- Wednesday guest, Arthur Hill
- Thursday guest, Erin Swenlin
All 3 guests are great friends of mine and fellow commentators at StockCharts.com. I'm really looking forward to chatting with them and seeing where they stand in this current market environment.
Plan to join me for these 3 upcoming shows, if you can!
Executive Market Summary
- Futures were lower overnight and our major indices all gapped down
- Weakness has continued through the timing of this DMR, with a few key problems arising to be aware of
- The NASDAQ 100 ($NDX, -1.04%) gapped beneath its 20-day EMA for the first time in 5 weeks; barring an afternoon recovery, this would be a short-term technical violation
- This could still be the effects of April max pain as well as this monthly phenomenon suggested lower prices ahead on a short-term basis
- The real test, in my opinion, will be what happens when key leaders in technology (XLK, -1.44%), consumer discretionary (XLY, -0.93%), and communication services (XLC, -0.52%) report quarterly results
- Microsoft (MSFT, -1.34%) is set to report its latest results after the closing bell, as is Alphabet (GOOGL, -0.03%); MSFT has performed much better heading into earnings relative to its peers
- Money has clearly rotated to more defensive-oriented areas today as consumer staples (XLP, +0.35%) and utilities (XLU, +0.33%) are the only two sectors in positive territory
- Falling crude oil prices ($WTIC, -2.12%) are weighing on the energy sector (XLE, -1.77%), today's lagging sector
- First Republic Bank (FRC, -28.50%) is tumbling after reporting that customer deposits had fallen much more than previously expected
Market Outlook
U.S. equity prices have been drifting lower for the past week to ten days, but it wasn't unexpected. We knew there was plenty of net in-the-money call premium on the table heading into April monthly options expiration and we also knew that history was not on the side of the bulls as we negotiated a calendar period that's typically rough. The 19th to 25th period of every calendar month has produced very bearish annualized returns - approximately 17 percentage points below the normal annual return of 9% since 1950. But bullish historical news is approaching. First, the BEST calendar period for stocks is the 26th close through the 6th close the following month. Today is April 25th, so the bullish period is rapidly approaching.
Specifically to April, a very bullish period begins at the close this Friday, April 28th. April 29th through May 5th has produced annualized returns of +26.87% since 1950. That's 3 times as bullish as that normal 9% average annual rate. The S&P 500 doesn't go up every year during this period, but the odds are much greater of positive action. It could be just what the market needs to send prices higher to challenge the August 2022 highs. We'll find out.
Sector/Industry Focus
Last Friday, I showed how I believe the communication services sector (XLC) has been manipulated via gap downs, which were followed by more accumulation. There's a very bullish development on the XLC on the hourly chart. Check this out:
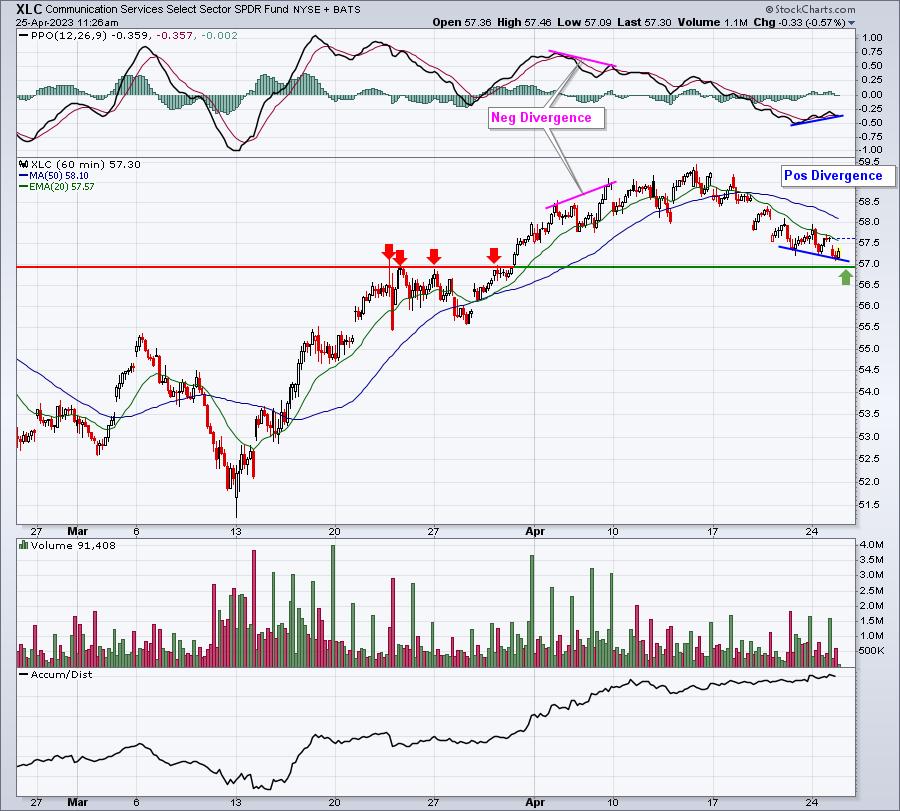
Those gaps were successful in lowering the net in-the-money call premium for market makers last week. As we continue to move lower this week, however, momentum appears to be slowing as a positive divergence has formed. The negative divergence earlier this month slowed this group as buying momentum waned. Now the opposite signal is being given. Once again, this provides us no guarantees of a quick recovery and more bullish action ahead. However, if I'm being objective and honest about risk evaluation, I'd say that more and more signals point to being long right now, not short.
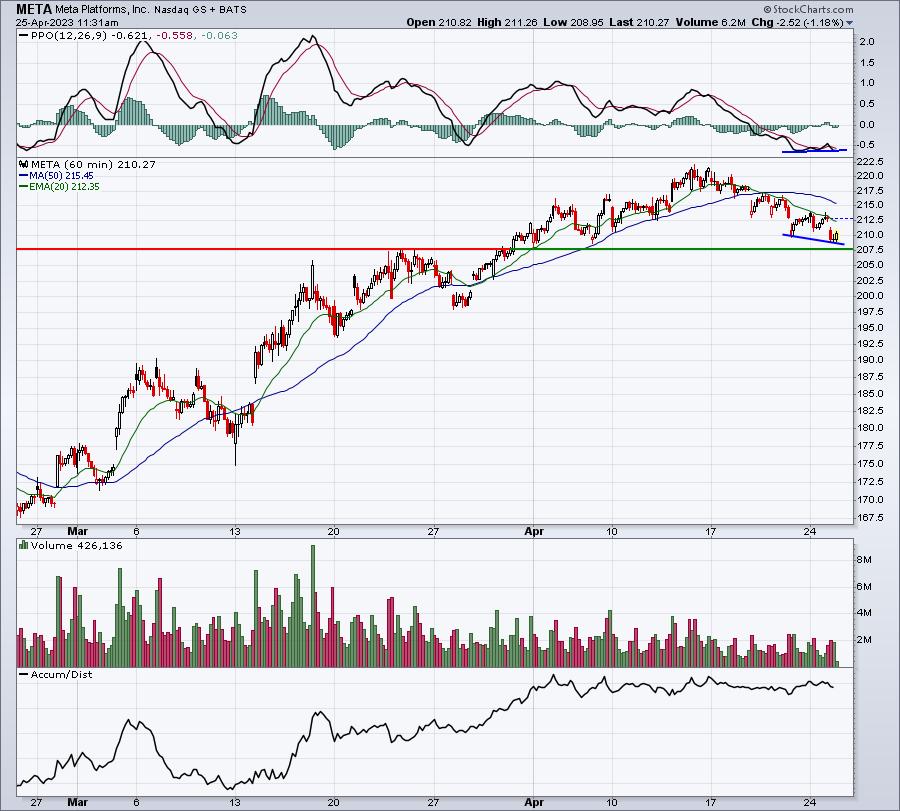
For what it's worth, Meta Platforms (META) is also showing that same hourly positive divergence, but just remember that earnings will be released tomorrow after the closing bell:
ChartLists/Strategies
This is the time of the quarter - after earnings have begun to be released - when I can begin to look for solid earnings-related trades. Here are two examples:
CDNS:
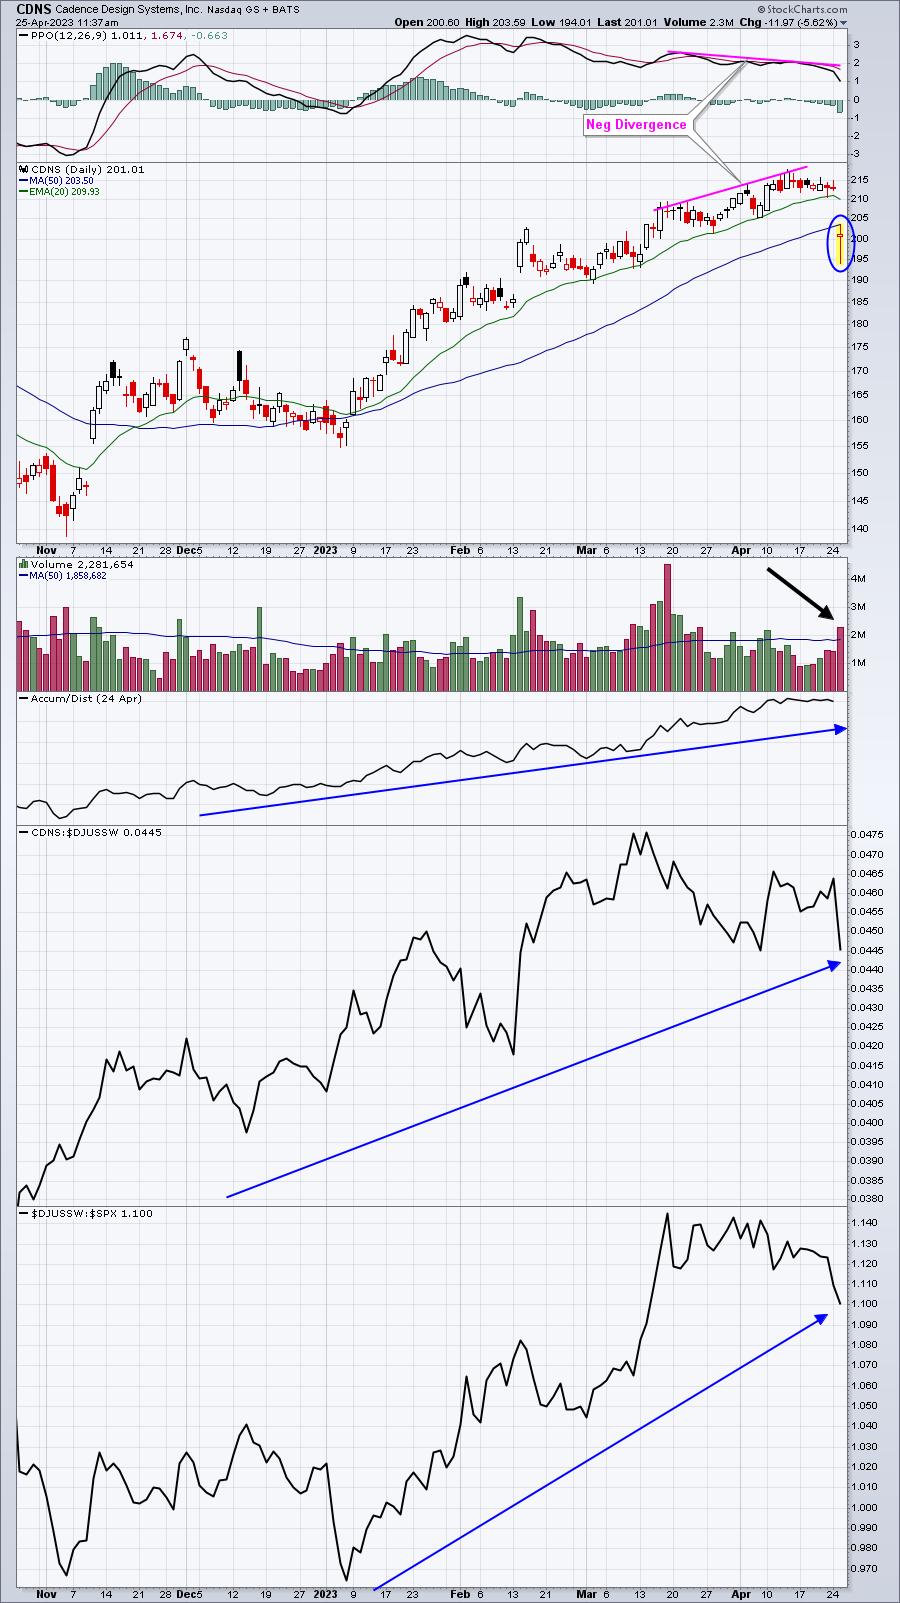
CDNS showed strong leadership in software ($DJUSSW), a very strong AD line that suggests accumulation or strong afternoon finishes, and a negative divergence that warned of a potential 50-day SMA test and PPO centerline reset. CDNS reported revenues and EPS that easily surpassed consensus estimates. In my opinion, this looks like a perfect example of "buy on rumor, sell on news". I'd argue that we've seen serious Wall Street accumulation of CDNS heading into earnings, but the negative divergence suggested that upside momentum was weakening. While the gap below the 50-day SMA is a bit worrisome, I'm less worried after seeing that today's low tested the key rising 20-day EMA on the longer-term weekly chart:
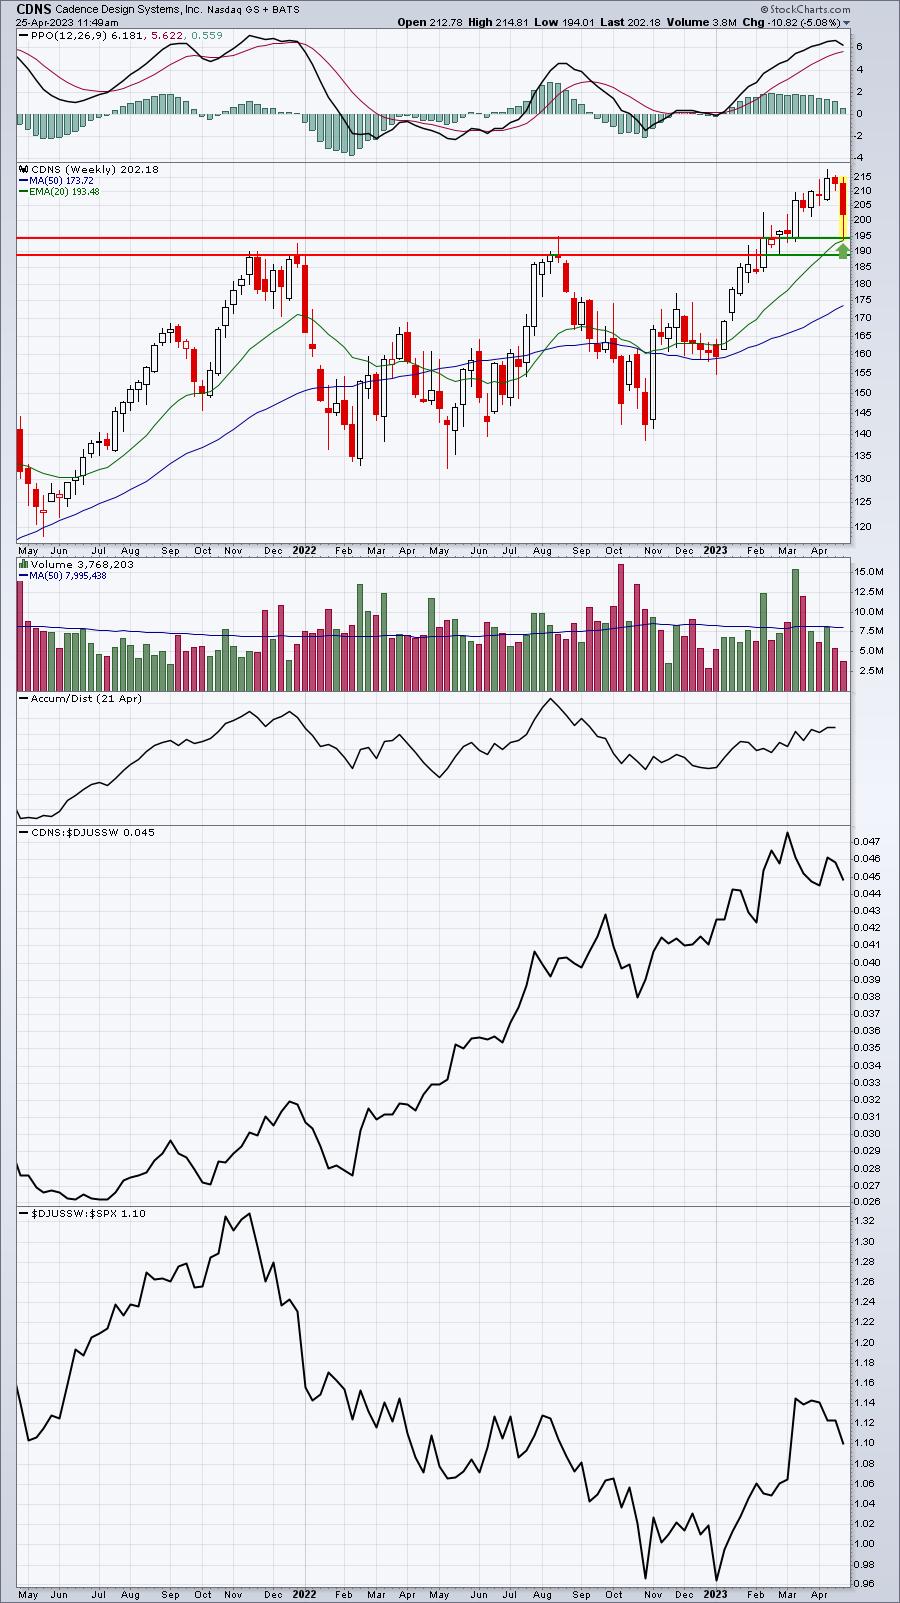
I bought CDNS in after hours yesterday, and added this morning on early weakness. The AD line will surge on today's volume if CDNS closes today at or near its intraday high. This is designed to be a short-term trade only.
CSX:
CSX is in the not-so-great railroad group ($DJUSRR), but it was a clear leader heading into its earnings report. After producing excellent and better-than-expected results, CSX gapped higher. Today, it returned to gap support, where I bought:
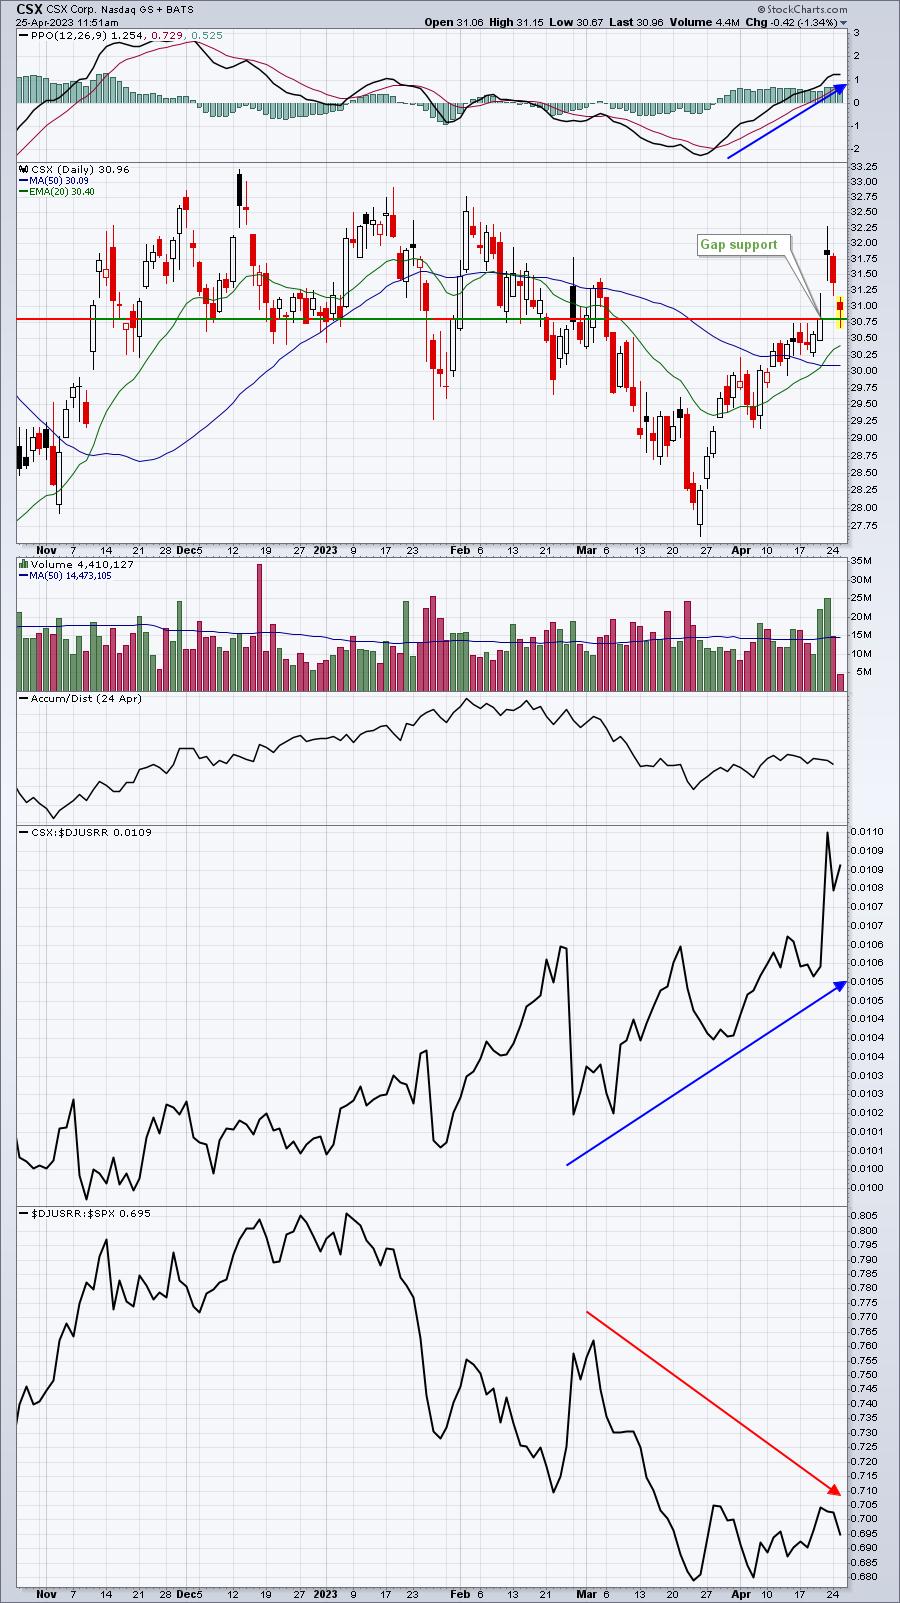
I like a lot of what I see on the chart, but there are two clear negatives as well. First, the railroads are obviously not in favor right now and, second, the CSX AD line is not nearly as strong as I'd like. This latter issue makes me a bit more uncomfortable as to how CSX might close. For that reason, I could sell into intraday strength at any point. And there's no way I'd hold CSX if it doesn't continue to close above gap support at 30.81.
Earnings Reports
Here are the key earnings reports for the next two days, featuring stocks with market caps of more than $10 billion. I also include several companies with market caps below $10 billion. Finally, any portfolio stocks that will be reporting results are highlighted in BOLD. If you decide to hold a stock into earnings, please understand the significant short-term risk that you are taking. Please be sure to check for earnings dates for any companies you own or are considering owning.
Tuesday, April 25:
MSFT, GOOGL, V, PEP, MCD, NVS, DHR, UPS, TXN, NEE, VZ, RTX, HSBC, GE, CB, FISV, UBS, ABB, AMX, SHW, MMM, MCO, CMG, KMB, GM, ADM, MSCI, BIIB, GEHC, DOW, PCAR, CNC, ILMN, ENPH, HAL, CSGP, GLW, SPOT, EQR, LH, NVR, NTRS, AGR, PHM, TRU, HUBB, NMR, ENTG, TFII, QGEN, JNPR, ARCC, MANH, BXP, IVZ, ST, THC, BYD, PII, MTDR, OMF, MLI, OI, SSTK, JBLU, XRX, LRN,
Wednesday, April 26:
META, TMO, BA, NOW, AMT, ADP, CP, BSX, CME, WM, GD, HUM, ORLY, PXD, NSC, EW, KLAC, APH, HES, TEL, AFL, LYG, HLT, ODFL, WCN, OTIS, CVE, AWK, ALGN, ACGL, URI, RCI, AVB, GIB, FTV, TECK, EBAY, ETR, DOV, RJF, UMC, TDY, ROL, BMRN, WAB, MKL, MAA, SUI, ICLR, IEX, MOH, TYL, TER, AZPN, PTC, AVY, UDR, MKTX, GGG, EQT, MAS, CHRW, PAG, CHDN, OC, WSC, ROKU, RHI, WOLF, ACHC, AR, LSTR, MAT, SLGN, SLAB, TNET, MTH, TDOC, MMSI, WFRD, TMHC, R, PEGA, ASGN, HP, PI, SLM, QS, GPI, MC, MXL, EVTC, HELE, EXTR, OII, UCTT
Economic Reports
Feb Case-Shiller home price index: +0.1% (actual) vs. -0.3% (estimate)
Feb FHFA house price index: +0.5% (actual) vs. -0.1% (estimate)
April consumer confidence: 101.3 (actual) vs. 104.0 (estimate)
March new home sales: 683,000 (actual) vs. 634,000 (estimate)
Happy trading!
Tom