
EB Daily Market Report - Wednesday, April 26, 2023
Guest Hosting The Final Bar
I will be hosting The Final Bar again today, subbing for David Keller, who normally hosts StockCharts TV's flagship show. The show airs from 4:00pm-4:30pm Monday through Friday. I will continue to guest host the show through tomorrow. The following guests will join me:
- Wednesday guest, Arthur Hill
- Thursday guest, Erin Swenlin
I should have another couple of great shows, so please plan to join me for these shows, if you can!
Executive Market Summary
- Futures were higher overnight, especially on the NASDAQ, as a major component - Microsoft (MSFT, +7.46%) blew away consensus estimates
- Banks ($DJUSBK, -0.76%) are clouding the market picture as First Republic Bank San Francisco (FRC, -23.21%) stumbles again after losing half its market cap on Tuesday
- Cryptocurrencies are surging higher, led by bitcoin's ($BTCUSD, +7.75%) spike; etherium ($ETHUSD, +6.00%) isn't far behind
- Crude oil ($WTIC, -1.48%) fell again, this time beneath $76 per barrel, as energy (XLE, -1.41%) lags
- Utilities (XLU, -2.29%) is today's worst-performing sector, while technology (XLK, +1.65%) is obviously benefiting from MSFT's big move; MSFT represents nearly 23% of the XLK
- Consumer discretionary (XLY, +0.05%) is the only other sector that's in positive territory
- Broadline retail ($DJUSRB, +2.06%) and restaurants & bars ($DJUSRU, +1.95%) are leading discretionary; Chipotle Mexican Grill (CMG, +14.14%) is soaring on excellent quarterly results
- Meta Platforms (META, +1.40%) is a big name reporting after today's closing bell
Market Outlook
A member wrote in, asking about small caps and whether my opinion has changed on them. Well, if you recall last Monday, I wrote about the possibility that we'd see money rotate away from some of the larger stocks and perhaps rotate into small caps, where options expiration shouldn't have the same type of impact. I also highlighted recent bottoming structures where the IWM exploded to the upside for a period of time. With that in mind, I took a fairly small position in the TNA, which tracks the IWM at a 3 to 1 clip. Clearly, I was expecting a breakout and a surge in that area of the market, but it didn't happen. I was up nicely on the TNA on Monday and we saw a nice gap up on Tuesday that cleared overhead resistance. For me, it was do or die at that point. When we fell back throughout the day on Tuesday, I closed the position. I believe I wrote in the DMR last Tuesday that I had exited all leveraged products. I am not a fan of false breakouts. They make me nervous, because it's likely that market makers have used that strength to unload shares. That's why we see failures like that.
Remember, I view leveraged ETFs as absolute FIRE. They can provide a HUGE boost to your portfolio when the underlying security trends. But I try to avoid riding leveraged ETFs lower, unless that was part of my original strategy - to build a position on weakness down to a certain level.
Here's the latest look at the IWM (which the TNA tracks):
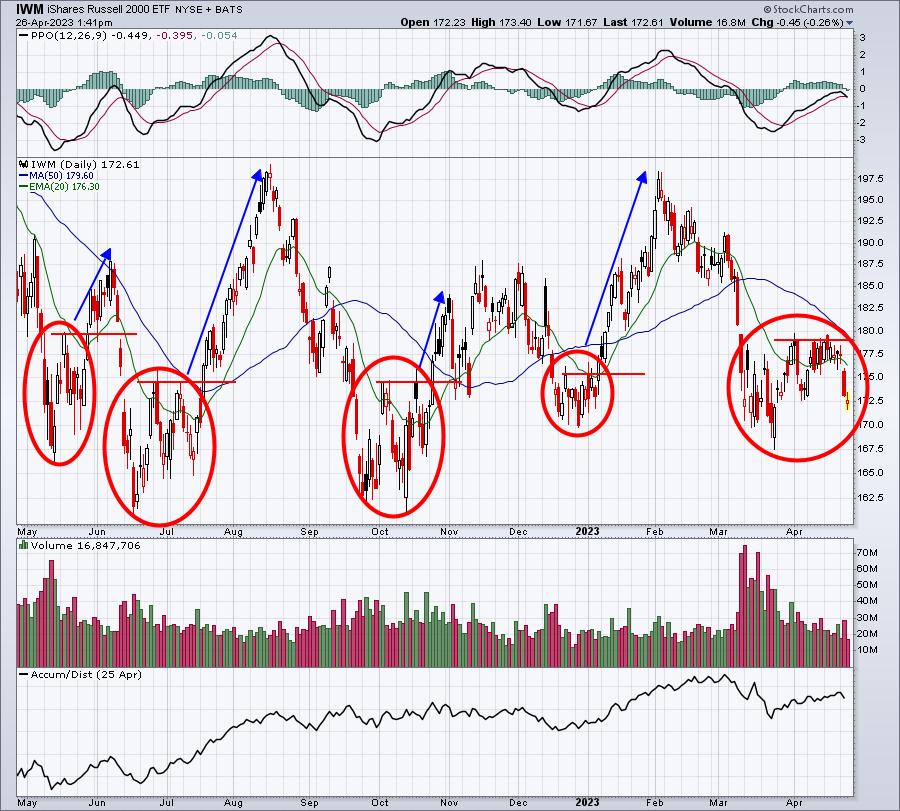
My decision to exit the TNA was simply based on the fact that we had gapped up and had a breakout in hand, only to fail. I only had a small position, but I didn't want to take the chance of riding it back down. I'm still watching this chart and, if the IWM can forge a breakout above that red resistance line, I'll likely jump back into the TNA.
Sector/Industry Focus
Microsoft's (MSFT) blowout quarterly earnings report certainly gave technology stocks (XLK) a big lift this morning, but we've seen little follow through and overhead price resistance on the QQQ has been difficult. I follow the 20-hour EMA and the prior day's high as two key levels to watch during a downtrend. Moving back above both begins to look like a reversal. Here are two charts of the QQQ to illustrate:
QQQ (5-day 10-minute chart):
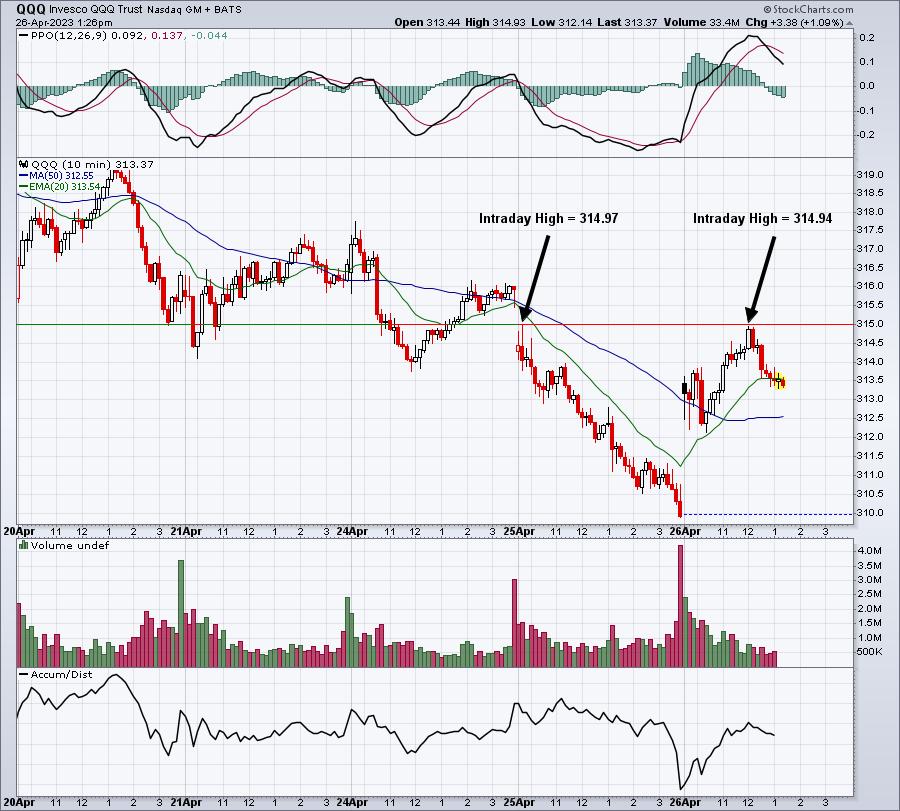
The intraday high earlier today fell just shy of yesterday's high. A late-day rally to clear this level near 315 would be much more bullish. Or perhaps that move occurs tomorrow. That's what I'm looking for.
QQQ (15-day 60-minute chart):
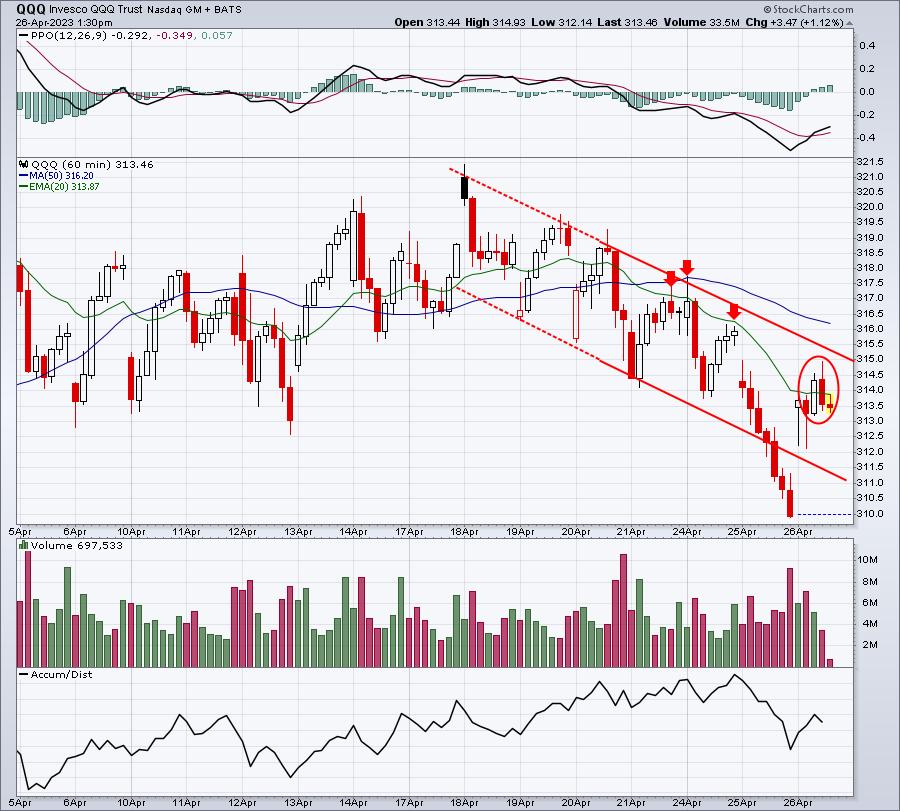
Last Thursday, I provided an hourly chart of the QQQ and highlighted the tops from Tuesday and Wednesday and projected that downtrend slope out for another week or so, highlighting the possibility of a move back down towards 313 ( we actually moved to 310 at yesterday's close). With this weakness, I've taken on a bit of leverage on the QQQ, buying the TQQQ. I want to see the underlying QQQ move through 315. That would start to provide me the confidence to hold on for awhile. I've talked about a 305 stop, but I might consider exiting on a trip beneath Tuesday's close of 309.99.
ChartLists/Strategies
First, I've already taken profits on CDNS and I took a loss on CSX - two stocks that I mentioned in yesterday's DMR. I have more confidence in CDNS going forward, because it's been a leader in a leading industry group in 2023 - software ($DJUSSW). I like CSX, but failure to hold its gap support level today (it gapped below 30.81 gap support) is bothersome, especially considering that it's in the railroad group ($DJUSRR), which has been notably weak over the past several months.
One stock that looks interesting to me is Tapestry (TPR). I don't own it currently and I may not buy it, simply because I don't want any additional risk until we can move back above the 20-day EMA on the QQQ. However, it does look like a potential bottoming reverse head & shoulders pattern - at least for now:
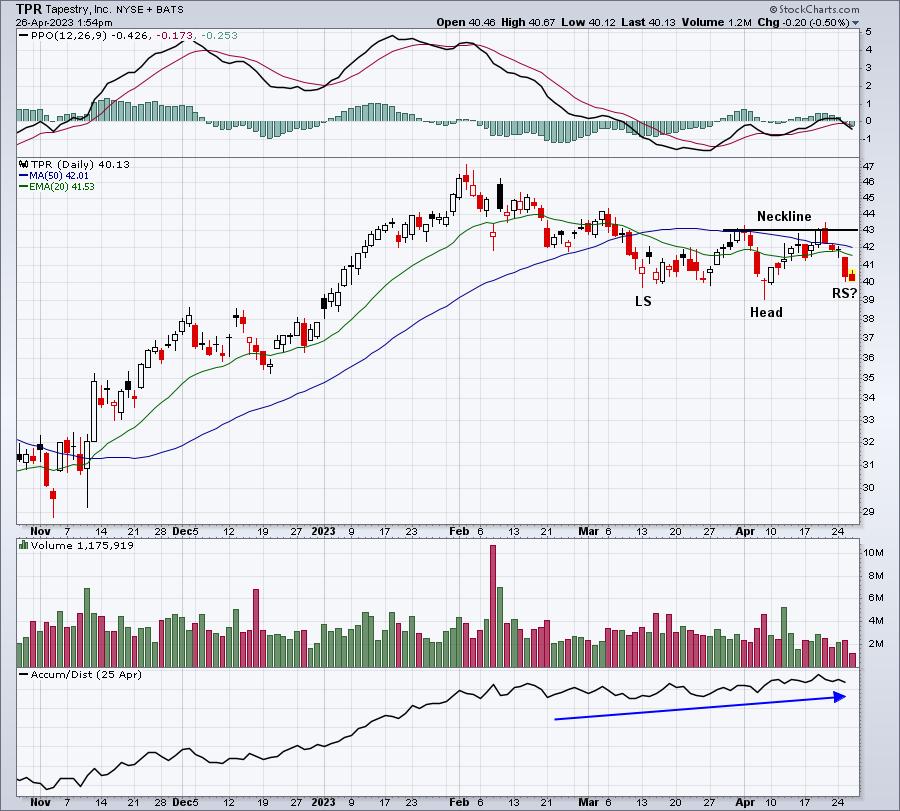
TPR came from the Raised Guidance ChartList (RGCL). It's currently slated to report quarterly results on May 11th. Will TPR reverse here and resume its uptrend as it approaches its earnings report? That's entirely possible, especially if it can clear its neckline resistance before it breaks below the head of this bottoming structure. The best time to buy such a stock is right here, with a stop beneath the head. Waiting for the ultimate breakout likely increases the odds of an uptrending stock, but the biggest reward comes from buying stocks in the reverse right shoulder. Time will tell which way this plays out.
Earnings Reports
Here are the key earnings reports for the next two days, featuring stocks with market caps of more than $10 billion. I also include several companies with market caps below $10 billion. Finally, any portfolio stocks that will be reporting results are highlighted in BOLD. If you decide to hold a stock into earnings, please understand the significant short-term risk that you are taking. Please be sure to check for earnings dates for any companies you own or are considering owning.
Wednesday, April 26:
META, TMO, BA, NOW, AMT, ADP, CP, BSX, CME, WM, GD, HUM, ORLY, PXD, NSC, EW, KLAC, APH, HES, TEL, AFL, LYG, HLT, ODFL, WCN, OTIS, CVE, AWK, ALGN, ACGL, URI, RCI, AVB, GIB, FTV, TECK, EBAY, ETR, DOV, RJF, UMC, TDY, ROL, BMRN, WAB, MKL, MAA, SUI, ICLR, IEX, MOH, TYL, TER, AZPN, PTC, AVY, UDR, MKTX, GGG, EQT, MAS, CHRW, PAG, CHDN, OC, WSC, ROKU, RHI, WOLF, ACHC, AR, LSTR, MAT, SLGN, SLAB, TNET, MTH, TDOC, MMSI, WFRD, TMHC, R, PEGA, ASGN, HP, PI, SLM, QS, GPI, MC, MXL, EVTC, HELE, EXTR, OII, UCTT
Thursday, April 27:
AMZN, LLY, MA, MRK, ABBV, AZN, LIN, TMUS, CMCSA, BMY, SNY, HON, AMGN, INTC, CAT, SPGI, GILD, MDLZ, MO, SO, NOC, HSY, KDP, DXCM, ROP, VLO, AJG, RSG, STM, XEL, LHX, NEM, SGEN, IQV, COF, MBLY, GWW, RMD, FIS, ROK, DLR, AEM, WST, TSCO, WTW, WIT, DTE, FE, BAX, VRSN, WY, FSLR, CHD, CBRE, HIG, NET, CNP, LUV, PINS, PFG, CMS, FICO, TW, CINF, DGX, SNAP, LPLA, LKQ, RS, SIRI, IPG, SSNC, TXT, ESS, GLPI, IP, GFL, DPZ, KIM, PEAK, CPT, CSL, CUBE, AOS, CROX, LII, PNR, AAL, LEA, SKX, OLN, HAS, FCN, CFR, MHK, X, SWN, HOG, HGV, OSK, HTZ, APPF, FCFS, ALSN, CC, VC, SRCL, AYX, PFSI, DQ, ROG, HUBG, TPH, ITGR, CRS, SKT, COUR, LVWR, SWI, ACCD, IMAX
Economic Reports
March durable goods: +3.2% (actual) vs. +0.9% (estimate)
March durable goods ex-transports: +0.3% (actual) vs. -0.2% (estimate)
March wholesale inventories: +0.1% (actual) vs. +0.2% (estimate)
Happy trading!
Tom