
EB Daily Market Report - Monday, May 1,2023
ChartLists and May Seasonality Report
I sent out the 20 stocks that comprise our May Seasonality ChartList. These are the 20 stocks that usually benefit from historical tailwinds. I don't use seasonality as a primary indicator, however. In other words, I NEVER buy stocks, because of historical strength. I still would only buy based upon appropriate technical signs. But a strong historical pattern would add to my bullishness and confidence. The May Seasonality Report should be mailed out later today, though it could be tomorrow before I can finish it.
I'm also working to update the majority of our ChartLists by Wednesday and through April 30th. I'll keep you posted here in the DMR as to the status on our ChartLists.
Executive Market Summary
- Futures were mostly flat to start the month of May
- We've seen strength since the open, however, as the S&P 500 is trying to clear key short-term price resistance near 4180
- The QQQ (ETF that tracks NASDAQ 100) is only 8 bucks away from its August 2022 closing high - this will be a MAJOR market test
- Industrials (XLI, +0.96%) and utilities (XLU, +0.89%) are leading today's action, while energy (XLE, -1.14%) is the primary laggard
- Crude oil prices ($WTIC, -1.89%) are down to $75 per barrel; the RSI on $WTIC has reached 40, so this is a key area to expect a reversal back to the upside
- Cryptocurrencies are very weak to open May as bitcoin ($BTCUSD, -3.41%) is down 1000 points
- ON Semiconductor (ON, +7.56%) reported better-than-expected quarterly results and is helping to lift semiconductor stocks ($DJUSSC, +1.46%)
- There will be a slew of earnings reports out this week, nearly 1000, but the really big one will be Apple, Inc. (AAPL, +0.37%), which reports its latest results on Thursday after the bell - I'm expecting a big blowout
Market Outlook
There's mostly good news today. The S&P 500 is clearing its overhead price resistance, perhaps signaling that yet another key index is going to confirm a breakout today:
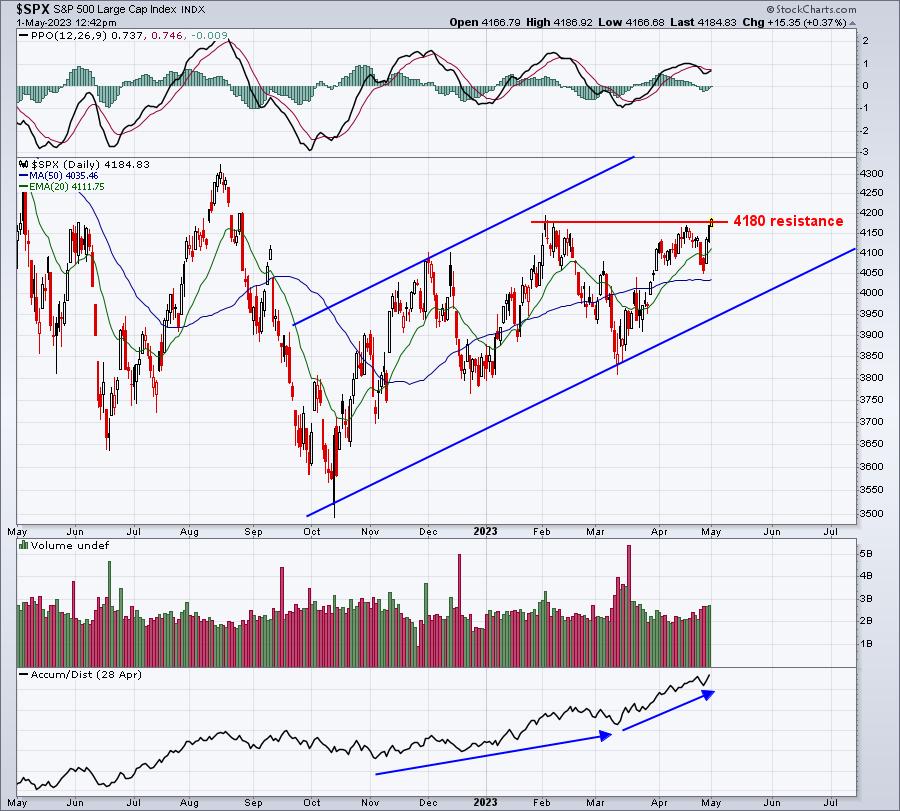
I wouldn't want to be in the shoes of those believing that short positions are still working. If the S&P 500 confirms a breakout today, the next big resistance level is 4305 - and this one is HUGE! A weekly close above 4305 would end the series of lower highs and lower lows on the weekly chart. Literally, there will be nothing for bears to cling to in terms of bear market signals. Yet, they'll continue to argue all the way up to all-time highs.
The QQQ (ETF tracking the NASDAQ 100) broke out on Friday and retested its breakout level this morning at the 321 level. Check this out:
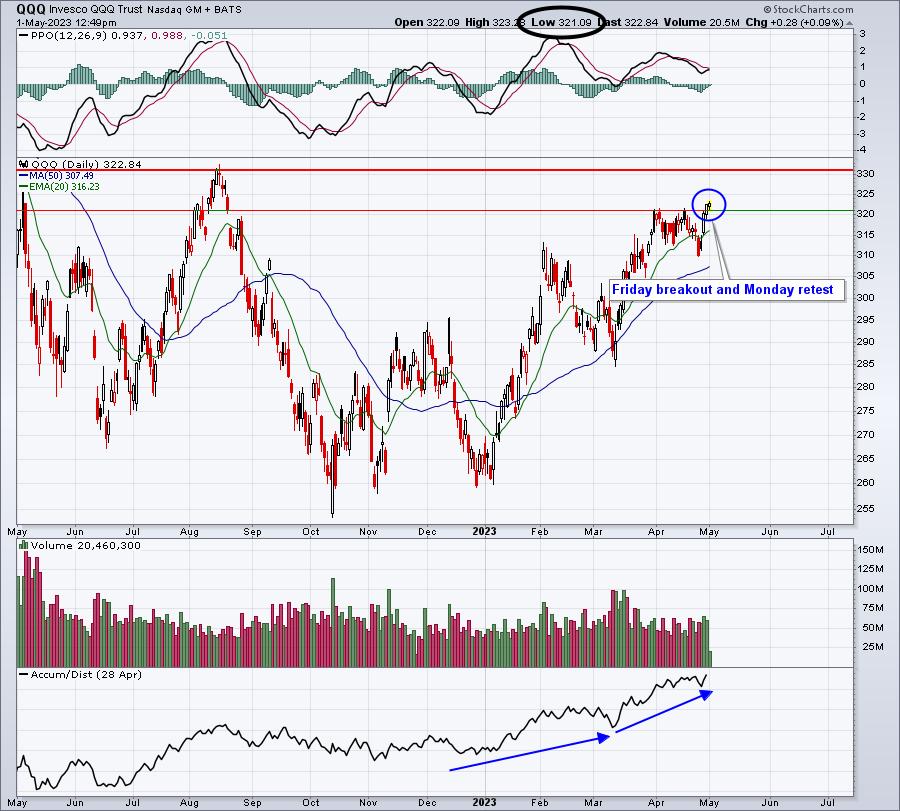
I used the pullback to re-establish a small position in the TQQQ. I'd add more on a 20-day EMA test. My strategy is to exit leveraged ETFs when the underlying index approaches or tests key price resistance. It's not an admission that prices won't go higher. Rather, it's just respect for a price level where we've previously seen selling. If we break above such resistance, we can always get back in. Or if we pull back to a key support level. But what I do NOT want to do is ride leveraged ETFs up and down. That causes erosion and reduces potential return. I'd rather see the breakout and then re-enter slightly higher, which is what I did.
So I'm primarily in the QQQ, but I do have fairly small positions in the TQQQ (3x QQQ) and SOXL (3x semiconductors).
Another reason for leverage is the time of the month. The 1st day of calendar months has proven historically to be the most bullish day of the calendar month as the U.S. market welcomes in new money flow. We typically move higher for 3-5 days at the beginning of most calendar months. Therefore, technicals align bullishly with historical tendencies. I like the combo and am willing to take on more risk - at least temporarily.
Sector/Industry Focus
I've spoken about the importance of semiconductors ($DJUSSC) recently, but honestly, I've spoken about this group since I began doing webinars and blog articles. I believe they are THE most important industry group for overall stock market performance. Semiconductors are used in everything nowadays, so how companies in this space perform give us a really good look ahead at possible directional moves on the S&P 500, and especially the NASDAQ 100 ($NDX). Of the 100 companies on the NASDAQ 100, here are the industry groups with the most representation:
- Semiconductors: 16
- Software: 14
- Internet: 8
- Biotechnology: 8
That's nearly half of the NDX representation in these four industries. To further illustrate the impact of semiconductors, let's look at the relative performance of semis vs. the benchmark S&P 500 ($DJUSSC:$SPX) and check out the correlation of that relative strength/weakness vs. the absolute direction of the S&P 500:
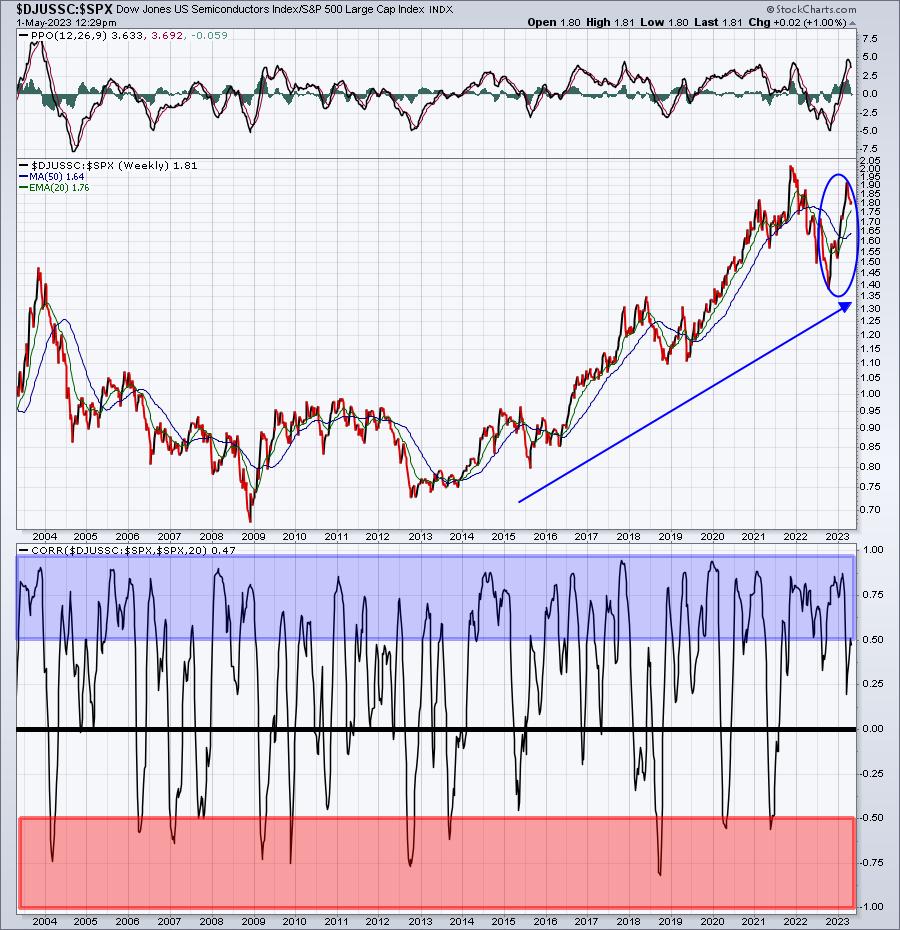
The thick black horizontal line is simply highlighting the zero line, where there's little correlation at all - neither positive or negative. But check out the blue-shaded area above +0.50 and the red-shaded area below -0.50%. Correlation spends the majority of its time above +0.50. That tells us that the relative performance of semiconductors really matters.
You might think that's the way all industry groups work, but it's not. Let's take soft drinks ($DJUSSD) as a second example. Common sense might suggest that when the stock market is going higher, the economy is stronger, and more soft drinks would be bought. But in reality, the $DJUSSD:$SPX ratio is one of an inverse correlation. Check this out:
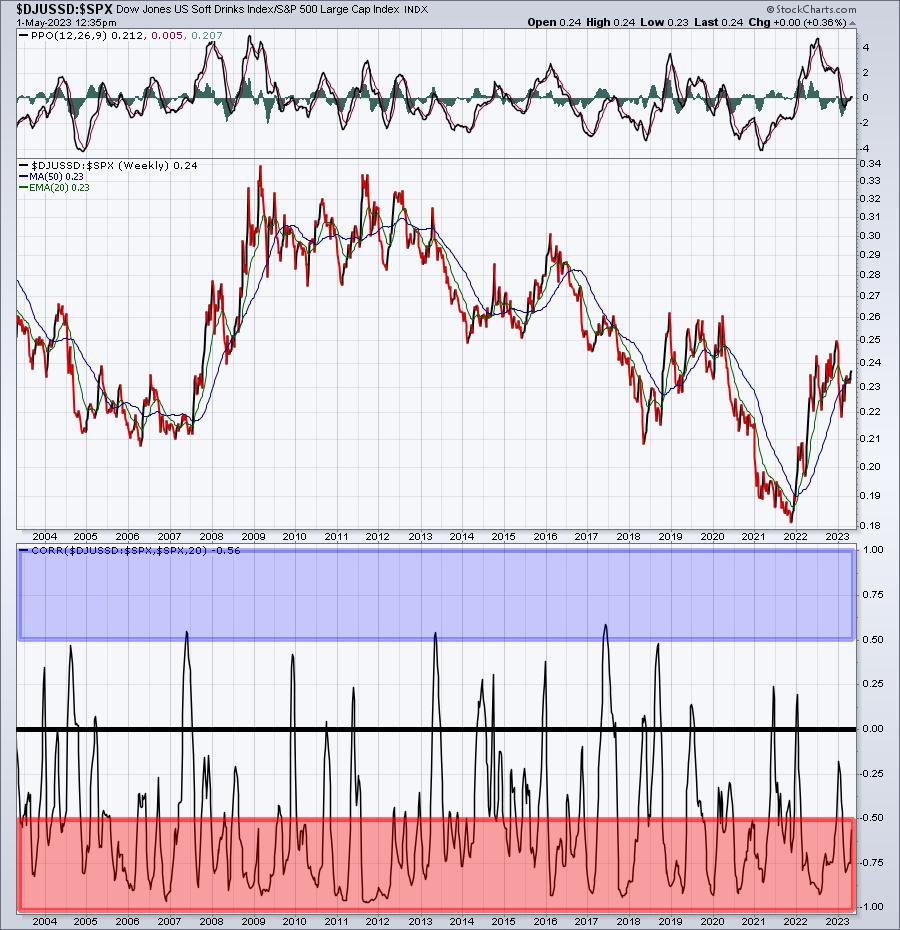
Little different chart, eh? Soft drinks actually outperform the S&P 500 when it's going DOWN. That's what defensive-oriented sectors and industry groups do.
Keep a close eye on those semiconductors, that's the group that really matters. It's also why I focus so much of my attention on semiconductors, software ($DJUSSW), and internet ($DJUSNS). These groups highly impact market direction.
ChartLists/Strategies
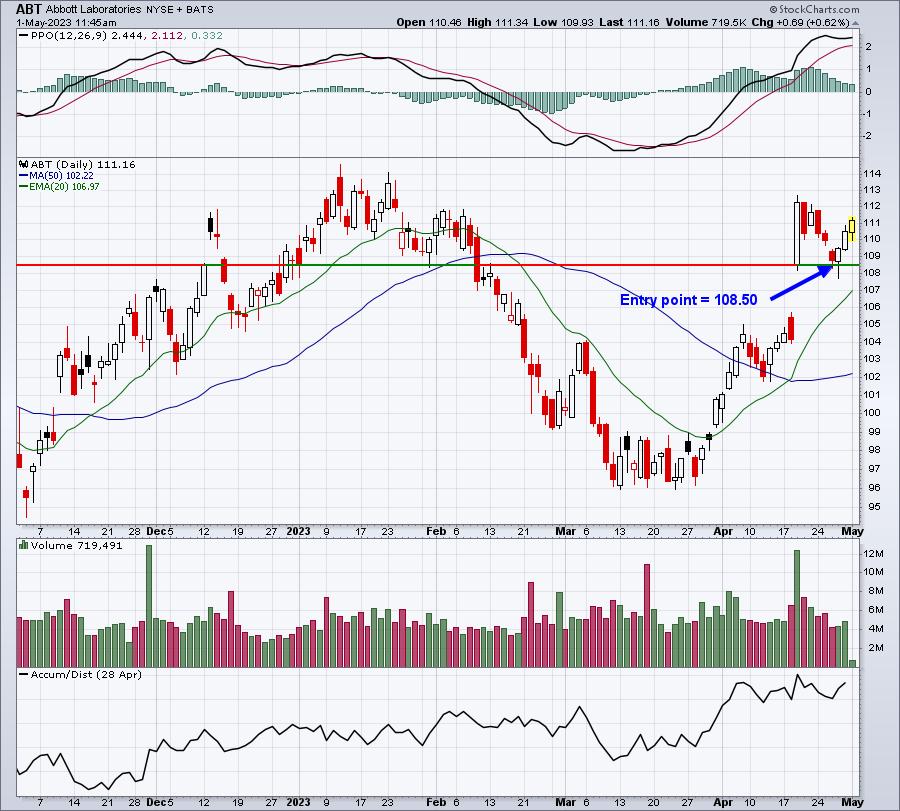
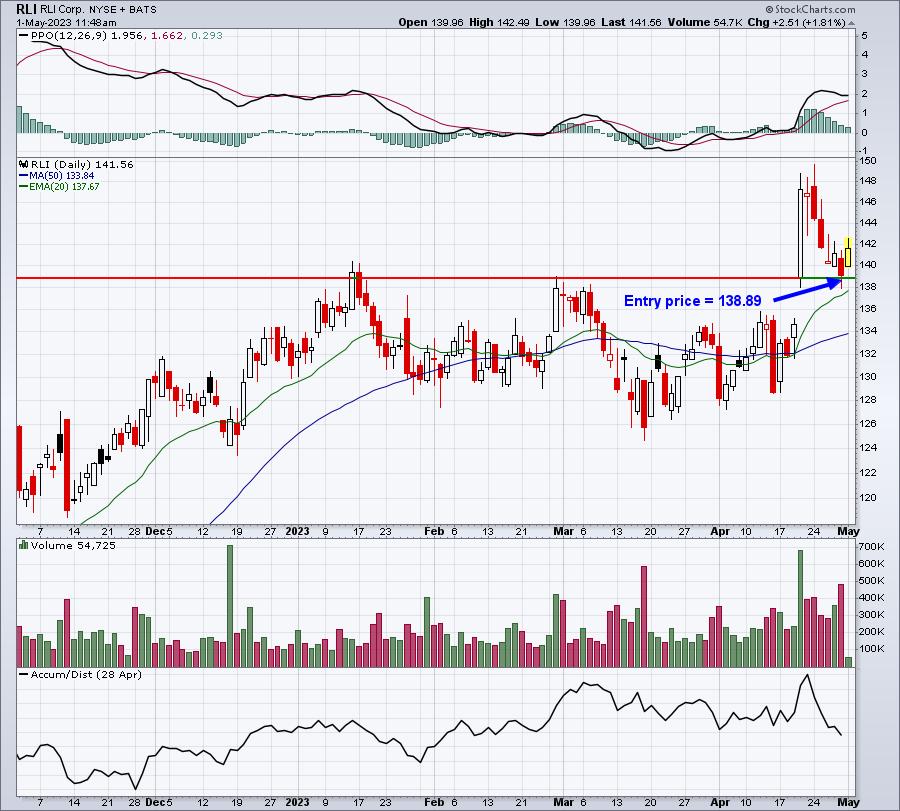
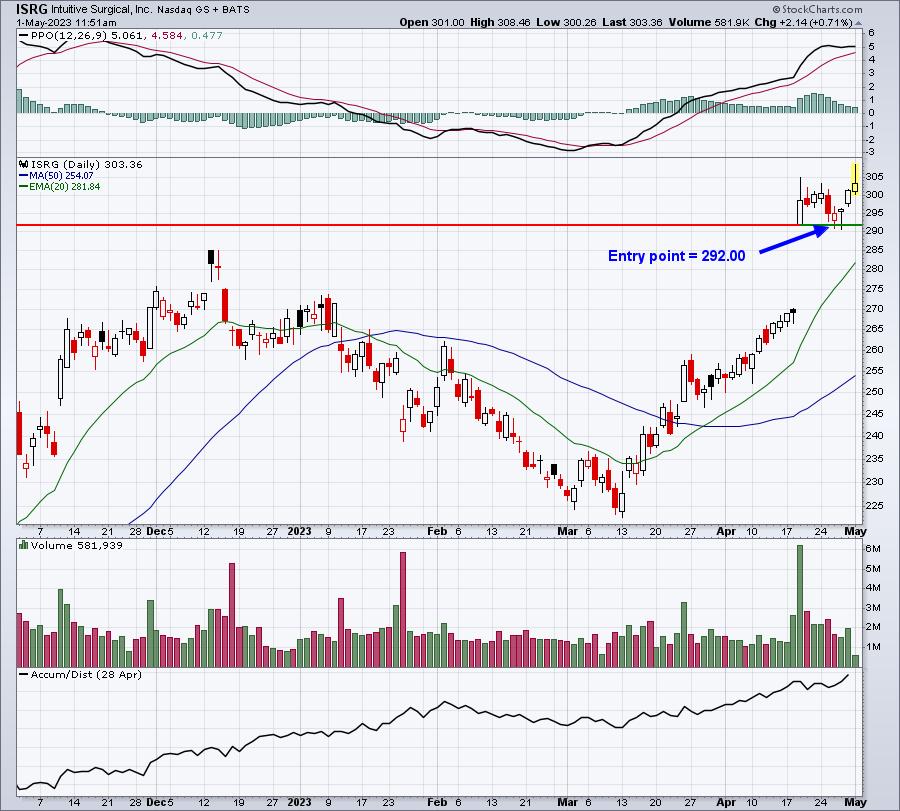
I want everyone to see visually what I like to see when I trade the top of earnings gaps. It's probably my favorite trade. I want to see gap ups, hollow candles, and heavy volume. If I get all three, then I like to buy such stocks on tests of the top of gap support. Here are a few examples of what to look for:
ABT:
RLI:
ISRG:
ASML:
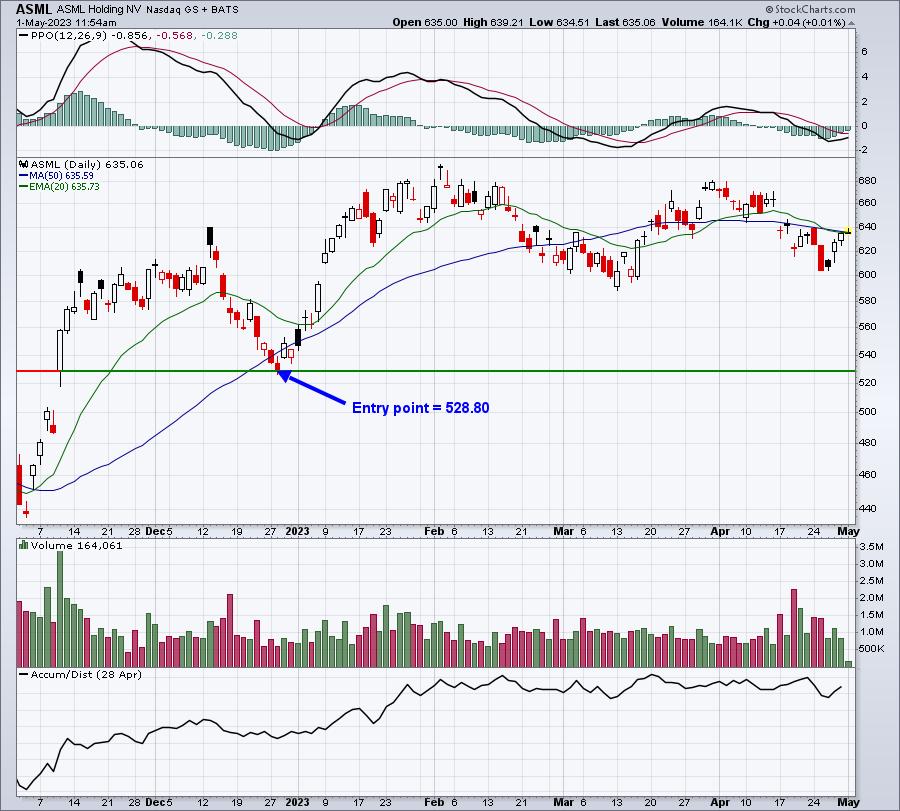
Note that the volume on all four of these was exceptionally high, all had hollow candles, and initial tests of the top of gap support proved to be excellent entry points. The ASML chart was provided to illustrate that this gap support doesn't have to be tested within a week or two. Sometimes, it's several weeks before we see a test. I still view these as great entry opportunities.
Earnings Reports
Here are the key earnings reports for the next two days, featuring stocks with market caps of more than $10 billion. I also include several companies with market caps below $10 billion. Finally, any portfolio stocks that will be reporting results are highlighted in BOLD. If you decide to hold a stock into earnings, please understand the significant short-term risk that you are taking. Please be sure to check for earnings dates for any companies you own or are considering owning.
Monday, May 1:
SYK, VRTX, ANET, NXPI, VICI, ON, WEC, GPN, SBAC, FANG, HOLX, INVH, SYM, RE, MBM, CHKP, FMC, CF, BEN, LSCC, SCI, CNA, LOGI, ZI, KBR, CAR, BRX, CACC, SON, WWD, AMKR, SOFI, NCLH, SGRY, RMBS, AL, FLS, RIG, SFM, MSTR, TEX, AXNX, VNO, TMDX, VRNS, CHGG, KMT
Tuesday, May 2:
PFE, AMD, SBUX, BP, ITW, ETN, TRI, UBER, EPD, MPC, MAR, ECL, F, IDXX, ET, WELL, SYY, LNG, SPG, MPLX, ABC, CMI, PEG, AME, DD, PRU, FNV, OKE, ZBH, EIX, YUMC, TROW, IT, QSR, CLX, EXR, HWM, PAYC, EXPD, BR, INCY, AMCR, ZBRA, AER, TAP, LDOS, JKHY, SRPT, LSI, PEN, CHK, AFG, MTCH, CZR, AGCO, RNR, UNM, RGEN, INSP, GPK, VOYA, AXTA, SEE, OHI, AIZ, ADT, MUSA, IPGP, SMCI, WK, TRTN, SUN, WU, LTHM, LOPE, INMD, MDC, SAGE, SPT, MRCY, LGIH, OMCL, CVLT, PRFT, ATRC, VIAV, TGH, HLF, XHR, DVAX, NRDS
Economic Reports
April PMI manufacturing: 50.2 (actual) vs. 50.4 (estimate)
April ISM manufacturing: 47.1 (actual) vs. 46.8 (estimate)
March construction spending: +0.3% (actual) vs. +0.1% (estimate)
Happy trading!
Tom