
EB Daily Market Report - Tuesday, May 9, 2023
Executive Market Summary
- Futures were down overnight and our major indices gapped lower
- All major indices are down and the Volatility Index ($VIX, +2.53%) has spiked a bit - not too surprising with a big inflation report on deck
- The April CPI report will be out tomorrow morning at 8:30am ET
- It's interesting to note, however, that large cap growth (IWF, -0.27%) is outperforming large cap value (IWD, -0.36%); if market participants are worried, they're not exactly abandoning growth stocks
- The 10-year treasury yield ($TNX) is flat today and in the middle of a wide 3.27%-3.65% trading range, not exactly providing any clues about tomorrow
- Despite crude oil ($WTIC, -0.79%) dropping, energy (XLE, +0.21%) leads all sectors, with industrials (XLI, +0.12%) the only other sector in positive territory
- Materials (XLB, -0.68%) and technology (XLK, -0.62%) lead the losing sectors to the downside
- Semiconductors ($DJUSSC, -1.93%) are a drag on technology today, after its recent winning streak carried it to a 3-week high
- Devon Energy (DVN, +14.00%) reported strong results, lifting it to the top of the S&P 500 leaderboard; meanwhile, PayPal Holdings (PYPL, -11.86%) exactly tested its multi-year low from December of 66.39
Market Outlook
The stock market has simply floundered today, likely awaiting the latest inflation news that will be delivered tomorrow morning at 8:30am ET. Expectations are that the April CPI rose +0.4%, easily topping March's +0.1% reading. If we strip out food and energy, the April Core CPI is expected to match the March reading of +0.4%. Here's a chart of the monthly CPI, showing a 12-month rate of change (ROC):
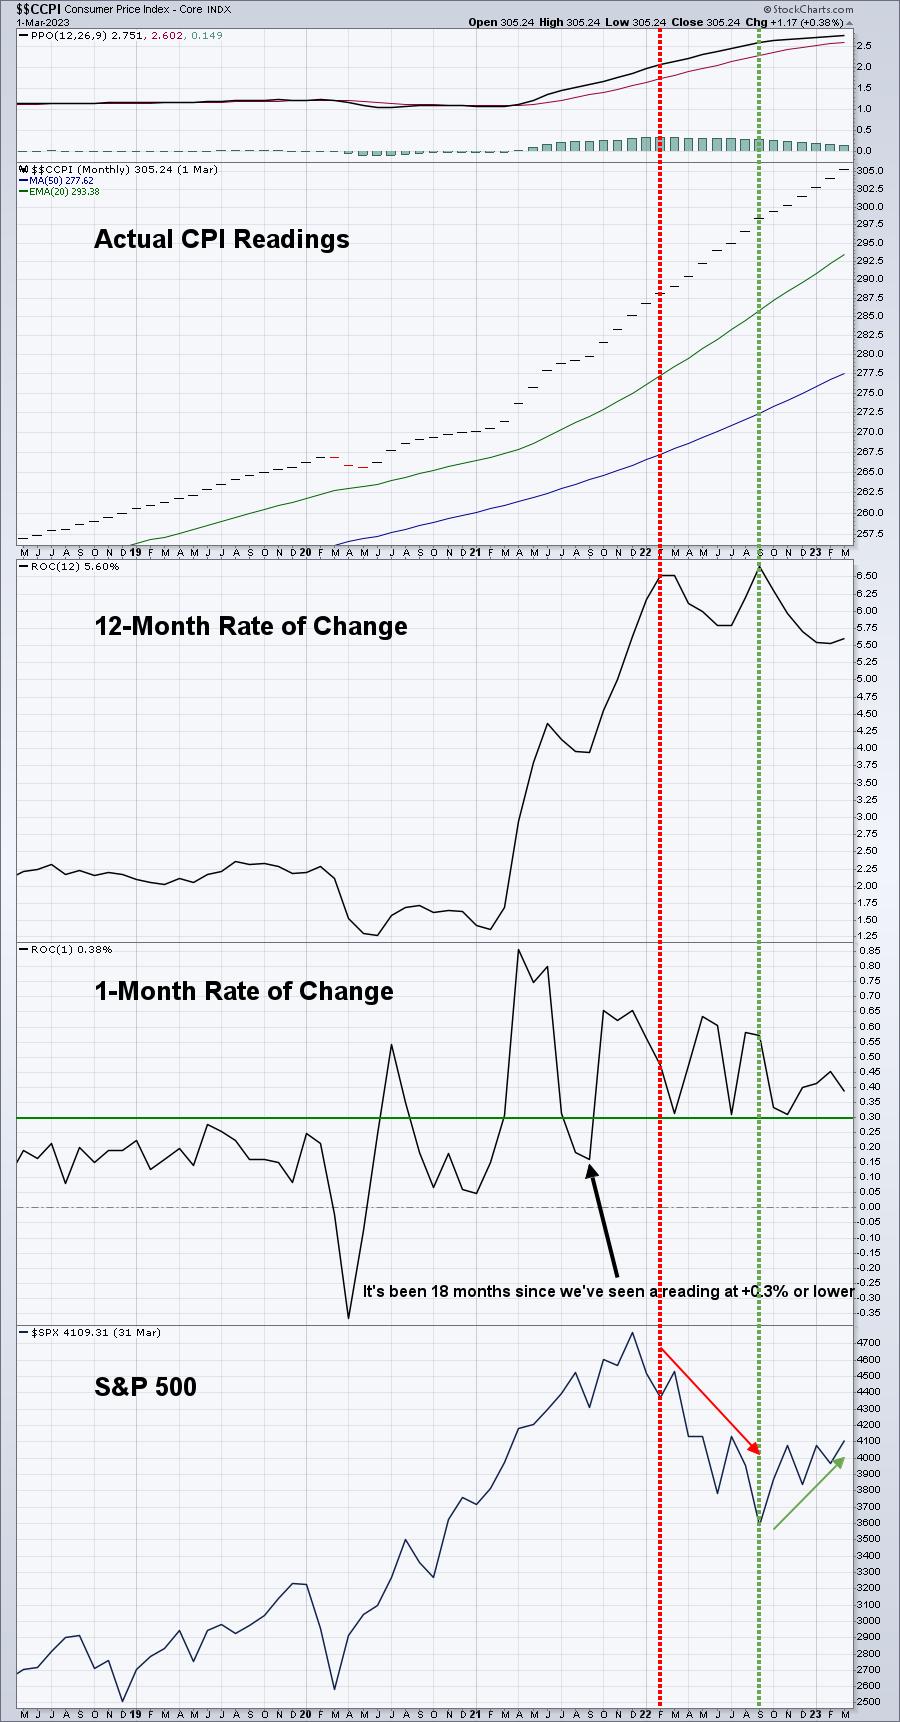
This gives us a bit of perspective as we approach tomorrow's April CPI report. Note that when the annual rate of core inflation initially hit a high, the S&P 500 was near its all-time high and then we saw the cyclical bear market. Since the 2nd high in September 2021, the annual rate of core inflation has been falling and the S&P 500 secular bull market has resumed. I wrote a long time ago that when the inflation rate begins dropping, stocks take off - especially growth stocks. That's exactly what we're seeing in 2023 and what I expect will continue to happen. It also lines up beautifully with seasonality, as I discuss below.
Sector/Industry Focus
I've discussed and written about the advantage of owning large-cap growth stocks (IWF) vs. large- cap value stocks (IWD) from May through August. If you haven't seen it, check out this RELATIVE seasonality chart of the IWF vs. IWD:
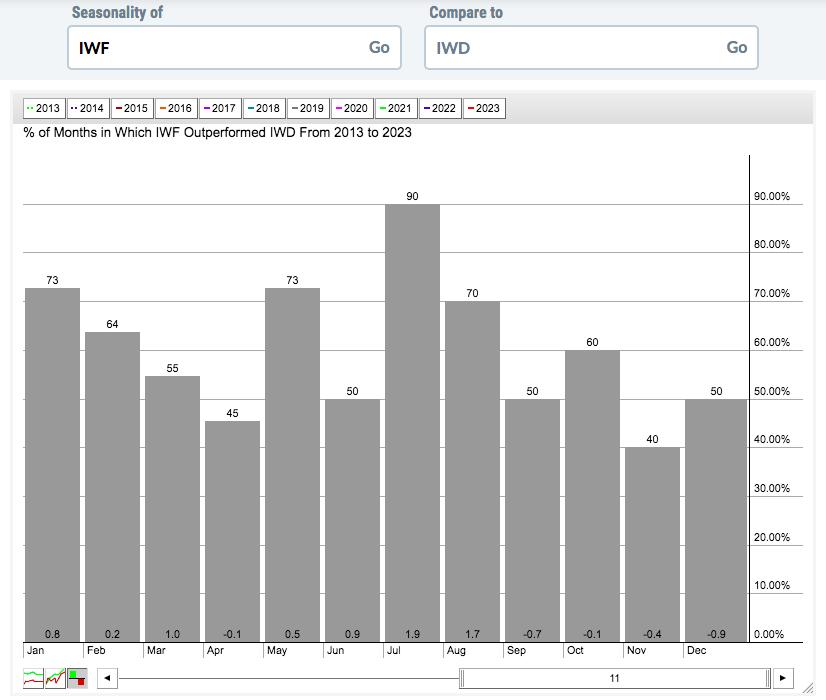
If you add the average relative performance from each calendar month (bottom of gray bars), you'll get +4.8%. This represents the average annual outperformance of the IWF vs. IWD since 2013, the start of the current secular bull market. Now add up the columns from May through August. They total +5.0%. This means that growth has CRUSHED value during these four months. The entire year shows +4.8%, while just May through August tallies +5.0%. That tells us that the ENTIRE relative strength of growth stocks vs. value stocks takes place in the current May to August time frame. This ratio looked bullish to me as we entered May and I'm expecting the prospects of lower interest rates later in 2023 or in early 2024. If I'm right, that should propel growth stock soaring above value stocks. It could start with a vengeance tomorrow if that April CPI cooperates. If not, I only see it being a temporary obstacle for U.S. growth stocks. Eventually, I see the stock market trending much higher, led by growth stocks.
ChartLists/Strategies
The Short Squeeze ChartList (SSCL) is worth a quick review today. I bought 3 of them this morning (CVNA - already took a profit, and bought back again at 11.80, NVAX - took a loss on the move below 9.80, and VUZI still holding), but with fairly light position size. I don't try to be a hero with these stocks. I try to make money and GET OUT. The whole idea is that when they start to work, those with short positions must decide what to do - cover (buy) and send prices even higher, or hold and potentially see losses rise exponentially. It becomes a very emotional decision and riding short squeeze stocks on the long side can be like surfing and catching a massive wave. But they are VERY risky, because we know that the masses are betting against these companies. For that reason, many continue to drift lower and lower and lower. Holding these stocks and waiting on strength can be disastrous. Instead, I wait for a big pop and try to "catch the wave" as more and more shorts go "underwater" (lose money).
There are a few things I look for in short squeeze stocks. I want extremely heavy volume, which suggests a short squeeze could be underway. Second, I LOVE to see a strong afternoon finish, because that many times will lead to a panicked gap higher the next morning. I tend to begin taking a bit of profit on strong intraday action and then hold the balance for a possible gap higher. Third, does it look like the masses could be starting to lose money? If a stock has tumbled from 20 to 2, a gap back up to 2.50 isn't likely to worry a large group of short sellers. But if that stock were to gap to 3 and trade intraday to 4 or 5, many shorts could be faced with that "buy NOW or else!" kind of decision. And like I said before, once it gets emotional, short squeeze stocks can FLY simply based on the increased demand and limited supply. Here is our Short Squeeze Summary, highlighting the best performers on this ChartList today:
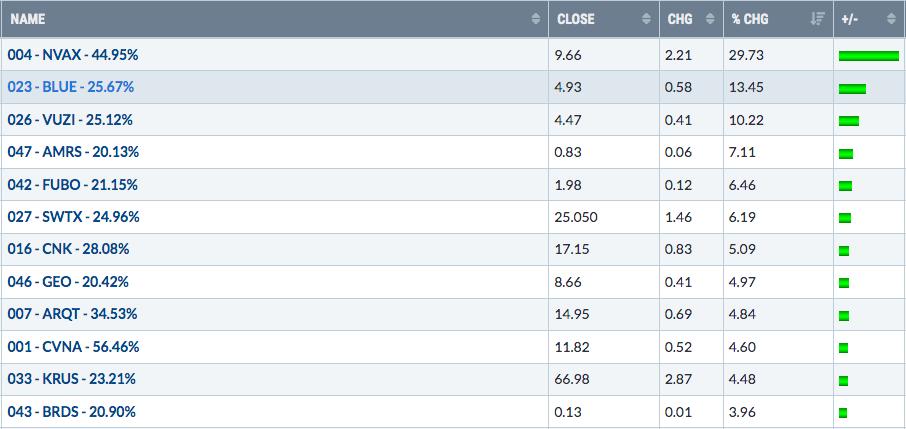
These are the Top 12 on the SSCL today. Note that the top two of these (NVAX and CVNA) have enormous short positions, suggesting an even higher likelihood that a short-term rally could turn into something much bigger if they finish strong. Here are the 3 charts:
CVNA:
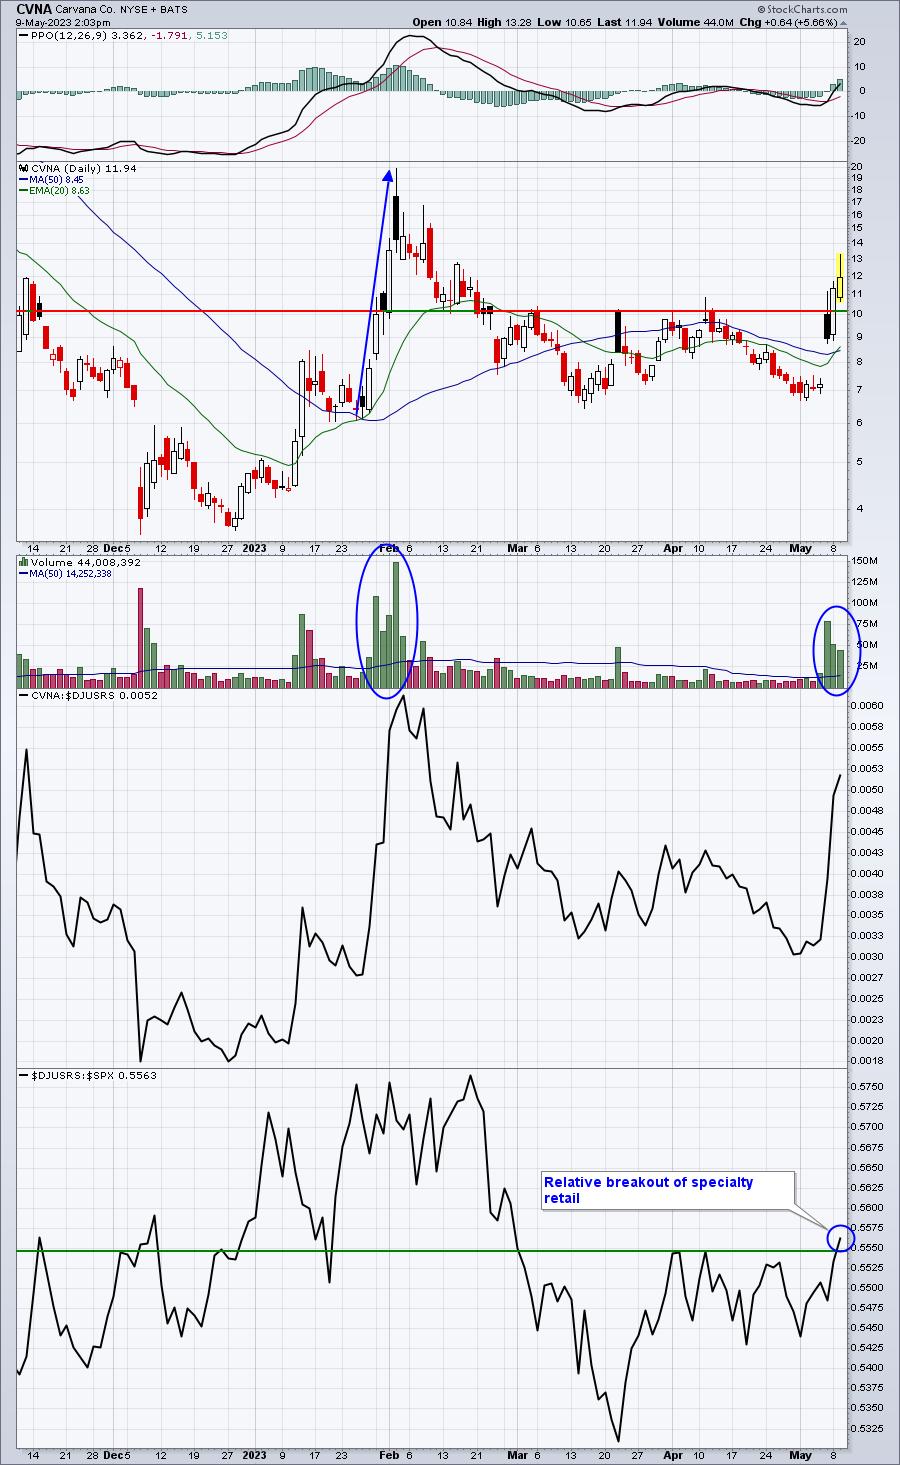
Specialty retail ($DJUSRS) has strengthened and CVNA has exploded to clear prior price resistance and check out the volume. I also want to point out the late-January short squeeze, because these rallies can fall apart as quickly as they start. There's no rhyme or reason to how far these stocks might run. That's why I try not to be greedy. I take my profits and run - or perhaps re-enter at a lower price. I took profits on CVNA when it began to print lower intraday lows on a 10-minute chart. I just recently got back in at 11.80, however, as selling slowed. I want to see a strong finish here. One possible strategy would be to hold CVNA until it prints a lower DAILY low. That means giving it much more room, which I may do. Again, my position size is small, roughly one-third of a normal position size for me.
NVAX:
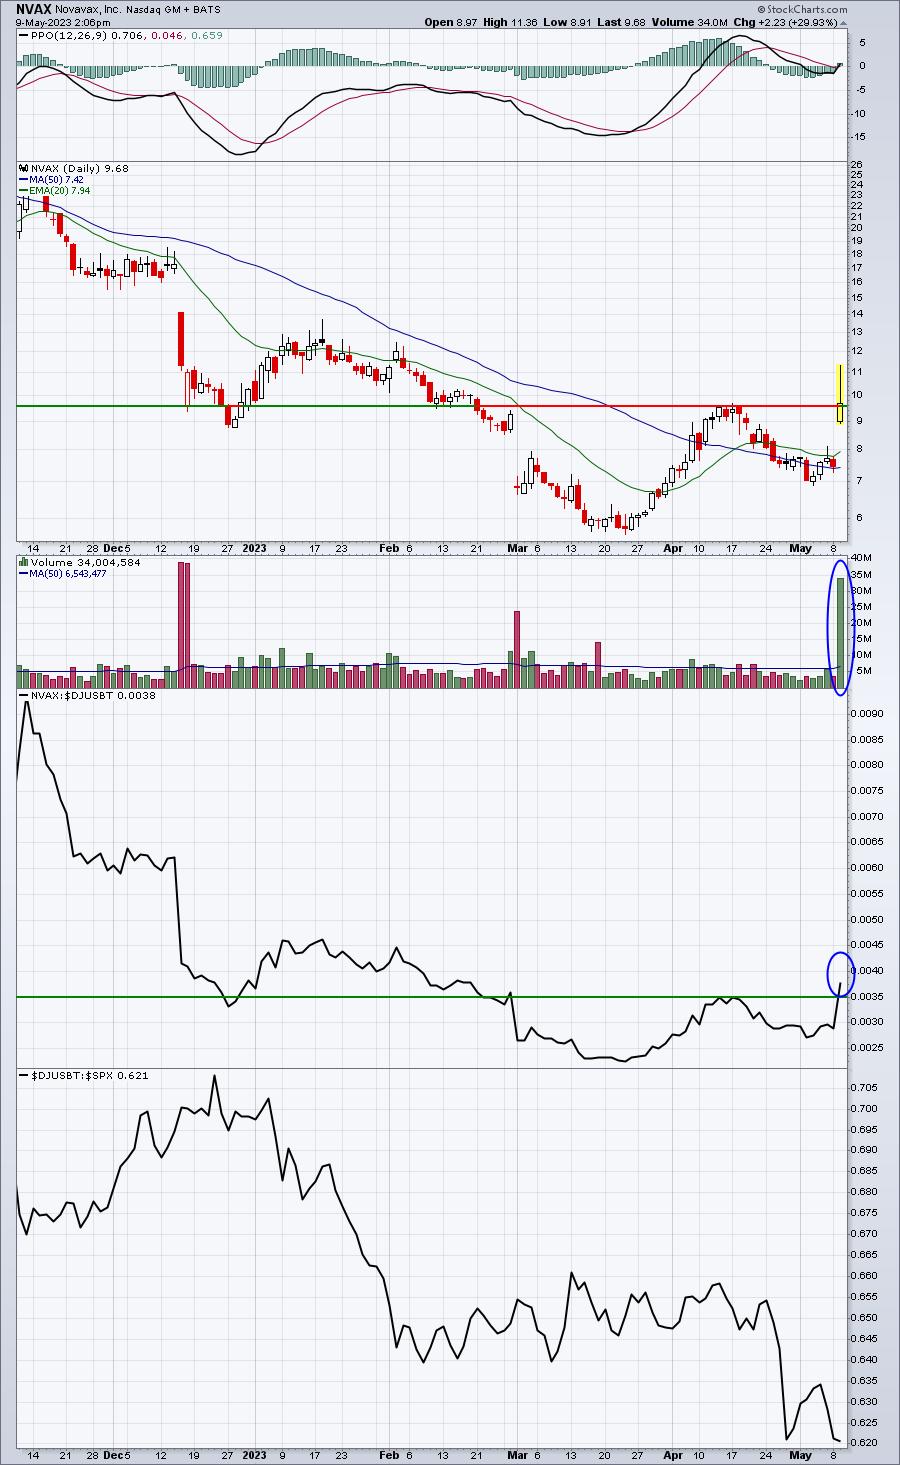
NVAX obviously has the necessary volume to trigger a short squeeze, but where does this one finish today? Do we get the confirmed breakout? Or is it a failed attempt? The reversal this afternoon triggered my intraday stop and I took a loss. I might jump back in, if we see buying into the close and we get the breakout above resistance.
VUZI:
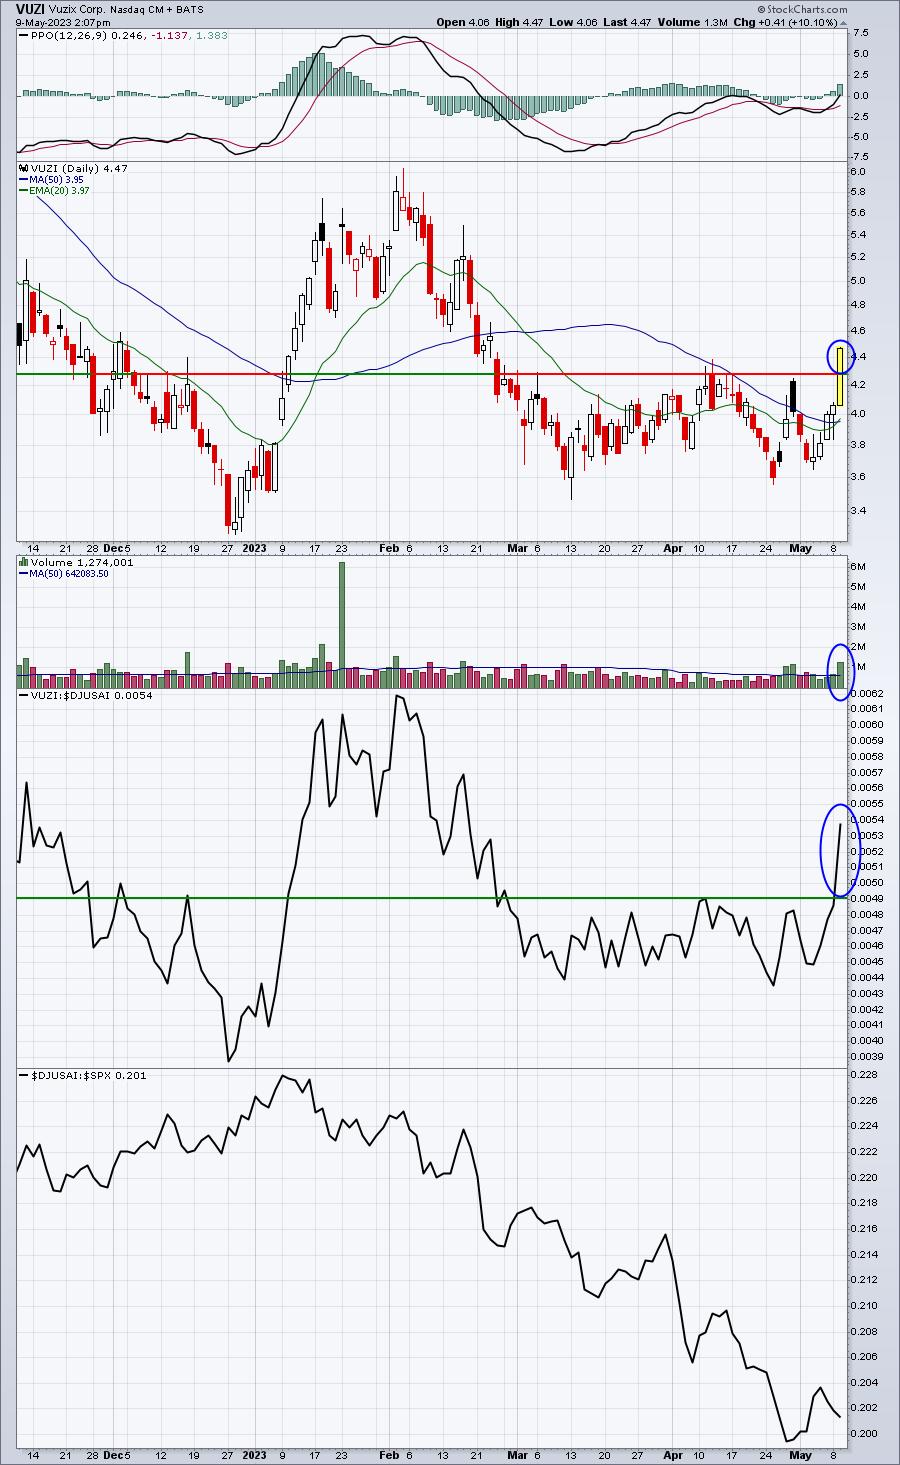
Like NVAX, how does VUZI close today? We certainly have the possibility of a short squeeze trigger in play as volume has jumped and we've cleared a key price resistance level. Volume is the highest we've seen since January. Anyone who has shorted VUZI the last 10 weeks or so is currently losing money. If it finishes strong, it'll put pressure on many of those shorts to cover (buy), potentially sending the price even higher. I'm holding for now, though I'd probably sell if the breakout reflected above doesn't hold into the close.
In the May Short Squeeze Report, issued earlier this month, I provided four stocks as potential short squeeze candidates, based on how they were trading at that time. The stocks were MSTR, IBRX, ZYXI, and TGTX. IBRX has been a tremendous winner, doubling over the past week or so.
IBRX:
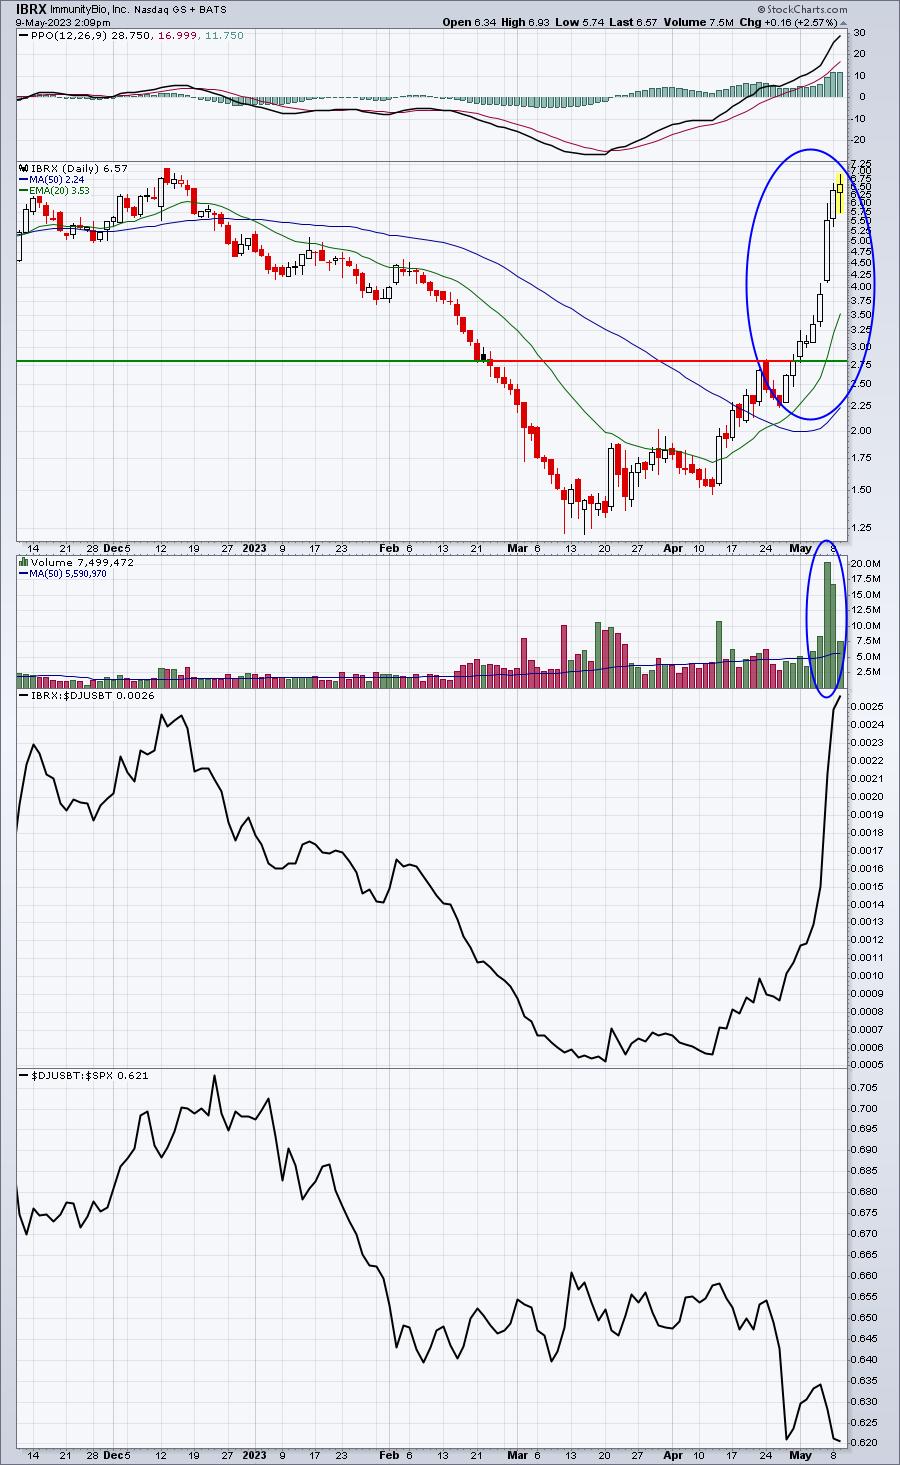
When it first broke out last week, the volume was increasing, but wasn't of the short-squeeze variety. That's changed over the past 3-4 days as volume has surged to accompany a massive run higher in price. Short sellers found the downside of shorting a stock into oblivion, particularly those that were late to the party and shorted a couple weeks ago.
Earnings Reports
Here are the key earnings reports for the next two days, featuring stocks with market caps of more than $10 billion. I also include several companies with market caps below $10 billion. Finally, any portfolio stocks that will be reporting results are highlighted in BOLD. If you decide to hold a stock into earnings, please understand the significant short-term risk that you are taking. Please be sure to check for earnings dates for any companies you own or are considering owning.
Tuesday, May 9:
DUK, ABNB, APD, OXY, TDG, ALC, EA, APO, CHT, GFS, CPNG, RPRX, EC, WAT, EDR, FOXA, AXON, J, WMG, WYNN, BSY, AKAM, RIVN, EXAS, CE, HSCI, AGL, COTY, MASI, TWLO, CTLT, ARMK, OVV, CELH, CHH, KGC, TPX, NTRA, IGT, PRGO, HRB, DUOL, ATKR, SWX, SQSP, TWNK, UA, LNC, LITE, ZD, DOCN, RVNC, RPD, AFRM, ARRY, APPN, SHOO, RNG, OLPX, GH, MQ, BOOT, CRCT, CARG, ZIP, SILK, VZIO, BLDP, OTLY, ANGI, MODN, IRBT, CRNC, UPST
Wednesday, May 10:
DIS, HMC, MFC, NTR, TTD, LI, RBLX, STE, SRAD, IEP, BAM, DOX, TEVA, PFGC, FLEX, JAZZ, U, HOOD, TTEK, ALGM, RBA, VVV, MLCO, REYN, WEN, DV, CR, PAAS, HL, TGNA, CPA, NOMD, VERX, VSH, BCO, SONO, ALRM, NUVA, GDRX, CRSR, CAKE, VCEL, SKIN, EVRI, MGNI
Economic Reports
None
Happy trading!
Tom