
EB Daily Market Report - Wednesday, May 10, 2023
Live Event Today
At 4:30pm ET, we'll be hosting our "Sneak Preview: Top 10 Stock Picks" event. This is an opportunity to better understand how we develop our portfolios, and which 10 stocks to include in each for the upcoming 90 days. I'll be discussing many of the current themes that I'll be keeping in mind when making the portfolio selections.
It should be a very educational event, so I can hope you can join me. For those who cannot make the event live today, we'll make sure that you receive the recording to review at your convenience.
Executive Market Summary
- Futures were down overnight, but turned positive when the April CPI was released
- Inflation came in as expected, reversing concerns and a higher Volatility Index ($VIX) of late
- The VIX is down 5.25%, below 17, as fear continues to abate - bad news for those in the bearish camp
- Commodities are mostly lower with crude oil ($WTIC, -1.44%) back down to $72 per barrel, while gold ($GOLD, -0.24%) falls modestly, though it still remains well above $2000 per ounce
- The 10-year treasury yield ($TNX) has dropped more than 7 basis points to 3.45% in response to the in-line CPI data
- Technology (XLK, +1.39%) and communication services (XLC, +1.09%) are among today's leading sectors as growth dominates value stocks
- Weakness is found primarily in energy (XLE, -0.87%) and financials (XLF, -0.46%); banks ($DJUSBK, -0.63%) continue to drift beneath their 20-day EMA, searching for a permanent bottom
- A big earnings-related move has sent Akamai Technologies (AKAM, +9.05%) to the top of the S&P 500 leaderboard
Market Outlook
We keep hearing more and more about an upcoming recession and a large majority of the investing public believes the stock market is heading lower. After all, if the economy is prepping for a big slowdown, or possibly even negative growth, that would be absolutely horrific in the near-term for stocks, especially growth stocks, right? Growth stocks' foundation is built on future growth ahead. If we forecast negative growth, growth stocks should get crushed. But I want you to take a minute and check out many of the growth ratios that we follow at EarningsBeats.com:
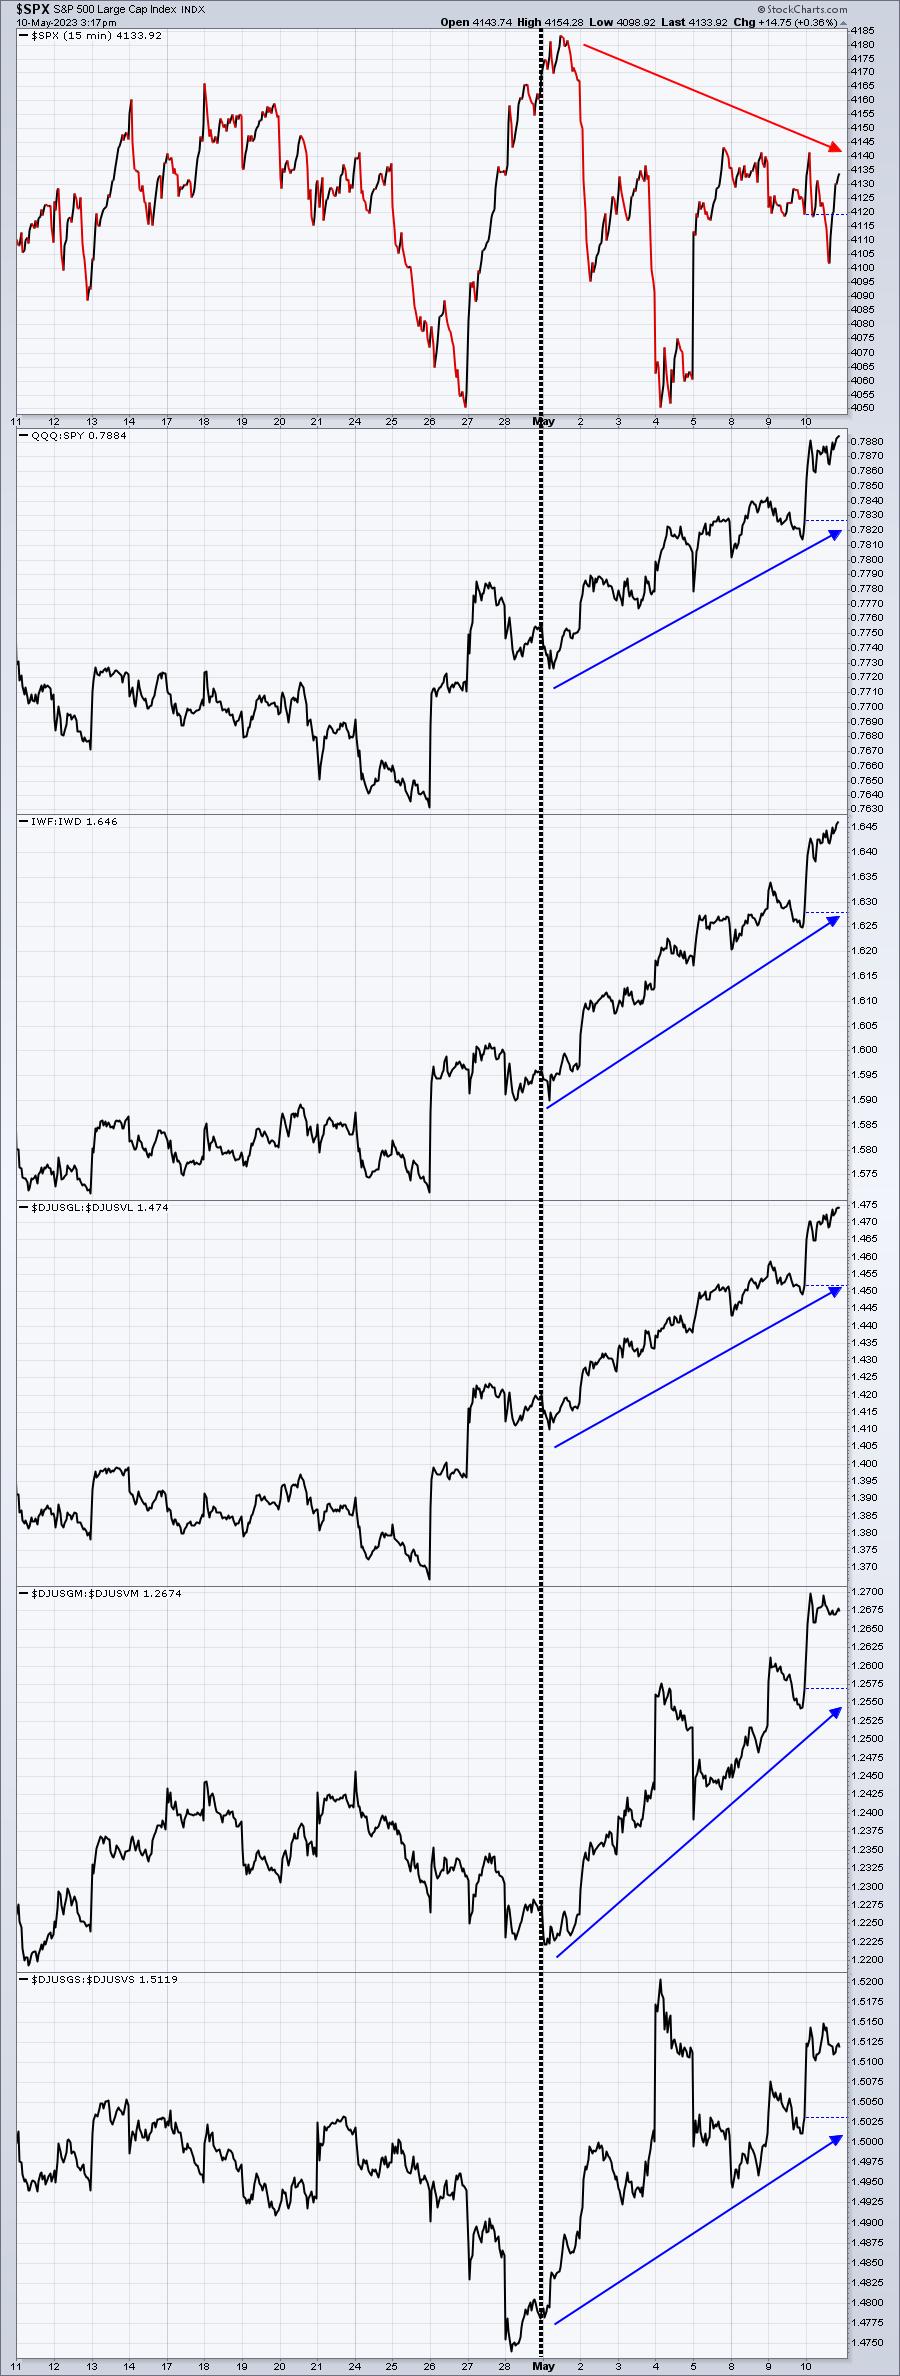
All over the internet and among media outlets everywhere, the talk has shifted to "go away in May". This is the time where the stock market struggles. While that's true to some degree, I've also shown you recent evidence that money rotates into growth during the next 4 months more so than at any other time of the year. Now look at the chart above again. Yes, the S&P 500 has declined so far this month. But can't you visualize what's really happening? Money is rotating from value into growth as ALL of my key growth vs. value ratios are soaring in the first 10 days of May. Is CNBC reporting on this phenomenon? If they were truly interested in educating their audience, wouldn't this be all over the news?
I know I rant continuously about the media, but for good reason. Not only do I believe their information is misguided in most instances, I also believe it's intentional. Outlets like CNBC are financially "in bed" with the big Wall Street firms. I believe Wall Street uses big media outlets like CNBC as their little puppet, spreading the narrative they want to spread, while using their financial power and conflict of interest to simultaneously "steal" from the unsuspecting public. You can believe what you want to believe, but this is why I approach the stock market the way I do - accepting nothing as truth until I can prove it myself.
Sector/Industry Focus
One missing ingredient for the bullish stock market case is the lack of relative strength among consumer discretionary stocks (XLY) vs. their staples counterparts (XLP):
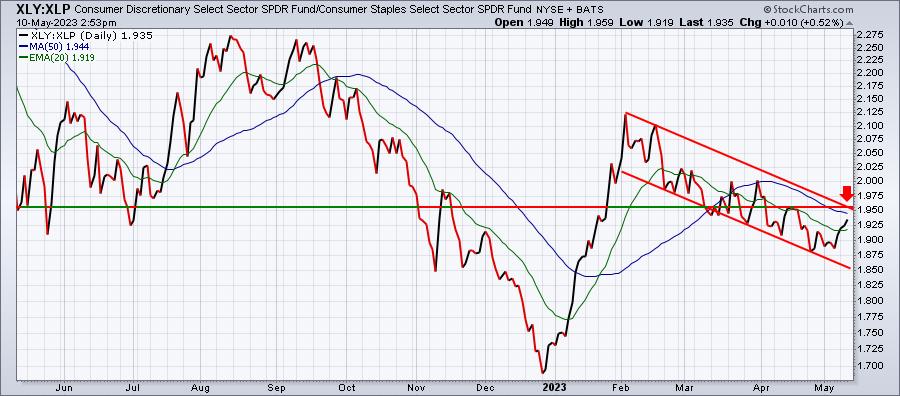
You should know by now that I believe stocks have been heavily manipulated over the course of the past year. The chart above has been manipulated, in my opinion, as this chart includes gap downs. The "intraday" XLY:XLP, where I use a User-Defined Index at StockCharts.com to track relative strength, excluding gaps, shows a much different and much more bullish picture. Still, seeing the XLY:XLP chart above break above 1.95 would start to turn this chart around. One area that could provide some credence in this area would be specialty retail ($DJUSRS):
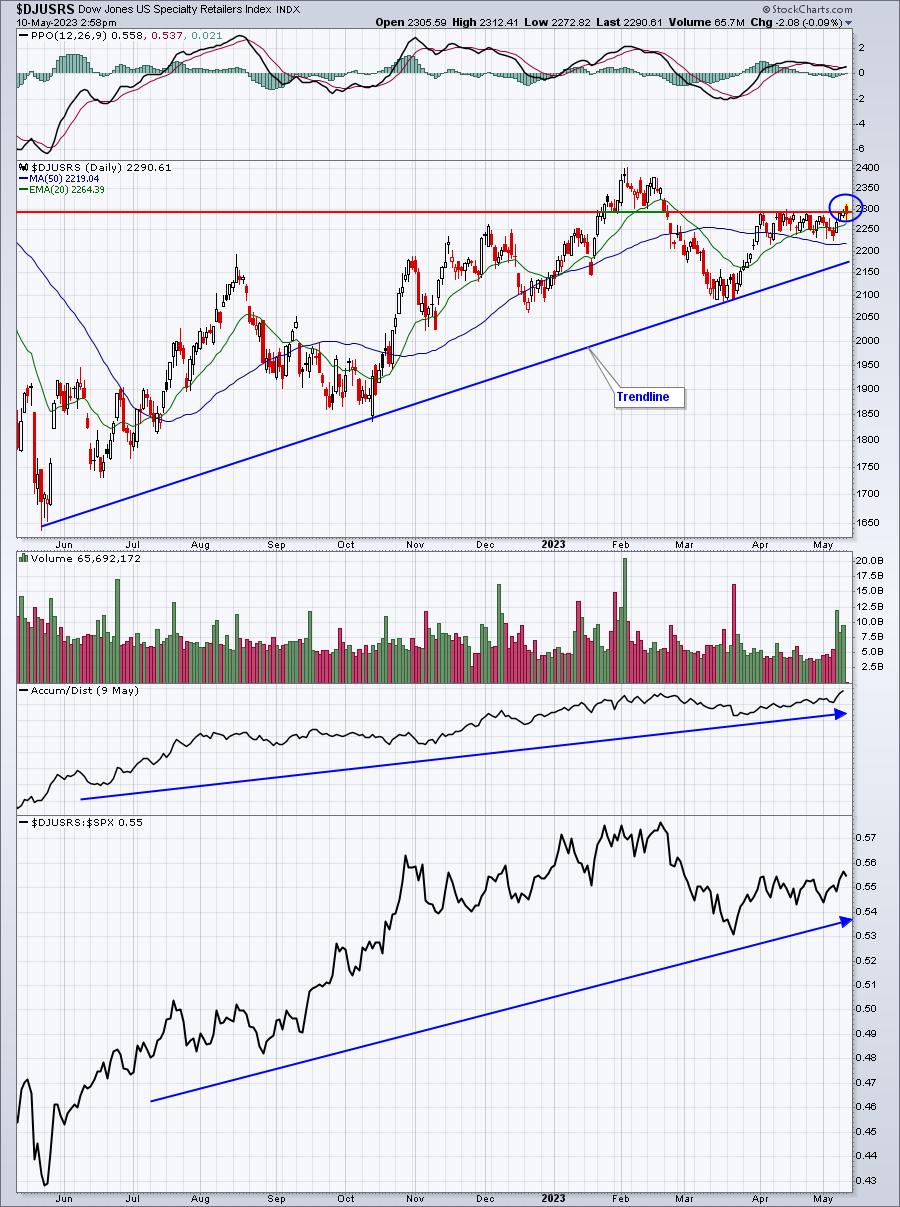
The DJUSRS is just now breaking above a key area of congestion and price resistance. If we get follow through from here, it would certainly provide a boost to the XLY.
ChartLists/Strategies
I spent time looking at specialty retail stocks ($DJUSRS) on our various ChartLists to see if any might be in a position to benefit from a surge in the DJUSRS. I found one really big winner over the past year that I saw testing key short-term price support. That stock is Ulta Beauty, Inc. (ULTA). I took a position in it when it hit 501, testing the low from March 17th. We did temporarily dip to 497 this morning, but could be starting to rebound. I believe you can keep a very tight stop on ULTA - I'll sell it if it closes beneath 500 today. So I'm talking a VERY tight stop here. I like to see potential false breakdowns on healthy stocks as this is an area for market makers to accumulate before the next leg higher. Check out this daily chart:
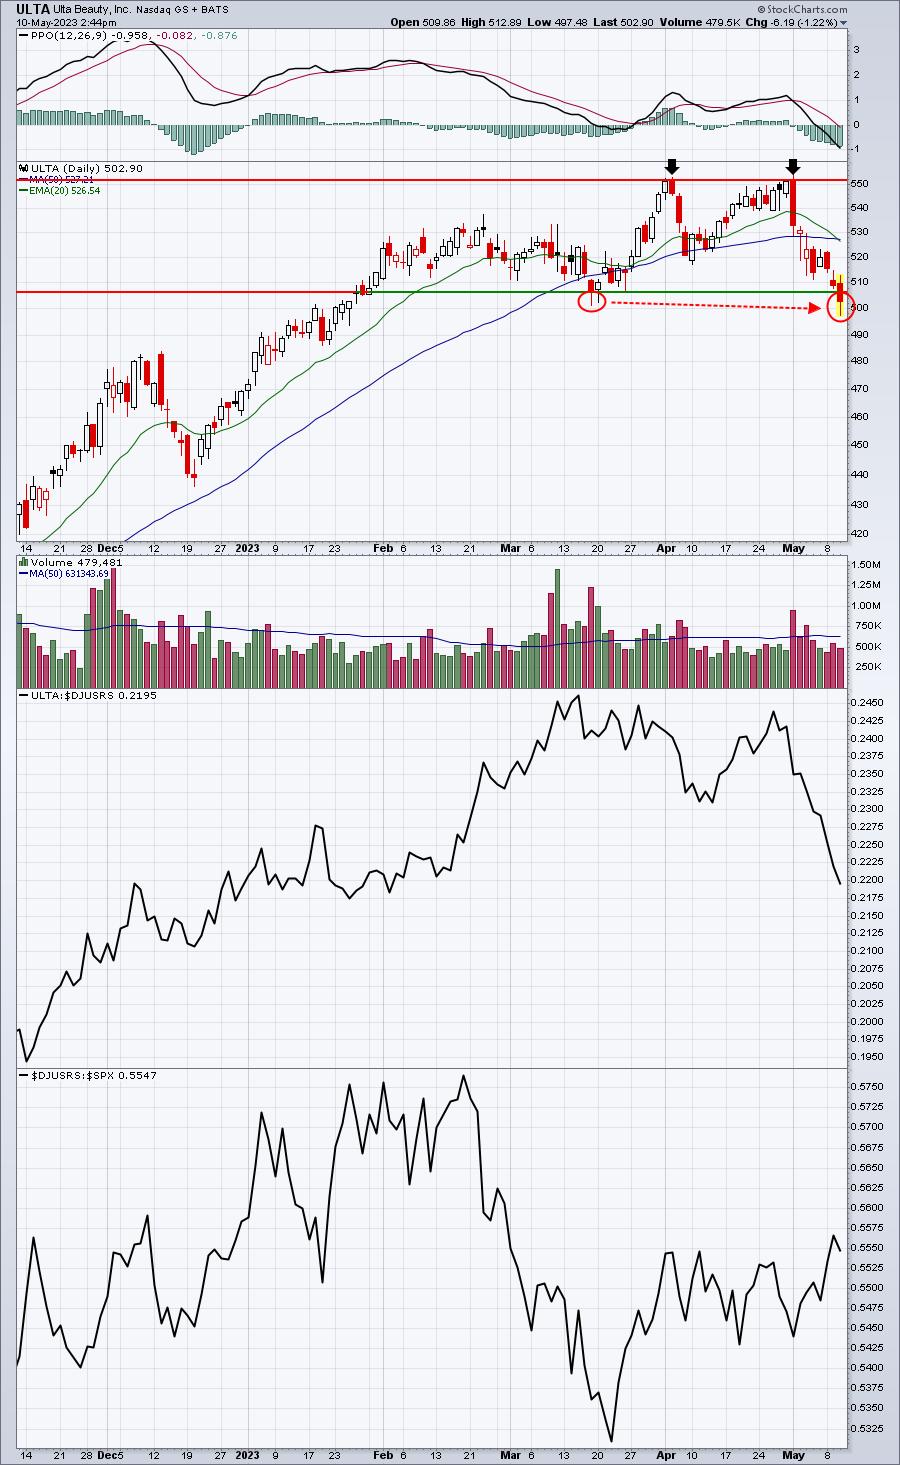
If ULTA can close back above 506.46, it would be even more bullish, holding onto closing support from March 17th. In the meantime, I also liked the positive divergence that's formed on the hourly chart:
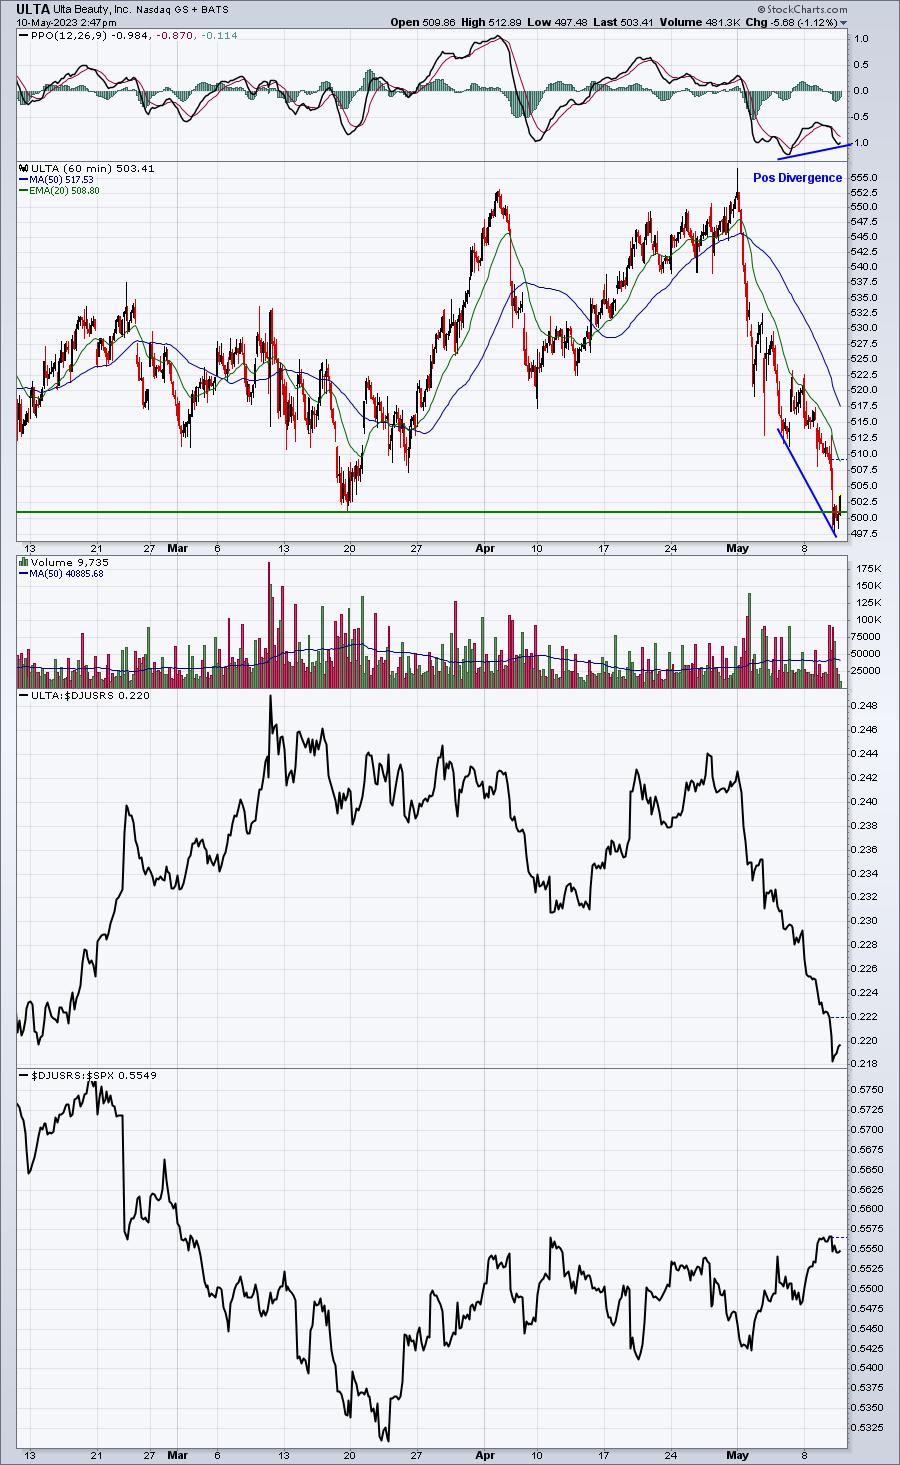
The timing to go long could be absolutely perfect.....and if it isn't, we can keep a very tight stop in place.
Earnings Reports
Here are the key earnings reports for the next two days, featuring stocks with market caps of more than $10 billion. I also include several companies with market caps below $10 billion. Finally, any portfolio stocks that will be reporting results are highlighted in BOLD. If you decide to hold a stock into earnings, please understand the significant short-term risk that you are taking. Please be sure to check for earnings dates for any companies you own or are considering owning.
Wednesday, May 10:
DIS, HMC, MFC, NTR, TTD, LI, RBLX, STE, SRAD, IEP, BAM, DOX, TEVA, PFGC, FLEX, JAZZ, U, HOOD, TTEK, ALGM, RBA, VVV, MLCO, REYN, WEN, DV, CR, PAAS, HL, TGNA, CPA, NOMD, VERX, VSH, BCO, SONO, ALRM, NUVA, GDRX, CRSR, CAKE, VCEL, SKIN, EVRI, MGNI
Thursday, May 11:
PBR, BN, JD, ING, SLF, TEF, PKI, NICE, ENTG, GEN, NWS, CRL, TPR, USFD, CYBR, HAE, YETI, ATHM, SANM, UTZ, DNUT, MARA, IAG, FVRR
Economic Reports
April CPI: +0.4% (actual) vs. +0.4% (estimate)
April Core CPI: +0.4% (actual) vs. +0.4% (estimate)
Happy trading!
Tom