
EB Daily Market Report - Friday, May 12, 2023
Executive Market Summary
- Futures were higher overnight, but our major indices did sell off after the early morning gap higher
- Afternoon trading has turned a bit more bullish, but there are still losses
- Selling escalated at 10am ET, just after the May consumer sentiment came in well below expectations
- Crude oil ($WTIC, -1.04%) is down to $70 per barrel, though energy (XLE, -0.01%) is flat
- The 10-year treasury yield ($TNX) is up 6 basis points to 3.45%
- Defensive sectors utilities (XLU, +0.31%) and consumer staples (XLP, +0.30%) are the only sectors in positive territory
- Consumer discretionary (XLY, -1.02%) is the weakest sector as automobiles ($DJUSAU) and durable household products ($DJUSHD) are both down more than 2%
- First Solar (FSLR, +25.24%) is soaring after announcing a deal to acquire Swedish firm, Evolar, a maker of thin film used in solar panels
Market Outlook
Let's talk about leverage for a minute. Currently, I'm not holding any leverage for any length of time. I do, however, occasionally take on a bit of leverage intraday, based on all the research I've done over the past year about the afternoon buying that typically takes place. Therefore, if the QQQ is selling off in the afternoon, I've occasionally bought the TQQQ just for the final couple hours. Look at this 6-day 10-minute chart of the QQQ:
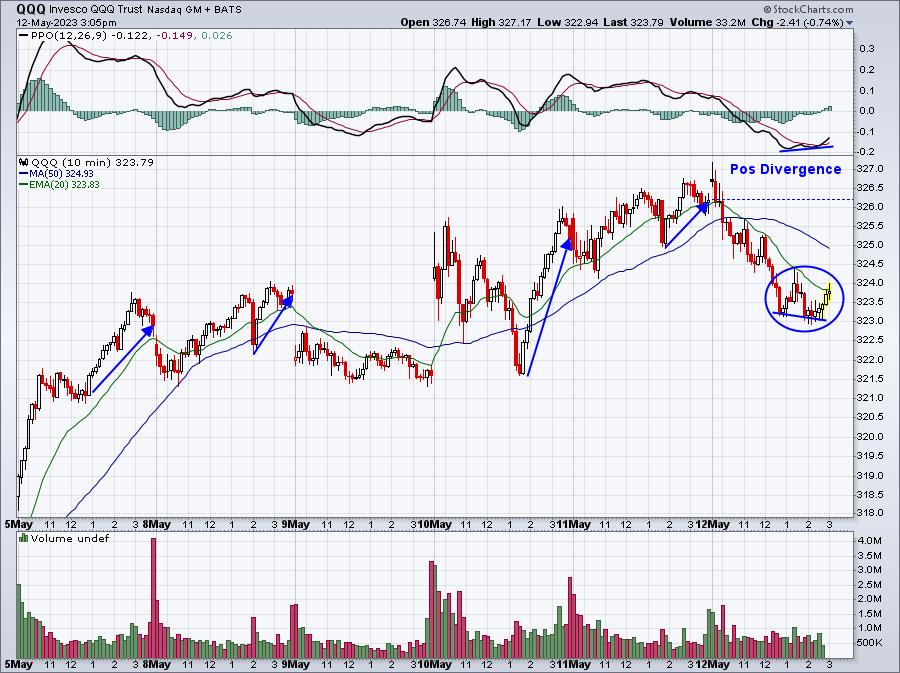
These are all of the trading days since the Fed-related selling we saw last Wednesday and Thursday. Afternoon buying was rather pronounced in all but one of the last six trading days. This pattern has allowed a bit of extra profit by leveraging during the final couple hours.
Sector/Industry Focus
Defense stocks ($DJUSDN) have certainly lost much of their 2022 luster. This group was leading throughout much of the cyclical bear market and the balance of 2022. Its relative strength line vs. the benchmark S&P 500 was in a steady uptrend. Note that as soon as the stock market turned to aggressive growth stocks, defense stocks completely fell apart on a relative basis. Based on what I see currently, I wouldn't have any interest in the DJUSDN until we reach price support in the 505-515 area:
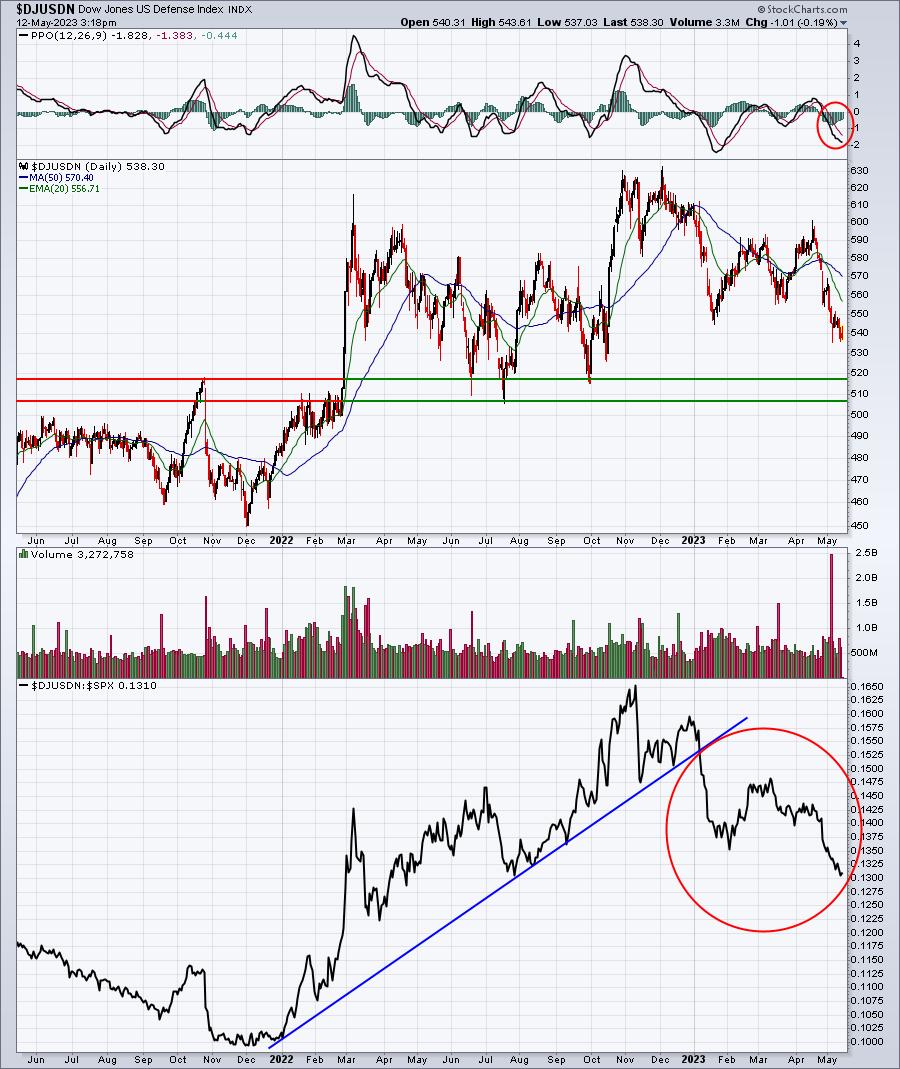
When new groups begin leading the S&P 500, there's an opposite effect somewhere else. In 2023, one of those opposite areas has been defense.
ChartLists/Strategies
I usually post charts here that look like solid buys, but determining when to sell is also a big part of successful trading - and it's probably the most difficult part for most traders. The first thing you need to determine is what type of trader are you? Do you prefer timing your entries right at price support, with the thought process that "this either goes up from here or I exit"? Or do you prefer swing trading, holding for a bit longer and allowing stocks more room to the downside? Just remember not to mix the two. If you're willing to provide more downside, then your mindset should be to have more patience to allow your stocks to run to the upside. Personally, I also have more confidence and allow a bit more downside room for the popular, large-cap stocks like Apple (AAPL), Microsoft (MSFT), Meta Platforms (META), NVIDIA (NVDA), Tesla (TSLA), Alphabet (GOOGL), Amazon.com (AMZN), etc.
In the current market environment, I tend to be a bit more on the short-term side of trading. I can get in and out in the same day, though I'm definitely NOT a daytrader. I prefer holding longer, but I'm a little gun shy, because of the whipsaw rotation that we've witnessed over the past 2-3 years. To me, ANY profit is a good profit. I also tend to get stopped out quicker as well, not willing to risk a lot of capital on trades. Most recently, I bought Ulta Beauty (ULTA) at 501, with the thought that I'd exit on a close beneath 500. I haven't taken profits yet, but I'm certainly considering it. One thing I'm watching is whether a 60-minute negative divergence develops over the next few days to a week, if a 20-day EMA test fails, and if a possible neckline emerges. Check out these two charts on ULTA:
ULTA (60-minute chart):
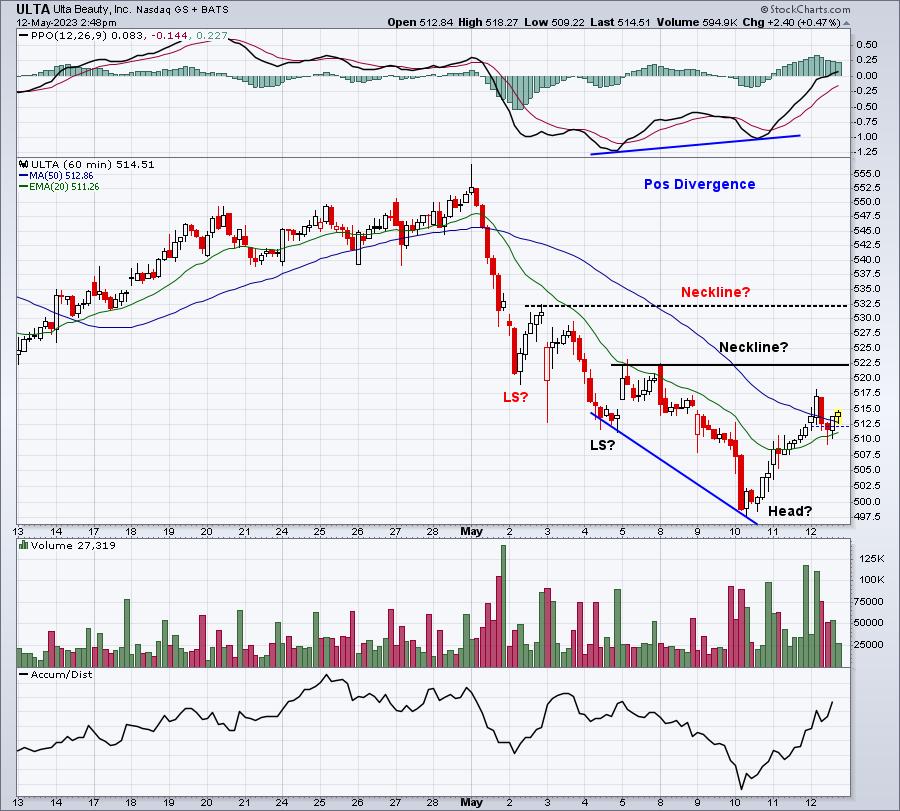
The hourly PPO is just now crossing centerline resistance, so obviously I don't have to worry about a negative divergence for now. But I've annotated a possible neckline at 522.50 and 532.50. I've looked at thousands and thousands of charts over the years and have a trained eye for the possible formation of patterns to take advantage of.
ULTA (daily chart):
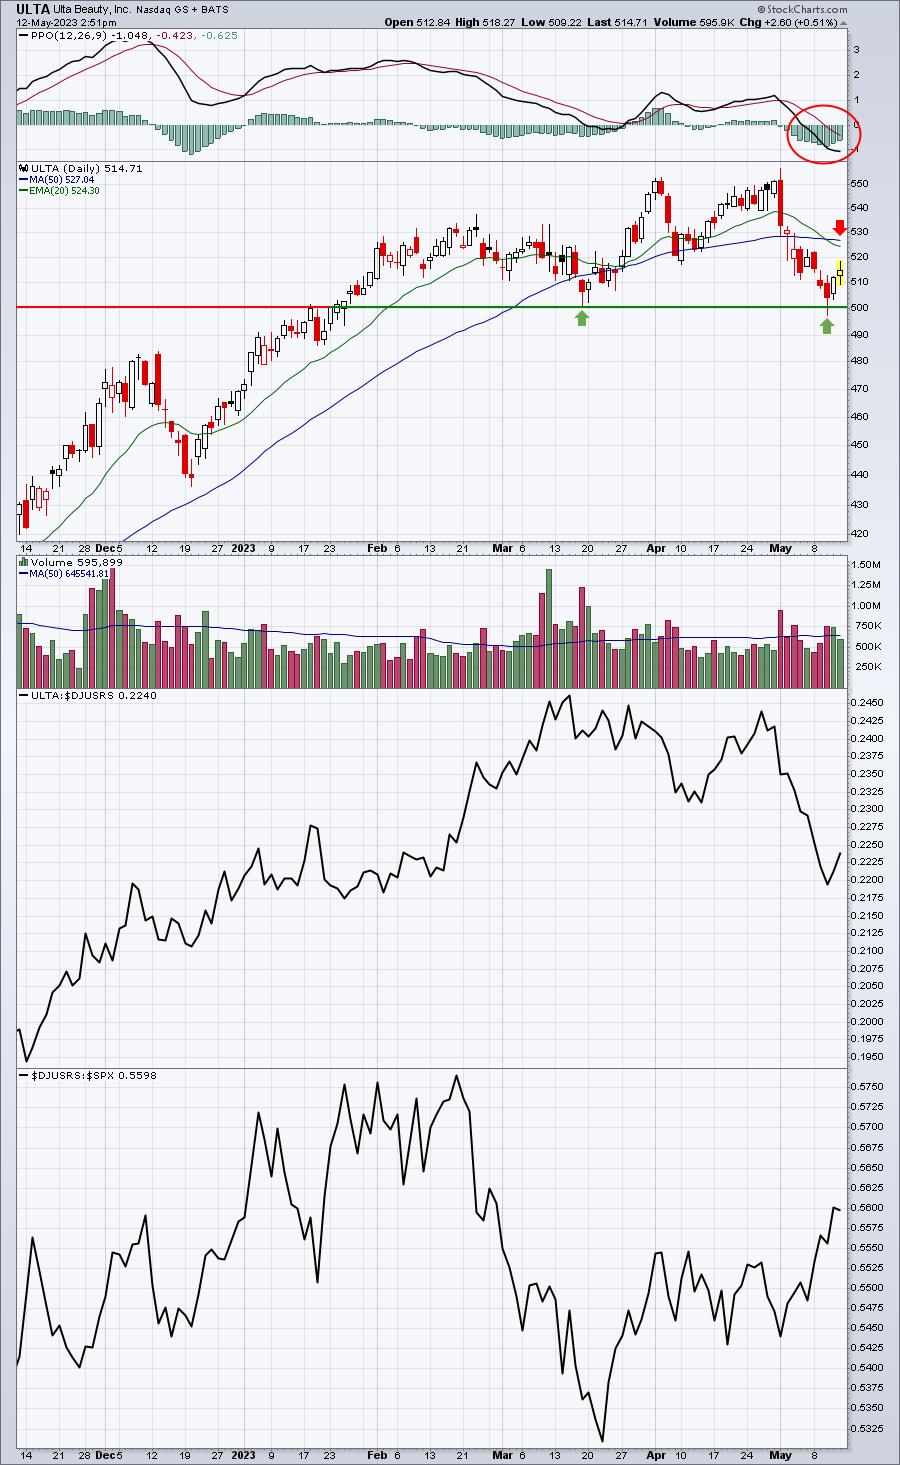
If we finish decently today and above the 50-HOUR SMA, that could propel ULTA up to challenge its 20-day EMA and 50-day SMA. Given the very bearish daily PPO (red circle), a test of the 20-day EMA would probably be enough for me to take profits. Keep in mind that the 20-day EMA is almost squarely at the initial neckline that I annotated on the 60-minute chart. I can always re-enter if ULTA can break above this 20-day EMA, but we have no guarantees that will happen. Again, I try to take profits at key levels when I'm given the opportunity. Hopefully, that'll provide you a little bit of perspective regarding my exit strategy.
Earnings Reports
Here are the key earnings reports for the next two days, featuring stocks with market caps of more than $10 billion. I also include several companies with market caps below $10 billion. Finally, any portfolio stocks that will be reporting results are highlighted in BOLD. If you decide to hold a stock into earnings, please understand the significant short-term risk that you are taking. Please be sure to check for earnings dates for any companies you own or are considering owning.
Friday, May 12:
CPG, SPB
Monday, May 15:
NU, XP, CTLT, MNDY, TSEM, NVTS
Economic Reports
May consumer sentiment: 57.7 (actual) vs. 63.0 (estimate)
Happy trading!
Tom