
EB Daily Market Report - Monday, May 15, 2023
ChartList Update
The following ChartLists have been updated and are available on our website currently (or will be later today):
- All Upcoming Earnings, including our Upcoming Earnings Relative Strength ChartList
- Strong Earnings ChartList (SECL)
- Strong Future Earnings ChartList (SFECL)
Your Daily 5 Video
I recorded a "Your Daily 5" video for the StockCharts TV 24/7 channel. I focused a lot on the growth performance of small and mid caps. It's been buried, because both asset classes have been weak. But, under the surface, I'm seeing very bullish rotation. I think you should check it out. You can CLICK HERE for the video. Also, help us out and like the video, please. That helps us get more exposure to potentially new investors/traders.
Thanks!
Executive Market Summary
- Futures were lower overnight, but turned positive before today's opening bell
- After a bit of morning weakness, strength has returned with small caps ($SML, +1.05%) and mid caps ($MID, +0.73%) leading, along with the NASDAQ ($COMPQ, +0.60%)
- Volatility ($VIX, +0.94%) is up, despite market strength, and that's something I'll be keeping an eye on in the days ahead; currently, however, there is no positive correlation other than today
- Cryptocurrencies seeing a slight rebound, with bitcoin ($BTCUSD, +1.76%) moving back above 27000
- The 10-year treasury yield ($TNX) up 4 basis points to 3.50%; we remain in a 3.27%-3.65% trading range
- Commodities are mostly higher on the session, with crude oil ($WTIC, +1.38%) up to $71 per barrel
- Mostly aggressive sectors are leading the action today, as financials (XLF, +0.80%) and technology (XLK, +0.70%) are among the leaders
- Meanwhile, defensive sectors are lagging as all four are the ONLY four in negative territory today - XLU, XLRE, XLP, and XLV are all down at last check
- Western Digital (WDC, +11.41%) is today's top S&P 500 performer as it's involved in merger discussions
Market Outlook
Small cap (IWM) relative momentum (vs. the S&P 500) is the strongest it's been since early March, with one exception in mid-April. I'm basing this on the relative PPO of the IWM:SPY ratio. Check this out:
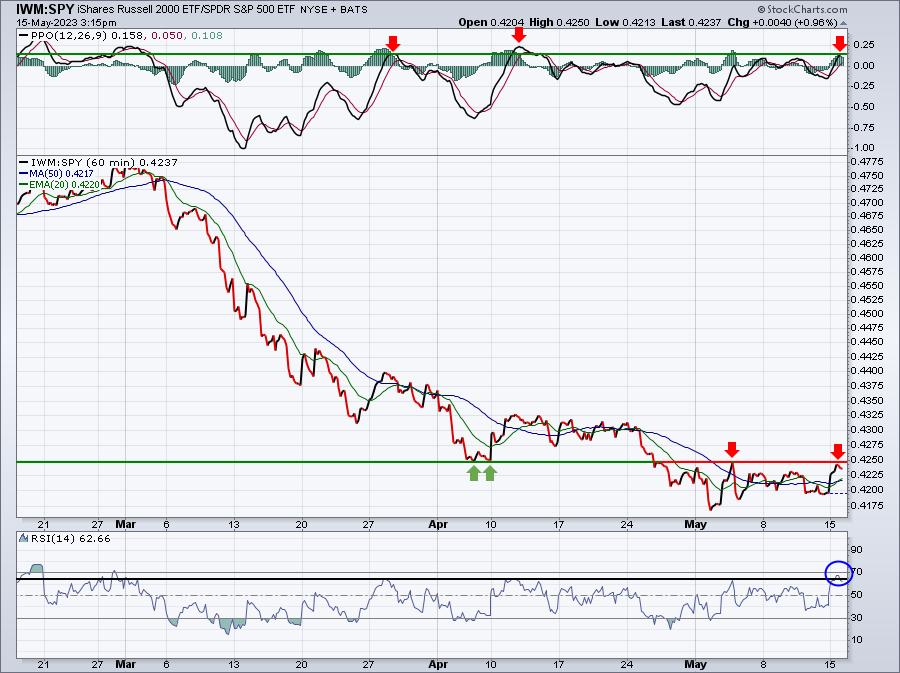
I've actually started building a leveraged position in small caps, using the TNA (3x bullish Russell 2000 ETF). The relative PPO is at its 2nd highest level since early March and the relative RSI neared 70 and hit its highest level since late February. This is an aggressive trade, without a doubt. The IWM has already printed a double bottom and it's just starting to show some relative strength, so I'm clearly taking a chance, but I like the reward to risk here. I still believe the IWM is in a bottoming formation. If it can clear 176, I think the TNA could really move to the upside. I'll add to my TNA if that occurs. Meanwhile, any drop back into the low 170s on the IWM and I'll add as well.
My belief is that the stock market is going to head higher and I believe the recent rotation into small cap growth ($DJUSGS) and mid cap growth ($DJUSGM) vs. their value counterparts, $DJUSVS and $DJUSVM) is a telling signal. We'll find out.
Sector/Industry Focus
Aerospace ($DJUSAS) had a big run higher to close out 2022 and open 2023, but it's rather obvious at this point that it's consolidating those big gains. I'm seeing what could ultimately prove to be a bullish symmetrical triangle continuation pattern. But we might have to weather a few back-and-forth periods, before we ultimately get the directional confirmation. Continuation patterns typically break out in the direction of the prior trend, which would be higher. That's what I'd expect, but it could be months before we see that breakout. Remember, many industrials LOVE the fourth quarter. This group could frustrate all summer, and then make a move later in the year. Here's the current chart:
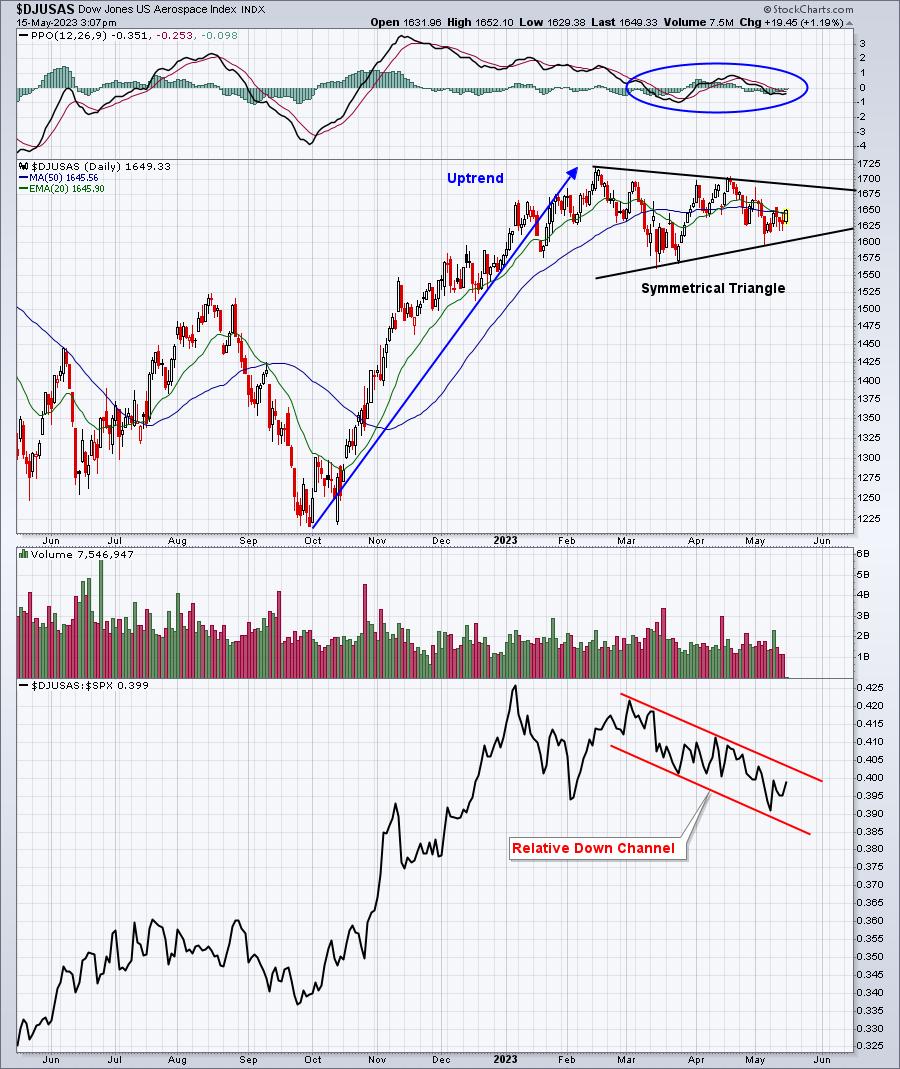
In addition to the possible continuation pattern, I'd also keep a close eye on the current relative downtrend in play. If the DJUSAS can't break this relative downtrend, it's not really a group I'll focus on. I need to see relative strength first.
ChartLists/Strategies
From our Downtrend Reversal scan:
IMVT:
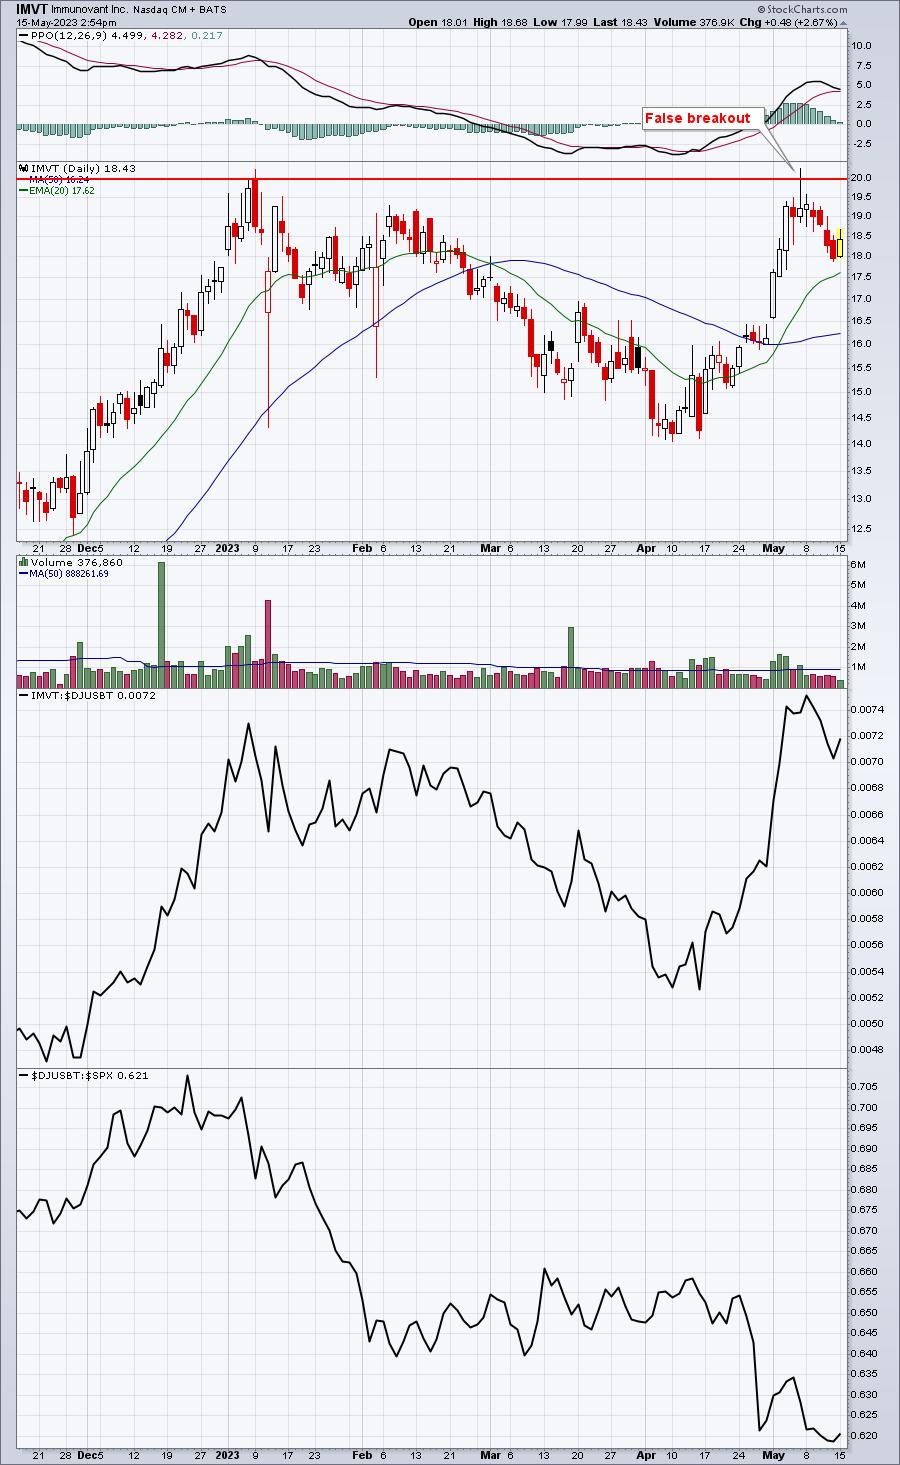
IMVT was pushing higher on solid volume, but had a false breakout at key price resistance. It's since pulled back, providing a better reward-to-risk setup. I'd prefer a 20-day EMA test, but setting a new high for the first time in over a week could be setting this one up for a further advance.
MLCO:
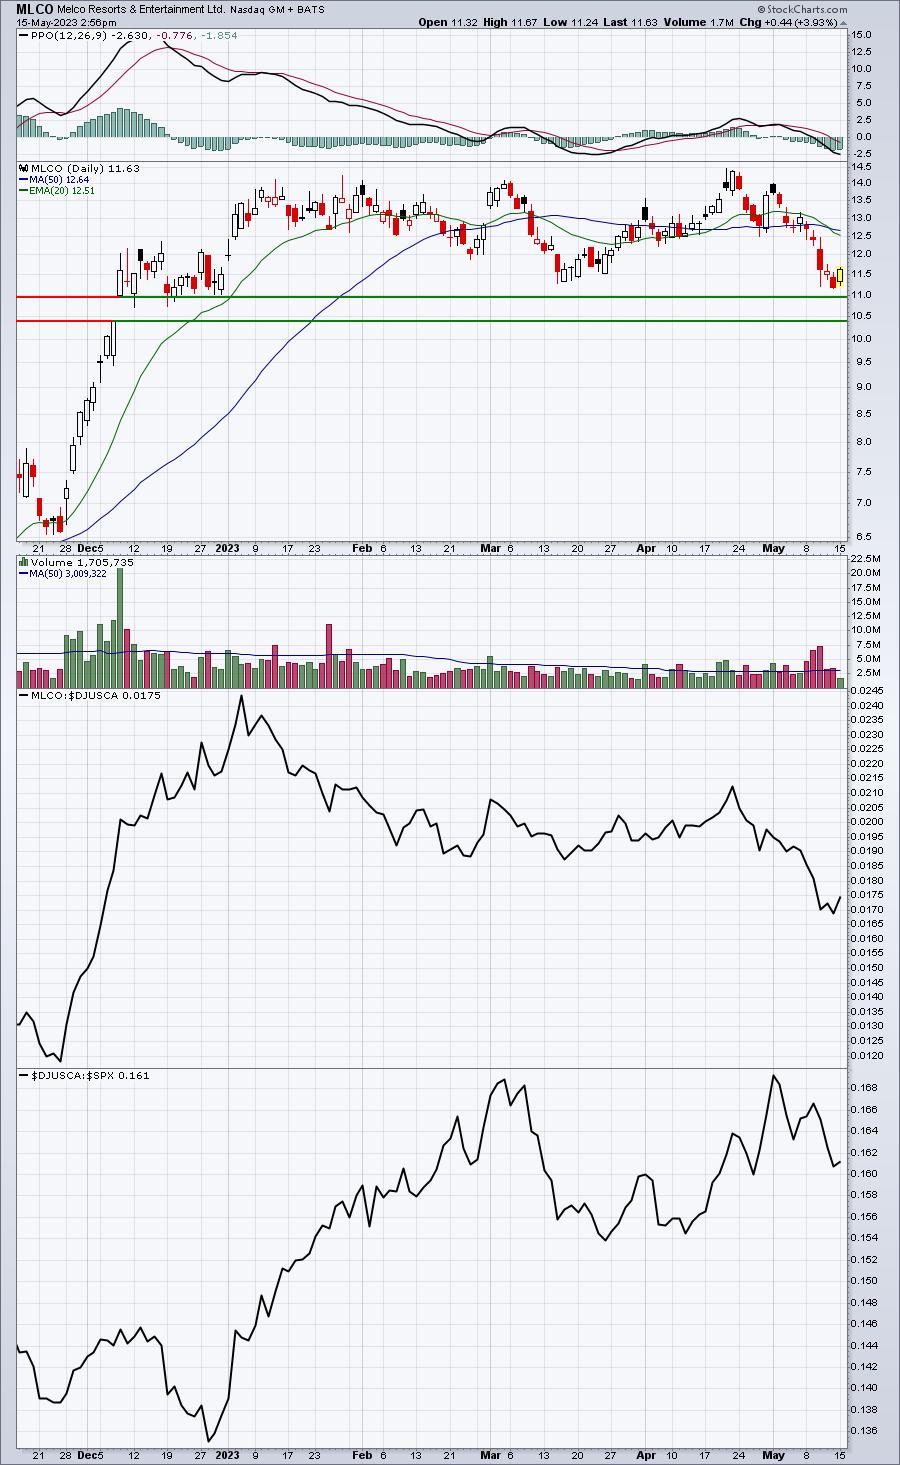
With a trading range recently from 11.00 to 14.50, MLCO also seems to be set up better for a solid reward-to-risk entry given today's reversal.
ITGR:
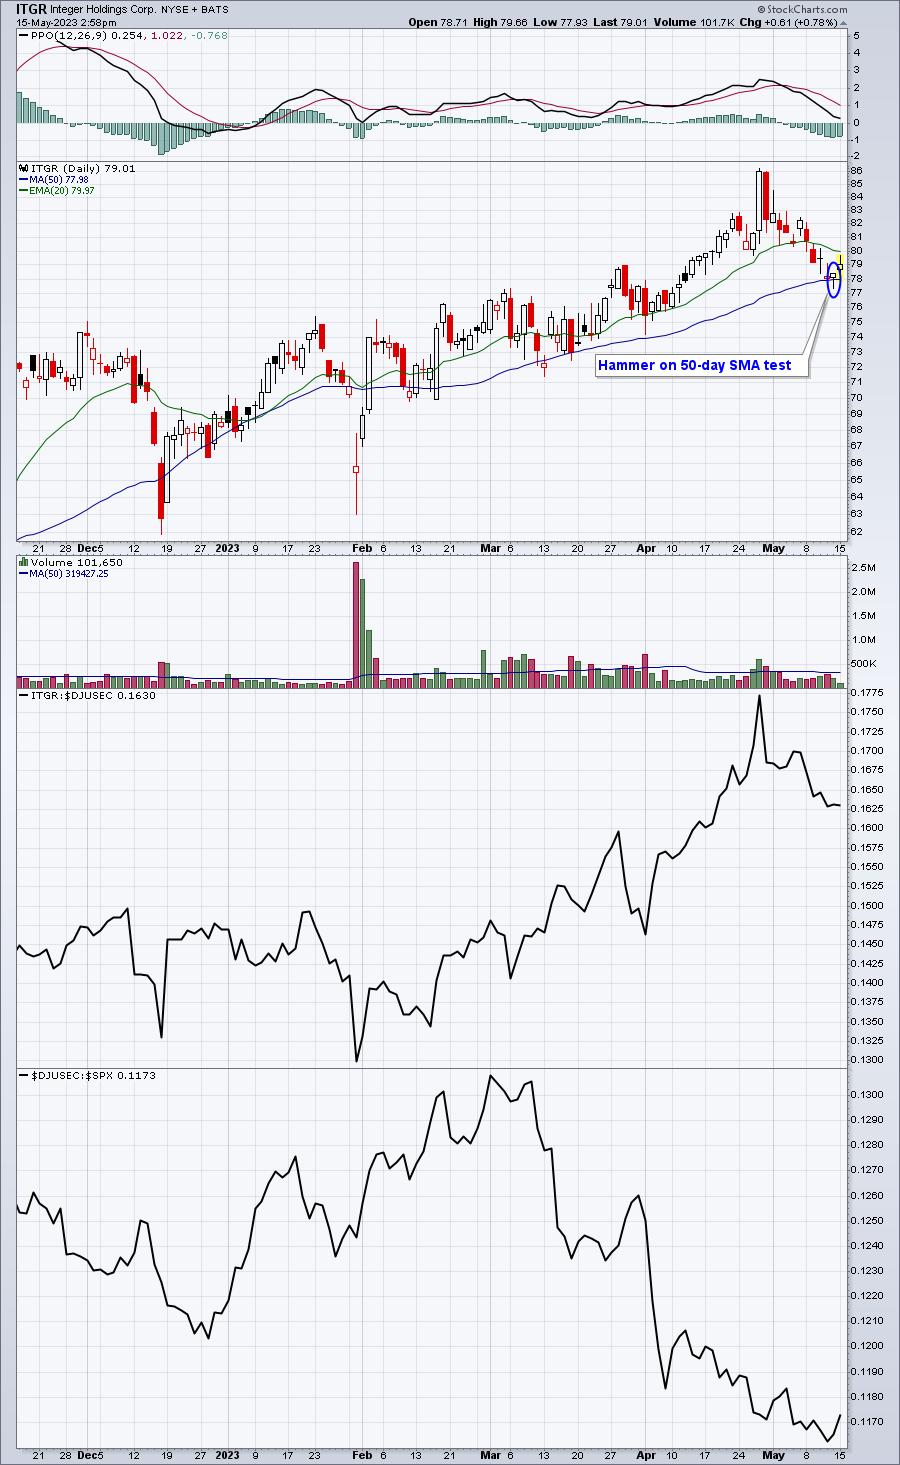
Could the reversal off the 50-day SMA be setting up ITGR for a possible right side of a cup? Perhaps. I like the reversal off of a key moving average.
Earnings Reports
Here are the key earnings reports for the next two days, featuring stocks with market caps of more than $10 billion. I also include several companies with market caps below $10 billion. Finally, any portfolio stocks that will be reporting results are highlighted in BOLD. If you decide to hold a stock into earnings, please understand the significant short-term risk that you are taking. Please be sure to check for earnings dates for any companies you own or are considering owning.
Monday, May 15:
NU, XP, CTLT, MNDY, TSEM, NVTS
Tuesday, May 16:
HD, SE, BIDU, CPRT, KEYS, ONON, TME, DOCS, IQ, AGYS, NXGN
Economic Reports
May empire state manufacturing index: -31.8 (actual) vs. -2.0 (estimate)
Happy trading!
Tom