
EB Daily Market Report - Special Report - Tuesday, May 16, 2023
Spring Special Starts Thursday
I certainly hope that EarningsBeats.com has helped each of you navigate what's been a very difficult stock market. We've made several spectacular calls throughout the trade war, 100-year pandemic, a series of large Fed rate hikes, a period of significant inflationary pressure, and other difficult economic challenges. We do research that's current and is like no other service anywhere - that I'm aware of. I understand what makes the stock market tick and, while remaining mostly bullish, I've shown conviction on the bearish side when it's been necessary. I call what I see.
Our Spring Special provides the best pricing you'll ever see on our market guidance, research, and education platform. For the value we offer, I don't think there's a better opportunity on the planet. Our Spring Special begins in just two days, and I truly hope you'll take us up on our very generous offer. We want you to be a satisfied customer and we also want to make sure you take advantage of our absolute best deal. It's just two days away and we're prepared to offer you a deal that gets better and better the longer you commit to EB membership.
Thanks for your loyalty and support and we hope to serve you for many years to come!
Max Pain Event Today
We'll be hosting our monthly Max Pain event today at 5:00pm ET. I view this monthly exercise as a "risk analysis" event. It never should be construed to provide us guarantees. Rather, we should be looking to evaluate risk and whether the risk is worth the potential reward, given what we know about monthly options expiration. I hope you can join me later today. Room instructions will be sent out in a separate email, and the event will be recorded for those of you unable to attend live.
I'm currently prepping for today's event, so I wanted to give you a "special report", providing you a bit of long-term perspective, something that I believe most traders overlook or ignore.
Broken Price Resistance = Price Support
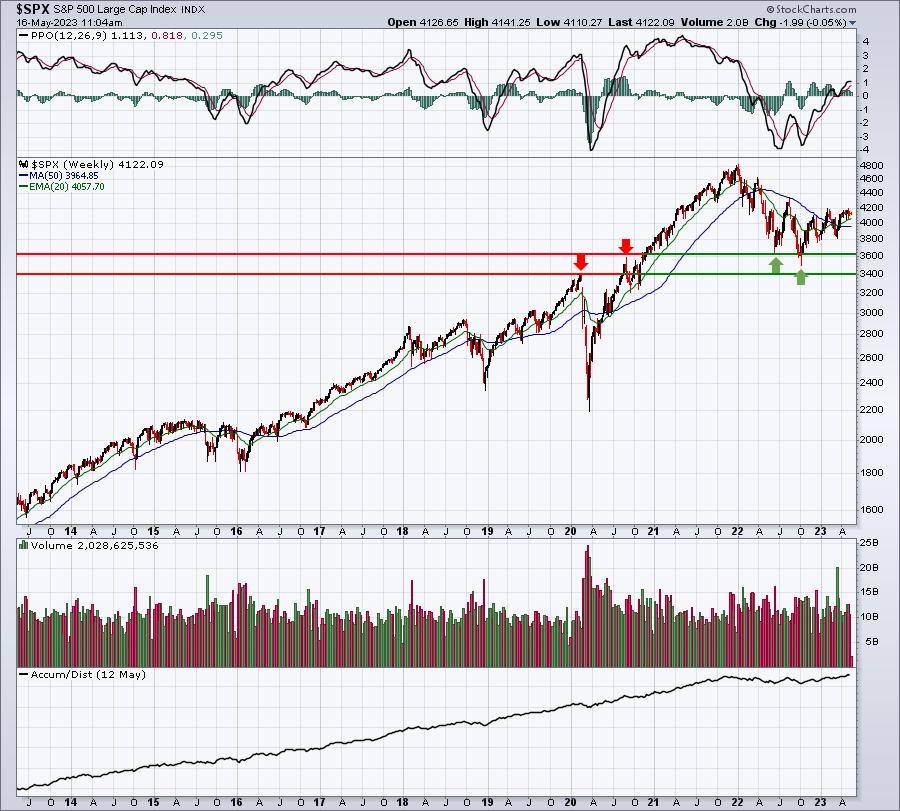
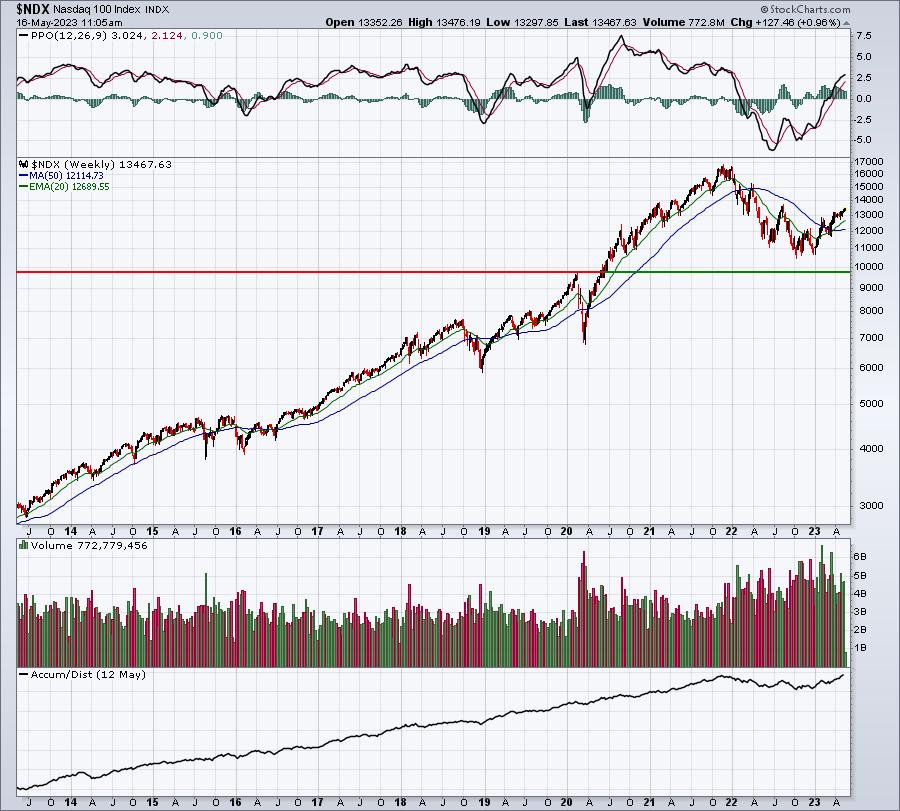
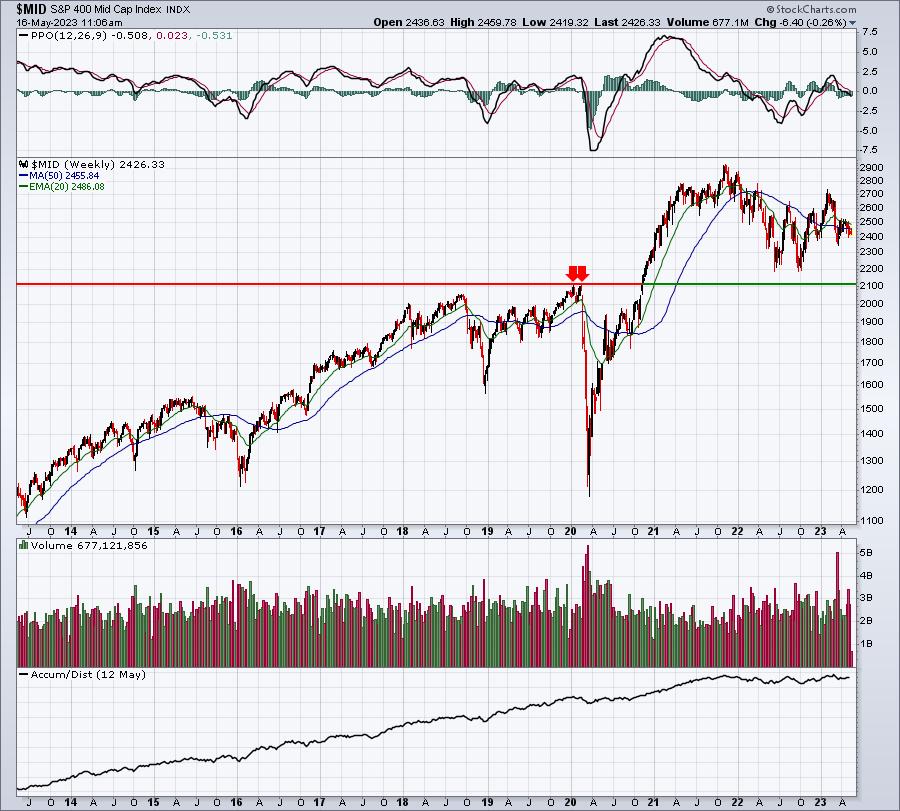
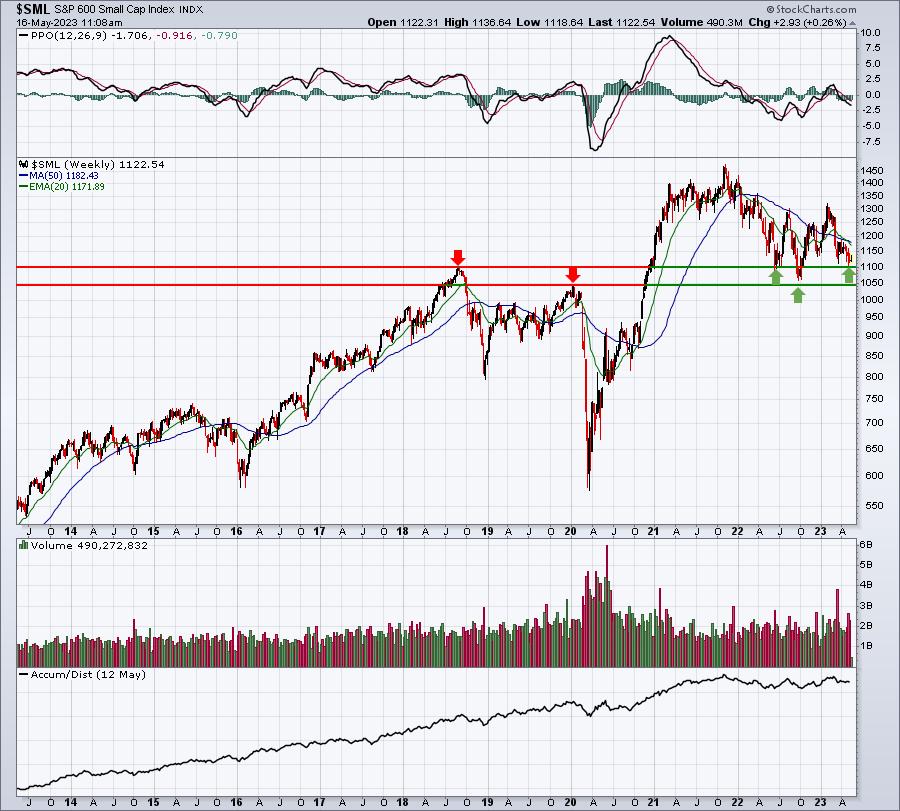
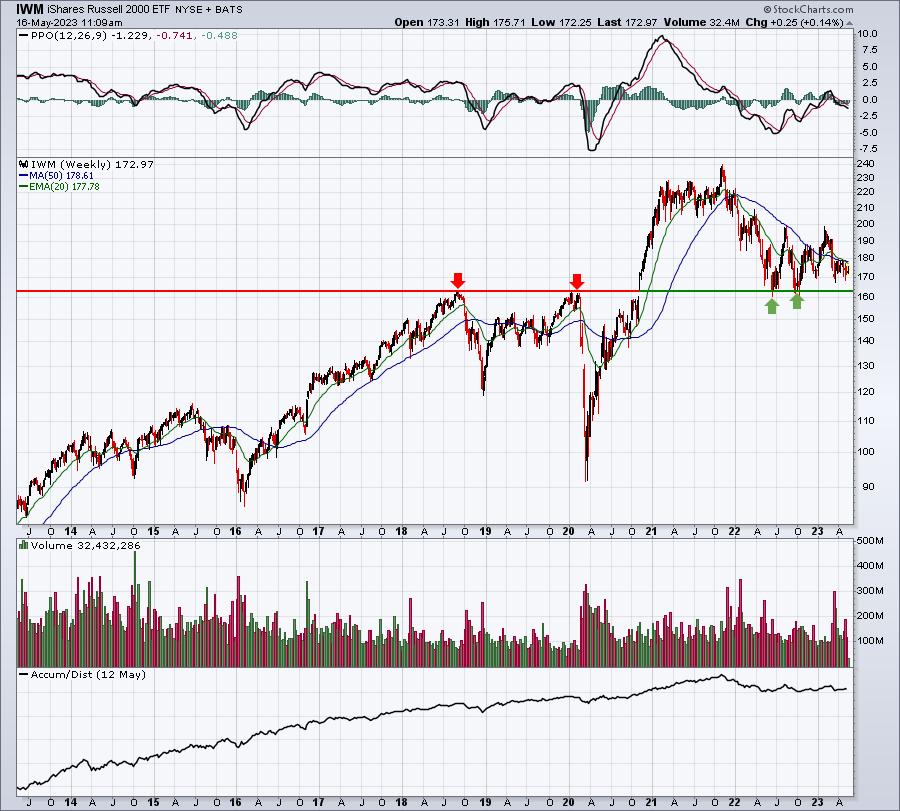
This is Technical Analysis 101 and many traders are aware of it on a short-term basis, especially on the intraday or daily charts. But it should absolutely be applied on a long-term basis as well. I believe it's one way to understand why the current underperformance of small caps and mid caps shouldn't be taken too seriously at this point. Below is a long-term perspective on "broken price resistance = price support":
S&P 500:
NASDAQ 100:
S&P 400 Mid Cap:
S&P 600 Small Cap:
Russell 2000 ETF (IWM):
Semiconductors ($DJUSSC):
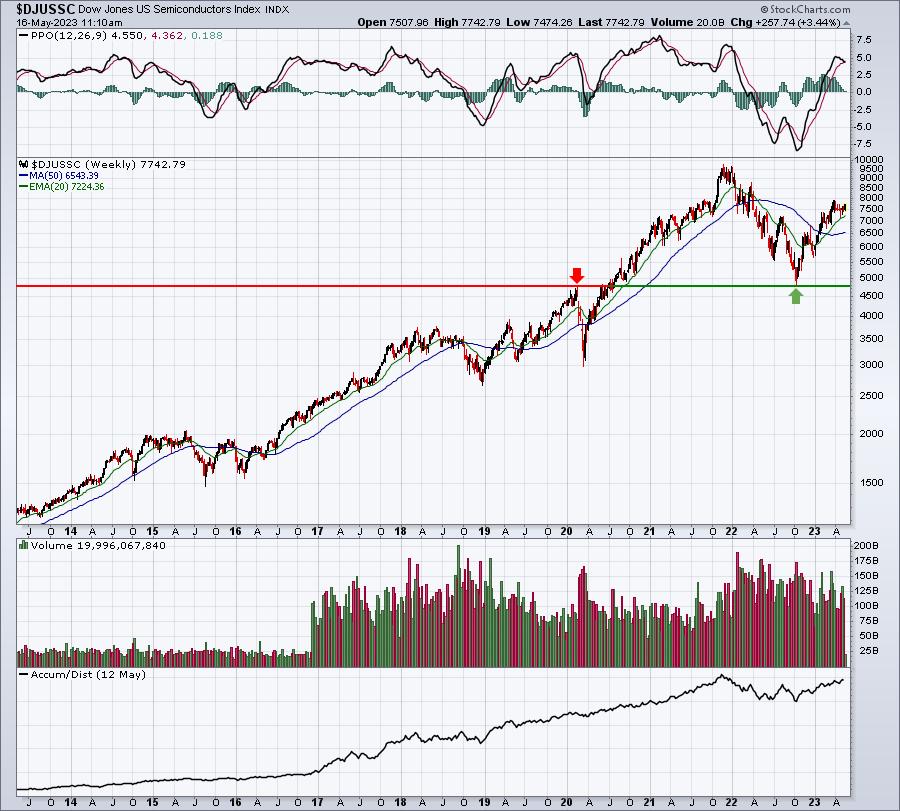
When I look at these charts, it's much easier for me to consider an investment in small caps. From a longer-term perspective, the IWM remains in a very solid uptrend. Its retest of its late-2020 breakout was nearly perfect. I'd argue this is a GREAT time to consider the IWM. That's one reason why I started building a position in the TNA, which is a leveraged 3x ETF designed to track the IWM. I like the TNA down to 170 or so. Also, as the QQQ approaches the August 2020 high, there's overhead price resistance to consider. Throw in the fact that it's been the strongest area of the market and we're just 3 days away from May options expiration, and it makes sense from a risk perspective to dial down the QQQ investment - at least for now - and perhaps add some small cap exposure.
But you do have to understand that the QQQ is dominated by technology (XLK), consumer discretionary (XLY), and communication services (XLC). These 3 sectors represent 79.82% of the QQQ, while these 3 sectors make up just 25.56% of the IWM. The IWM, on the other hand, is led by health care (XLV), industrials (XLI), and financials (XLF), which represent 49.68%. These areas are less likely to be impacted by options expiration.
Clearly, the QQQ is showing much more technical strength and it remains my preference, but in the very near-term, it would seem the IWM presents the lower risk. Just my two cents.
More Evidence The Secular Bull Market Is Resuming
Those of you who have followed me for awhile know that I LOVE to display the extremely long-term chart of the S&P 500. I think 100 years qualifies as extremely long-term. It's quite honestly one of my favorite charts to help guide me through market turmoil. It brings everything into perspective. Many cyclical bear markets that feel like our universe is collapsing is nothing more than a blip on this 100-year chart. Again, it's all about perspective. That's what helps me maintain my sanity during the tumultuous times that we've endured since the pandemic began.
I've pointed out in the past that SECULAR bear markets appear on this 100-year chart with negative monthly PPOs and monthly RSIs that drop below 40. So long as the monthly PPO remains positive AND the monthly RSI remains above 40, we've avoided the lengthier secular bear market. Instead, I view these periods as cyclical, or more short-term, bear markets. Having said all this, check out where we currently stand on this 100-year monthly S&P 500 chart:
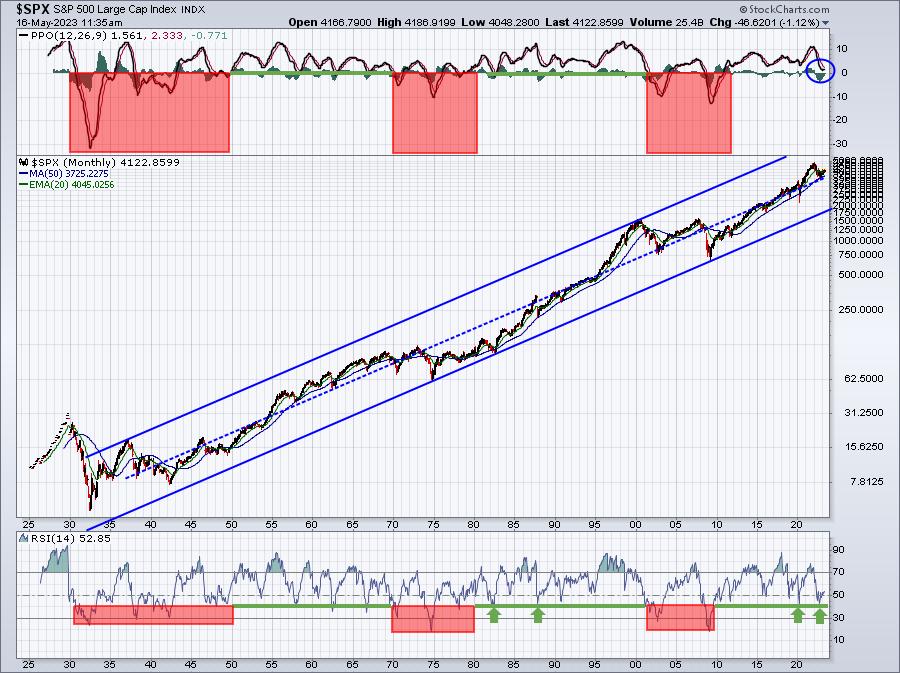
The monthly PPO has begun to curl back to the upside and it's making this reversal ABOVE the zero line. Also, note the monthly RSI, which tested 40 twice, and has now begun trending higher and currently resides at 52. These are signals that the 2022 bear market was CYCLICAL, not SECULAR. Could it change? Sure, but do we always want to spend our time investing/trading, based on something that MIGHT happen or on something that IS happening?
Happy trading!
Tom