
EB Daily Market Report - Monday, May 22, 2023
StockCharts.com Article
I wrote an article on Sunday, explaining how we've all been duped and misled by Wall Street since late 2021. I laid it out by four periods, including two clearly-manipulative periods. If you haven't heard me discuss this or haven't read prior DMR's where I've illustrated it, please check it out. It'll help to explain why I'm so bullish in 2023. You can CLICK HERE to read the article.
Executive Market Summary
- Futures were slightly lower and a bit bifurcated as we headed towards Monday's opening bell
- After some early morning weakness, especially on the Dow Jones, most major indices recovered and traded mostly in positive territory
- Gold ($GOLD, -0.26%) continues to push lower and is now $100 per ounce beneath its early-May high
- Silver ($SILVER, -0.73%) and copper ($COPPER, -1.23%) are also lower, though crude oil ($WTIC, +0.61%) has jumped back up to $72 per barrel
- The 10-year treasury yield ($TNX) is up another 2 basis points to 3.71% as traders flee bonds
- Communication services (XLC, +1.09%) remains strong and is the best-performing sector of 2023
- Weaker sectors are providing the rest of the strength today, with real estate (XLRE, +0.87%) and health care (XLV, +0.32%) leading that group
- Consumer stocks are lagging as staples (XLP, -1.40%) and discretionary (XLY, -0.34%) are our two worst sectors
- Upstart Holdings (UPST, +22.17%) is soaring as short sellers are panicking to cover (buy) their shares back; UPST is on our Short Squeeze ChartList (SSCL) with a short % of float at 38.41%
Market Outlook
Automobiles ($DJUSAU) are now the best-performing industry over the past week and the group has climbed back above its 50-day SMA. Tesla (TSLA, +2.89%) is up nicely today, confirming its break above its 50-day SMA on Friday. But I want to point you to another stock in this space that is looking very interesting technically. It has a TON of upside potential, but we may want to wait to see the key technical breakout before jumping in. I'm talking about Rivian (RIVN). First, check out the possible bottoming reverse head & shoulders pattern:
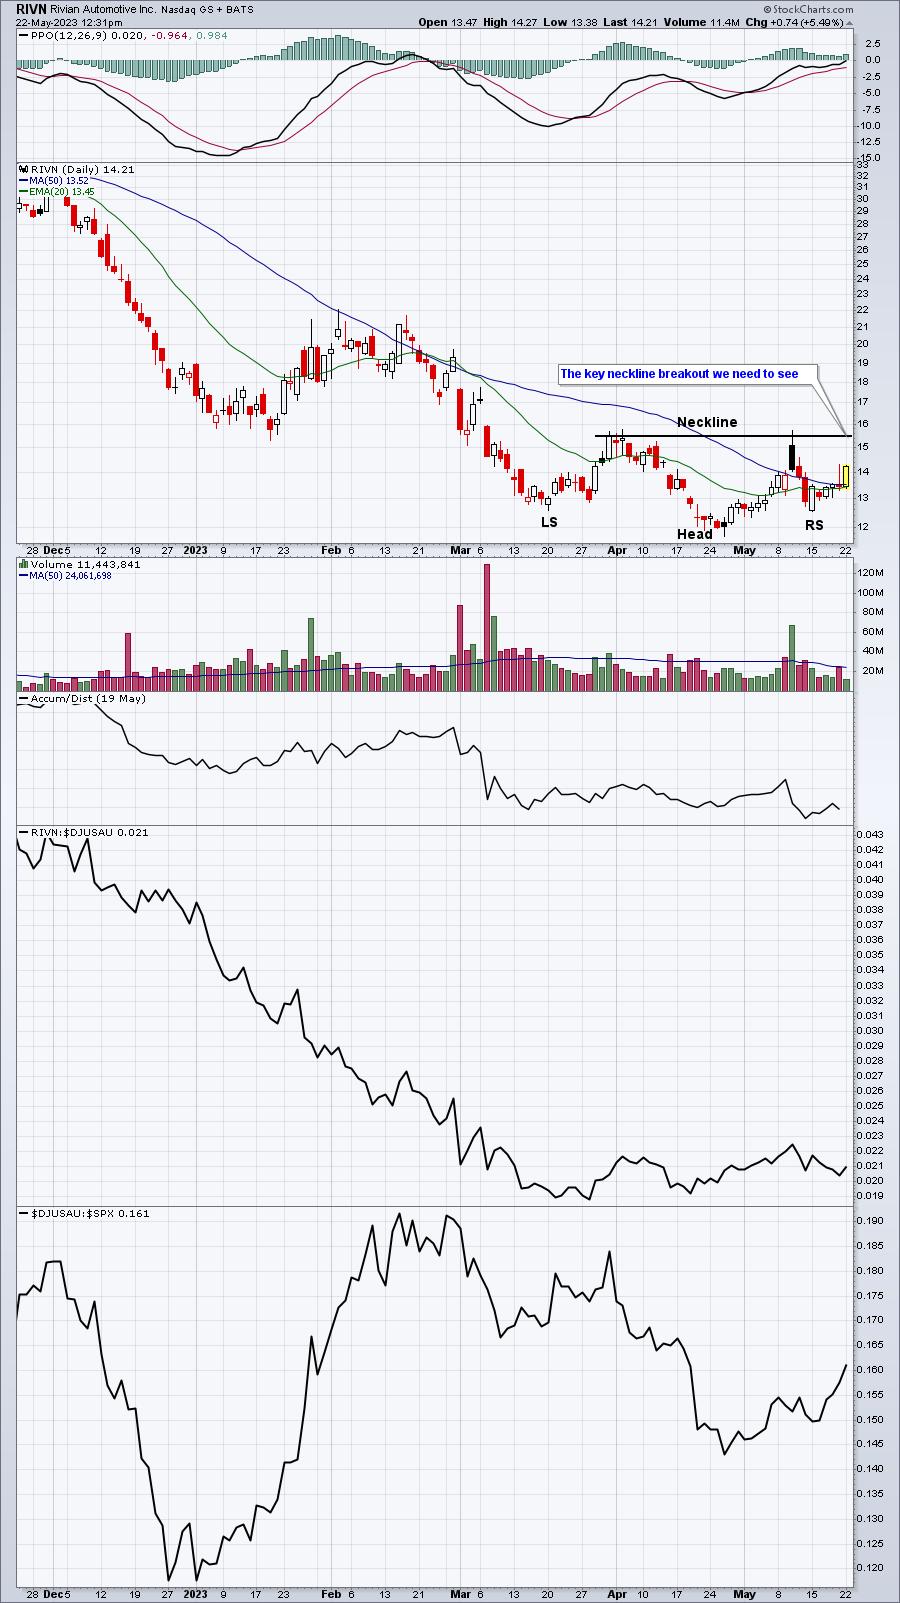
The AD line remains fairly weak, so that's a negative, in my opinion. But this bullish pattern is almost perfectly symmetrical, so it's easy for other traders to see. The most important part of the pattern is the CONFIRMATION, which requires a breakout above the 15.50 area. If that occurs and is accompanied by heavy volume, that would be a solid technical signal to enter. Just keep in mind that RIVN is a VERY aggressive trade and is not for everyone. I believe if the 15.50 level is cleared, RIVN will run to the prior price resistance in the 21-22 zone. A breakout could also be bolstered by a reasonably large short position. Currently, more than 13% of RIVN's float is short. This group of short sellers might also be tempted to add to the buying pressure if the breakout is achieved. There's a relative price signal that's turning more bullish as well. While RIVN fell in April to clear the March low, note that it's relative strength vs. its peers actually printed a higher low. So at least for now, RIVN is beginning to see a bit of positive relative strength. An absolute price breakout would only help to strengthen RIVN's relative price action.
Sector/Industry Focus
I've said recently, and I continue to repeat it, I believe small and mid caps are poised for a big move higher. They've been frustrating, stuck in a range off of a recent downtrend, but the huge rotation into small cap growth and mid cap growth from small cap value and mid cap value, respectively, leads me to believe this bullish rotation is going to lead to much higher prices. Here's what the IWM (ETF that tracks the Russell 2000) looks like on the daily chart (with the small cap growth vs. small cap value - $DJUSGS:$DJUSVS ratio - in the panel below):
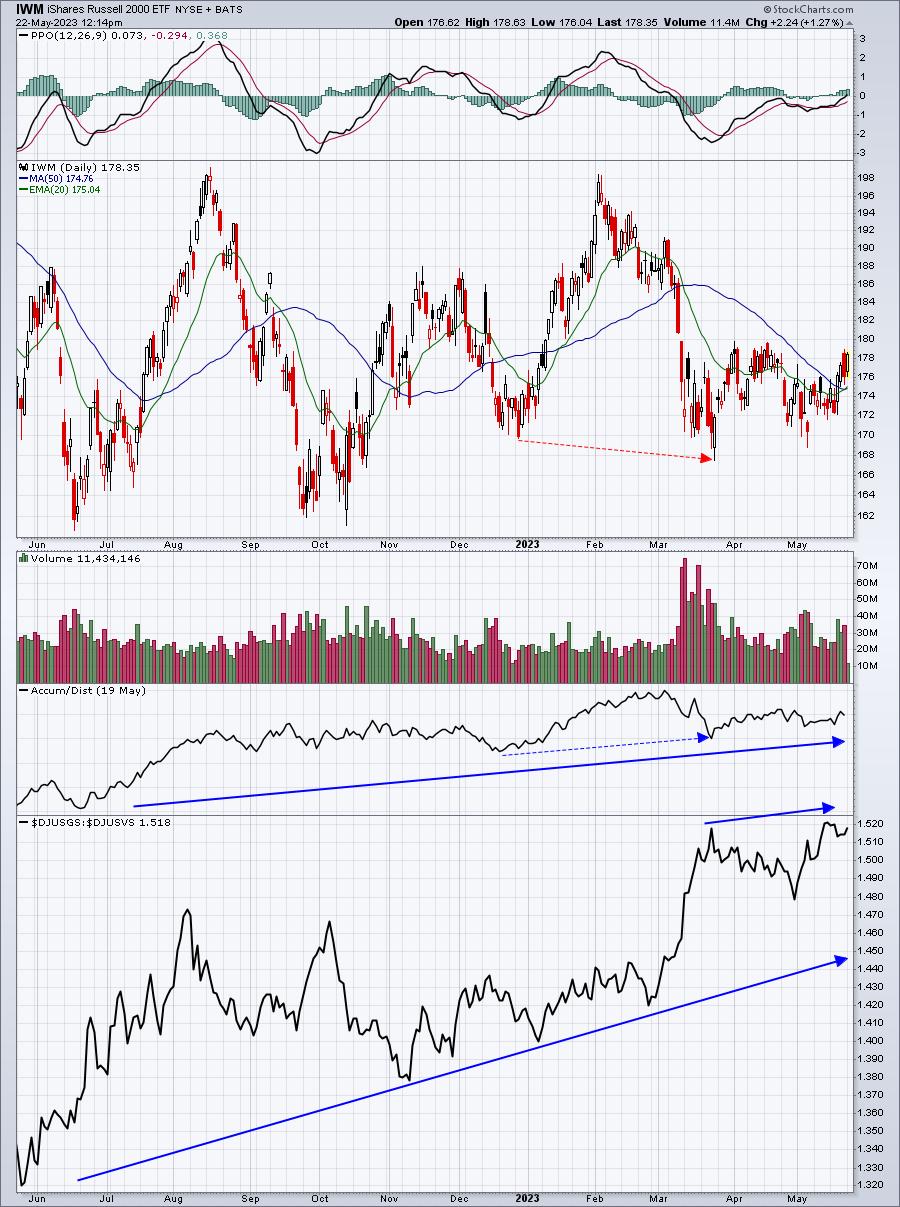
I can't imagine why money would be rotating into growth from value in anticipation of a drop. Therefore, I've been trading in and out of the TNA (3x bull leverage on small caps). I'm prepared to build a solid position if the IWM tops 180. Currently, I own about 1/3 of what I'd like to own.
ChartLists/Strategies
Right now, I'm focused on the small cap arena and the potential to add to my TNA position. In the EB Weekly Portfolio Report that I sent out a little while ago, I did discuss an aggressive trade that I put on in DraftKings (DKNG). I haven't had ANY long-term swing trades (hold a month or longer) since probably 2021. At least I don't remember any off the top of my head. But if I'm right about this being the beginning of a lengthy advance, I could see a stock like DKNG building off its recent strength and trending higher for weeks. So I've given it a bit more room to the downside (my stop is any close beneath 22.50), but I plan to hold for, hopefully, very large profits. Therefore, I'm willing to give it more downside room.
Based on what I'm seeing in this short-term small cap rotation to growth, this might be a decent time to begin building positions in your favorite small and mid-cap growth names - in anticipation of an explosion higher in small caps. I'll stick mostly with the TNA, but individual stocks certainly will have much more upside. They'll also have much more downside, if the market doesn't cooperate. Everyone must individually decide the amount of risk you're willing to take.
Earnings Reports
Here are the key earnings reports for the next two days, featuring stocks with market caps of more than $10 billion. I also include several companies with market caps below $10 billion. Finally, any portfolio stocks that will be reporting results are highlighted in BOLD. If you decide to hold a stock into earnings, please understand the significant short-term risk that you are taking. Please be sure to check for earnings dates for any companies you own or are considering owning.
Monday, May 22:
HEI, RYAAY, ZM, NDSN, GLBE
Tuesday, May 23:
INTU, LOW, PANW, AZO, A, DKS, VIPS, BJ, VFC, WSM, TOL, NEWR, URBN, KC
Economic Reports
None
Happy trading!
Tom