
EB Daily Market Report - Thursday, May 25, 2023
Spring Special
Please don't forget about our Spring Special! It's our best deal of the year to extend your membership. Anyone whose membership is expiring any time over the next year should consider extending and locking in at our lowest prices. This special ends on Sunday, so CLICK HERE to claim your savings NOW!
Live Trading Room Event
Yesterday was our 2nd Live Trading Room event - our first was in February 2023. We discussed taking 9 positions throughout the day yesterday. About half were intended for short-term trading purposes, while the rest were more swing trading opportunities, designed to be held longer. Two that were bought for short-term gain, however, were excellent. Check out the ChartLists/Strategies section below for these two trades.
Executive Market Summary
- Futures were skewed bullishly and heavily towards the NASDAQ and this growth-oriented index soared at the opening bell
- NVIDIA (NVDA, +25.73%) reported blow out revenues and earnings, leading a very strong semiconductor group ($DJUSSC, +11.33%)
- Technology (XLK, +4.23%) is miles ahead of the next best-performing sector, real estate (XLRE, +0.78%)
- Energy (XLE, -1.71%) is the primary laggard as crude oil prices ($WTIC, -3.27%) reversed from early morning gains
- Gold ($GOLD, -1.21%) is down another $23.70 to $1941 per ounce; the dollar (UUP, +0.46%) is up again, threatening a breakout to a 2023 high
- The 10-year treasury yield ($TNX) is jumping, up 9 basis points to 3.81%, though most large-cap growth stocks (IWF, 2.06%) are ignoring the higher yields
- Semiconductor and software ($DJUSSW, +3.34%) stocks are littering the S&P 500 leaderboard
Market Outlook
Small caps (IWM) are lagging badly today, but still remain in its consolidation range. When you see a false breakout like the one we had on the IWM on Tuesday, it's quite normal to see a couple days of weakness to follow. The key will be whether key short-term price support holds. Check out the daily chart of the IWM:
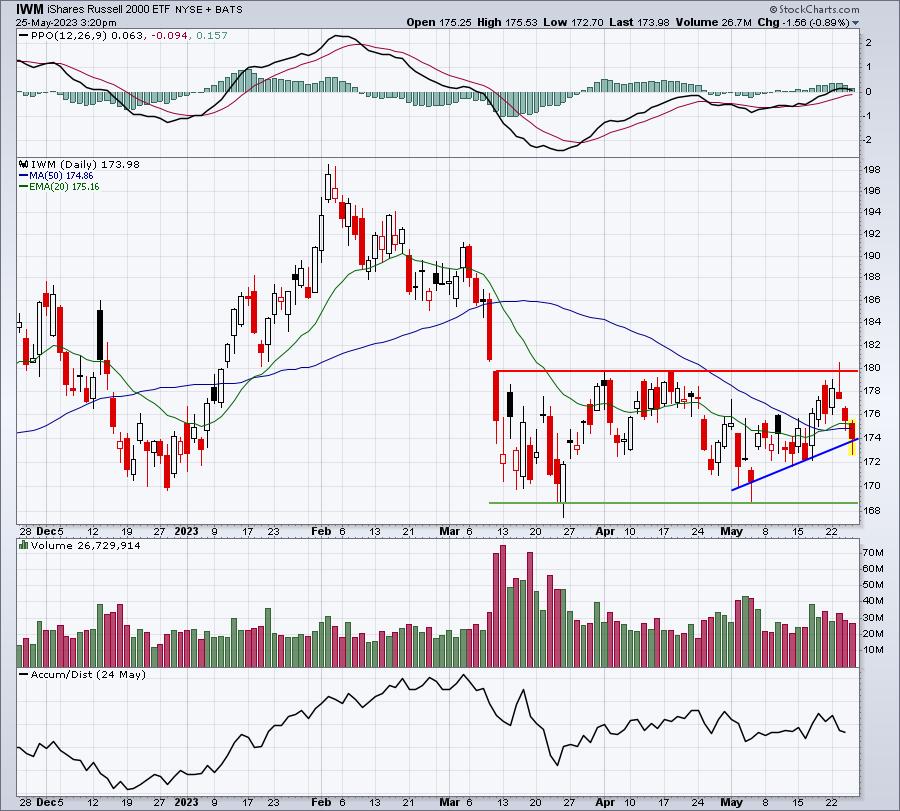
That false breakout led to this weakness, in my opinion. Now our attention turns to the recent lows. I'm personally using this short-term weakness to build up my position in the TNA. I've completed that process. I'll watch the key price support from here.
Sector/Industry Focus
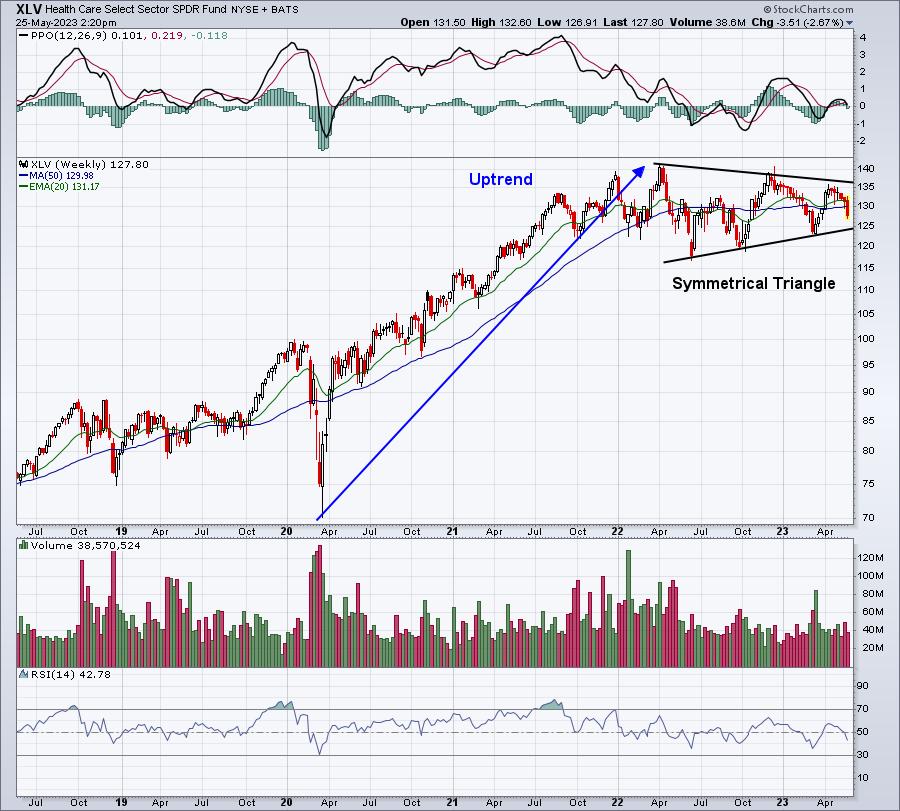
Health care (XLV) is lagging and weak today, but if we pan out to a long-term 5-year weekly chart, I see a very bullish symmetrical triangle pattern. These triangles are not always bullish, but they're considered "continuation" patterns. So if the trend prior to the pattern was bullish, then we should expect a bullish execution:
This is totally unrelated to health care, but Costco (COST) reports its latest quarterly results after the bell today and COST shows quite the bullish symmetrical triangle as well:
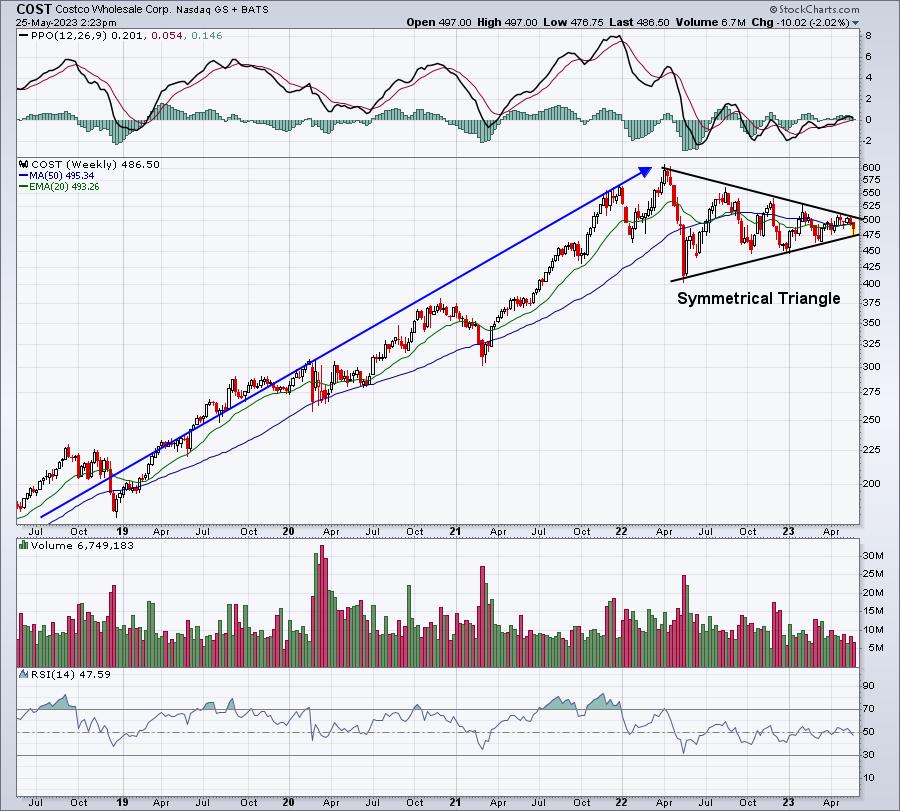
It tested its lower uptrend line earlier this morning and is rallying in the afternoon. Will we see that triangle breakout after the bell today? We'll find out within a couple hours.
ChartLists/Strategies
We had a very solid day trading in our Live Trading Room yesterday, especially considering it was one of the weakest days of 2023 and we only traded on the long side. But part of the strategy was allowing the opening gap lower and morning weakness to take place before committing capital. That's been a theme for nearly a year now. Gap downs followed by early morning weakness. Trading on the long side on the heels of that has worked quite well since June 2022.
Our first trade yesterday was discussed from the "Upcoming Earnings ChartList" for companies that reported their quarterly results after the market close (AMC) on Tuesday, May 23 OR before the market open (BMO) on Wednesday, May 24. That ChartList is available on our website. We do the research on company earnings reports and produce these ChartLists for each day during earnings season. The stock we traded was New Relic (NEWR), a software stock that had a SCTR of 97 when we printed this screen shot of all companies reporting yesterday:
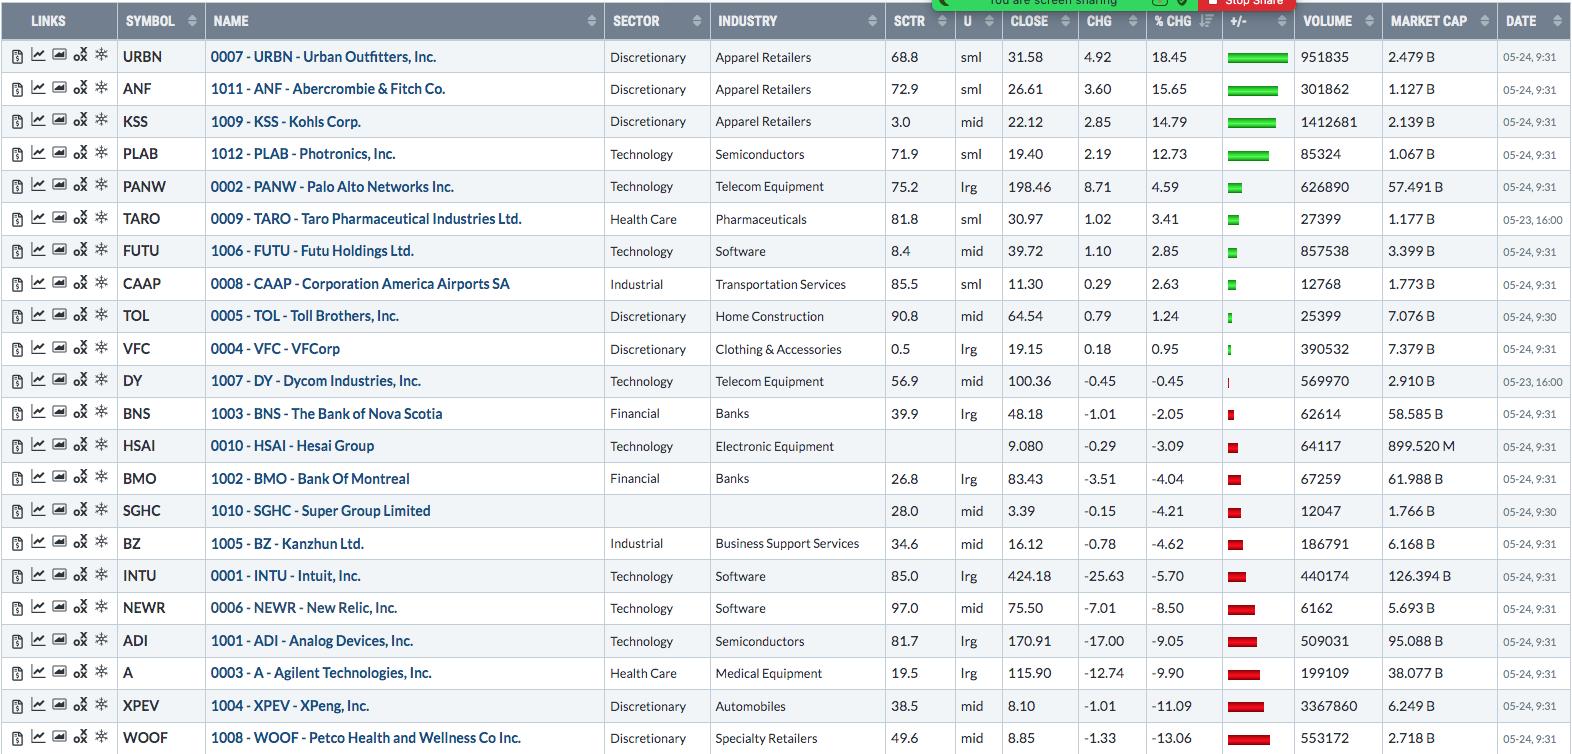
NEWR opened at 75.50, dropping 8.50%. NEWR reported both revenues and EPS that easily topped Wall Street forecasts, so the opening gap seemed like an opportunity to trade alongside market makers, who provide liquidity and buy a stock that sells off at the opening bell. Here was the intraday 10-minute, 5-day chart of NEWR:
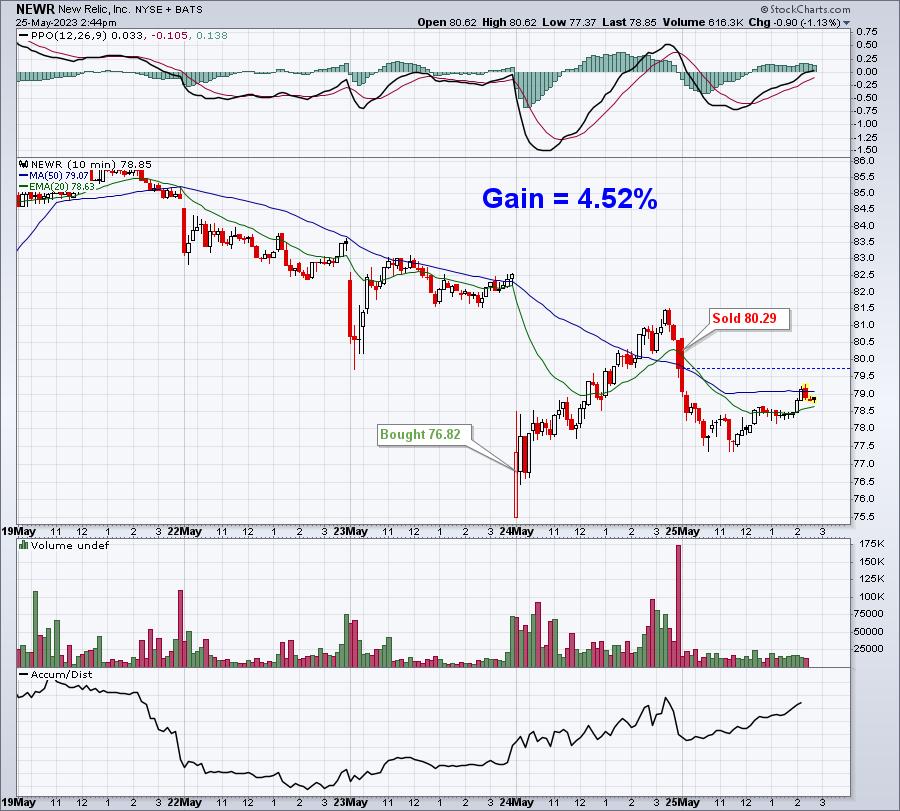
Every $1000 investment earned $45, not bad for an intraday trade, especially considering that the same $1000 investment in a 10-year treasury would take 15 months to earn that same $45.
But that wasn't the big trade. At the end of the day, just before the market close, we decided to take a position in NVIDIA (NVDA), believing that it's excellent relative strength would result in a blowout earnings report. Well, I think the following chart is all you need to see:
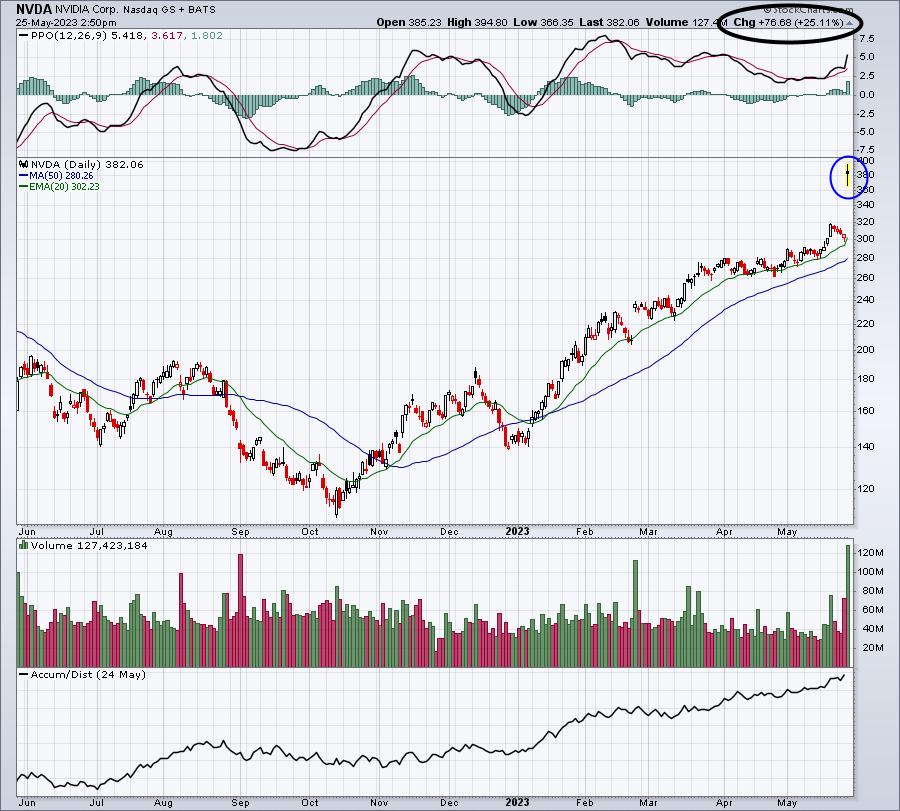
Anyone buying NVDA at the close yesterday is currently up 25% one day later. Every $1000 investment would yield a $250 return. That's approximately the same as a 7-year investment in a 10-year treasury. I do want to say that I sold shortly after NVDA's numbers were released, netting a much more modest 10% or so. Also, holding into ANY earnings report requires accepting a lot of risk. But, if you were ok with the high risk, today's gain was well worth it.
It was a lot of fun and I want to thank all those who participated. I love our EarningsBeats.com community. If you weren't able to make this one, we'll be sure to do another one next quarter.
Earnings Reports
Here are the key earnings reports for the next two days, featuring stocks with market caps of more than $10 billion. I also include several companies with market caps below $10 billion. Finally, any portfolio stocks that will be reporting results are highlighted in BOLD. If you decide to hold a stock into earnings, please understand the significant short-term risk that you are taking. Please be sure to check for earnings dates for any companies you own or are considering owning.
Thursday, May 25:
COST, RY, MDT, TD, NTES, VMW, WDAY, ADSK, MRVL, CM, DLTR, CCEP, ULTA, BBY, DECK, BURL, RL, RH, GPS, LGF/A
Friday, May 26:
BAH, BKE
Economic Reports
Q1 GDP (2nd estimate): +1.3% (actual) vs. +1.1% (estimate)
Initial jobless claims: 229,000 (actual) vs. 248,000 (estimate)
April pending home sales: +0.0% (actual) vs. +1.1% (estimate)
Happy trading!
Tom