
EB Daily Market Report - Friday, May 26, 2023
Spring Special
Please don't forget about our Spring Special! It's our best deal of the year to extend your membership. Anyone whose membership is expiring any time over the next year should consider extending and locking in at our lowest prices. This special ends on Sunday (two days away!), so CLICK HERE to extend membership and claim your savings NOW!
Executive Market Summary
- Futures were higher overnight and the bulls are rallying the troops again
- All of our major indices are higher, with the tech-laden NASDAQ 100 ($NDX) surging more than 2% higher
- Another huge day from semiconductors ($DJUSSC, +3.66%) to lead the technology (XLK, +2.28%) charge
- Growth (IWF, +1.53%) is dominating value (IWD, +0.48%), putting an exclamation point on this rally
- Consumer discretionary (XLY, +2.26%) and communication services (XLC, +1.08%) are also quite strong
- Energy (XLE, -0.78%) and utilities (XLU, -0.76%) are the primary laggards on the session
- Most commodities are higher, including crude oil ($WTIC, +1.31%) and copper ($COPPER, +1.92%)
- The 10-year treasury yield ($TNX) is up 2 basis points to 3.84%; it's been an unrelenting push to the upside - and growth stocks are soaring - completely opposite of what we've seen the past couple years
- Ulta Beauty, Inc. (ULTA, -12.32%) is easily the worst-performing S&P 500 company after reporting its quarterly results
Market Outlook
We are on the verge of entering a very bullish historical period. Let's go over the historical numbers by calendar day of the month on each of our three key indices - S&P 500, NASDAQ, and Russell 2000:
S&P 500:
Here is the daily historical breakdown for the S&P 500:
- May 26: +47.98%
- May 27: +57.71%
- May 28: +5.42%
- May 29: +27.35%
- May 30: +56.12%
- May 31: +32.14%
- June 1: +50.19%
- June 2: +30.41%
- June 3: +3.68%
- June 4: -1.79%
- June 5: +44.94%
- June 6: +56.51%
The annualized return for the entire period is 33.44% (vs. average annual return of 9% or so since 1950). The number of up days vs. down days within this period is 56.01% vs. the 53.57% chance of an up day throughout the year. Clearly we have bullish TENDENCIES, not guarantees.
NASDAQ:
Here is the daily historical breakdown for the NASDAQ:
- May 26: +91.40%
- May 27: +160.41%
- May 28: +38.94%
- May 29: -37.73%
- May 30: +41.25%
- May 31: -3.24%
- June 1: +67.32%
- June 2: +127.76%
- June 3: -71.71%
- June 4: +81.57%
- June 5: +100.51%
June 6th has a negative annualized return (-15.62%) and is not included above, which is slightly different than the S&P 500. The annualized return for the entire period is 55.13% (vs. average annual return of 11% or so since 1971). The number of up days vs. down days within this period is 62.15% vs. the 55.83% chance of an up day throughout the year.
Russell 2000:
Here is the daily historical breakdown for the Russell 2000:
- May 26: +165.97%
- May 27: +209.58%
- May 28: +2.86%
- May 29: +24.64%
- May 30: +42.34%
- May 31: +31.18%
- June 1: +107.31%
- June 2: +150.93%
- June 3: -43.34%
- June 4: +54.73%
- June 5: +94.64%
Like the NASDAQ, June 6th produces negative returns on the Russell 2000 (-25.03%) and is not included above. The annualized return for the entire period is 77.05% (vs. average annual return of just under 10% or so since 1987). The number of up days vs. down days within this period is 62.55% vs. the 54.78% chance of an up day throughout the year.
Sector/Industry Focus
Automobiles ($DJUSAU) continue to show strengthening as the recent price high was followed by a drop to slightly above key moving averages. Today, the group is trying to establish a new recent high. This is how typical uptrends develop:
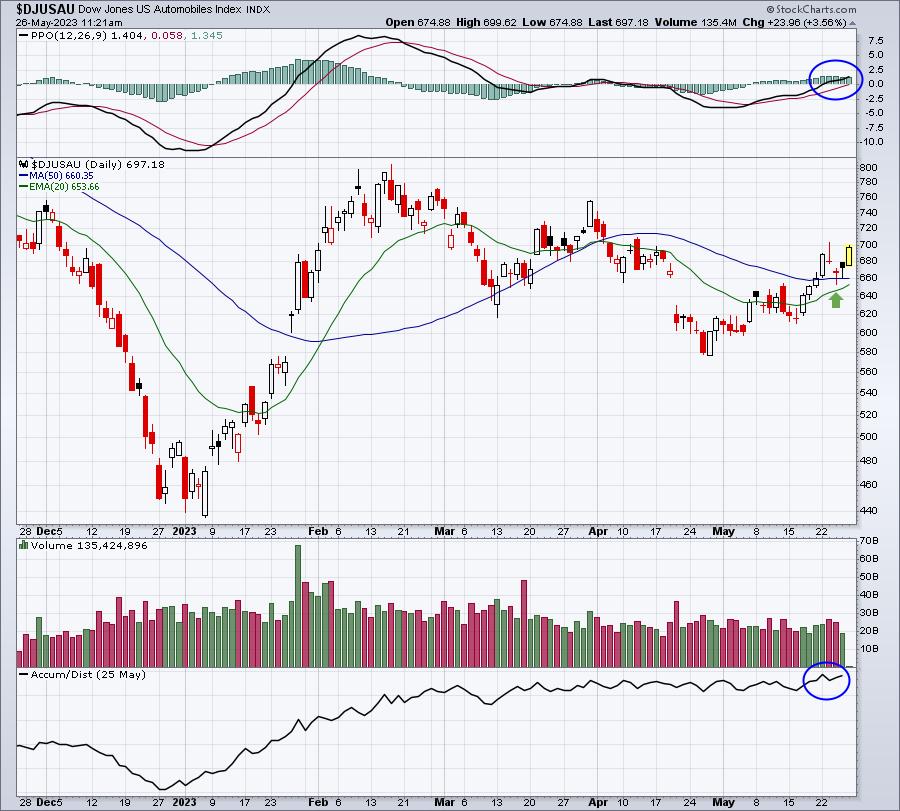
I love the PPO moving back into positive territory and AD line breaking to a new high. It certainly appears that the group is being accumulated.
ChartLists/Strategies
CoStar Group, Inc. (CSGP) looks interesting, especially from a reward-to-risk perspective. It's on our Strong Earnings ChartList (SECL) and has pulled back to the point of its recent breakout. Check out the chart:
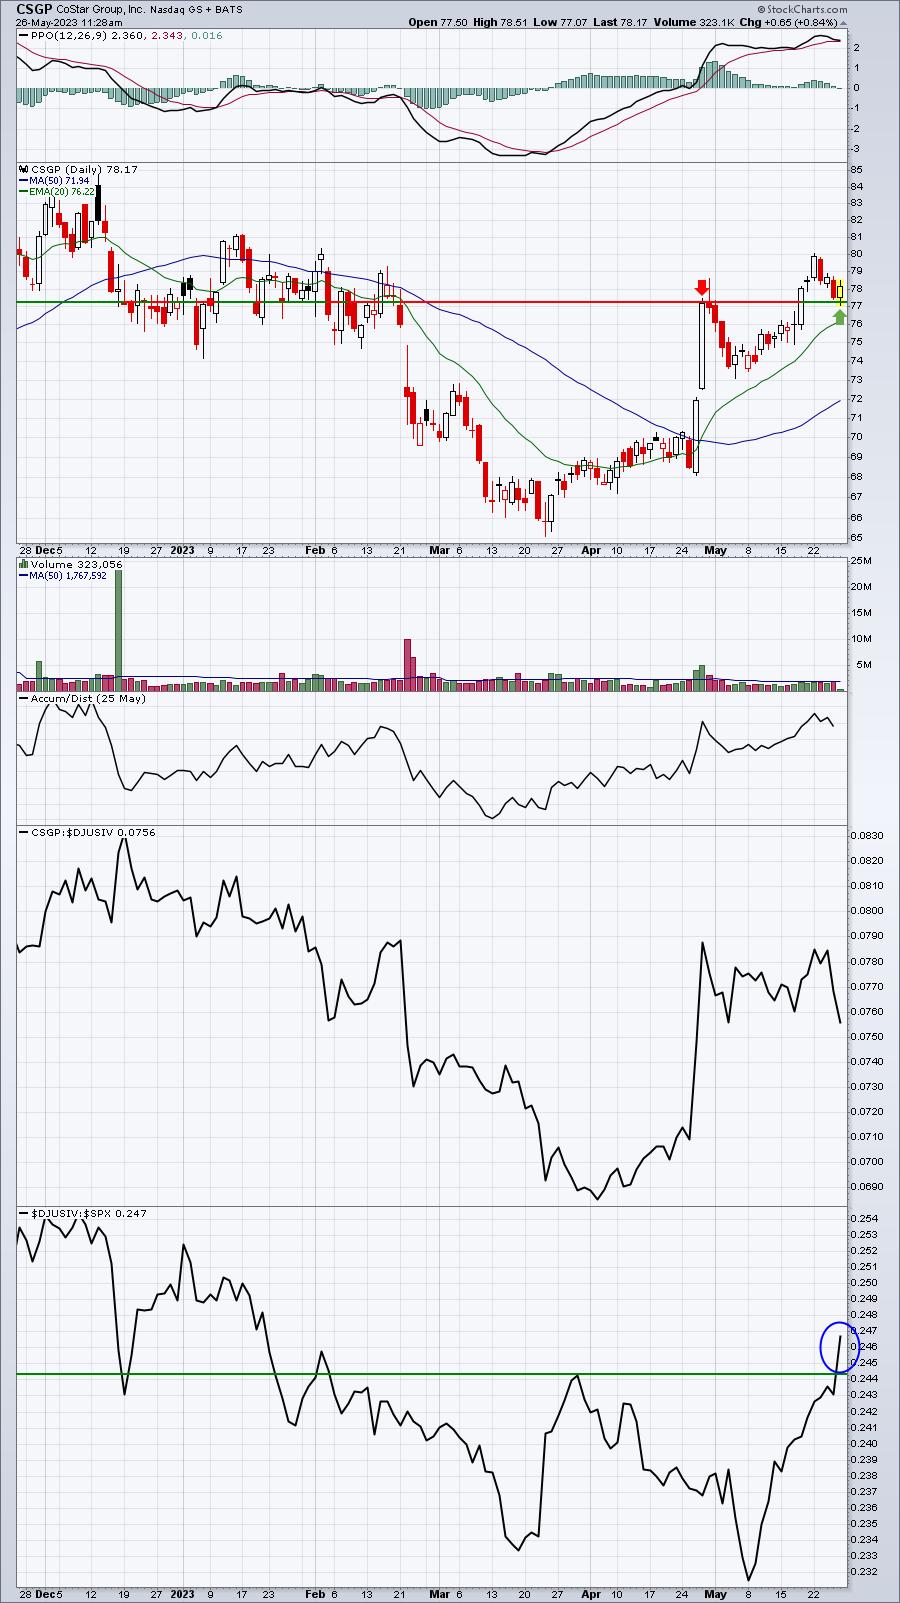
Business support services ($DJUSIV) has really improved, breaking out to a multi-month high vs. the S&P 500 and CSGP has strong volume trends within the group and it's now trending higher. This pullback is TA 100 - broken price resistance becomes support. I like entry here and, potentially, at the 20-day EMA, should it get there. A close beneath the rising 20-day EMA would be my stop. To the upside, I see no reason why we couldn't challenge the 85 level.
Earnings Reports
Here are the key earnings reports for the next two days, featuring stocks with market caps of more than $10 billion. I also include several companies with market caps below $10 billion. Finally, any portfolio stocks that will be reporting results are highlighted in BOLD. If you decide to hold a stock into earnings, please understand the significant short-term risk that you are taking. Please be sure to check for earnings dates for any companies you own or are considering owning.
Friday, May 26:
BAH, BKE
Tuesday, May 30:
HPQ, HPE, UHAL, ESLT, BOX, AMBA
Economic Reports
April durable goods: +1.1% (actual) vs. -1.1% (estimate)
April durable goods ex-transports: -0.2% (actual) vs. -0.1% (estimate)
April personal income: +0.4% (actual) vs. +0.4% (estimate)
April personal spending: +0.8% (actual) vs. +0.4% (estimate)
April PCE price index: +0.4% (actual) vs. +0.3% (estimate)
April Core PCE price index: +0.4% (actual) vs. +0.3% (estimate)
May consumer sentiment: 59.2 (actual) vs. 58.0 (estimate)
Happy trading!
Tom