
EB Daily Market Report - Tuesday, May 30, 2023
Executive Market Summary
- Futures were higher overnight as President Biden and House Speaker McCarthy struck a bipartisan deal; it must still be approved by the House and Senate so I doubt we're done hearing about it
- NVIDIA (NVDA, +3.38%) is having another strong session and hit a $1 trillion market cap earlier in the session, though it's just beneath it at last check
- Semiconductors ($DJUSSC, +1.52%) are jumping again as a result, leading another strong session for technology (XLK, +0.83%)
- Consumer discretionary (XLY, +0.64%) isn't far behind as automobiles ($DJUSAU, +3.74%) surge; broadline retail ($DJUSRB, +1.15%) is adding to the XLY strength
- Tesla (TSLA, +4.17%) and Amazon.com (AMZN, +1.61%) are leading those two industry groups
- Most commodities are lower as crude prices tumble ($WTIC, -4.10%) under $70 per barrel
- Energy (XLE, -1.46%) is today's weakest sector, given the big drop in crude
- The 10-year treasury yield ($TNX) is down 11 basis points to 3.70%
- QUALCOMM, Inc. (QCOM, +5.30%) is tacking on big gains today, following through on its big 6% gain on Friday
Market Outlook
There's been plenty of talk about mid cap (MDY) and small cap (IWM) stocks lagging in 2023 and it's the truth. But neither has broken down in the long-term. They've held onto breakouts above key highs in 2019/2020. So long as those support levels hold, I'm completely fine with them lagging. Eventually, I see rotation lifting both asset classes, likely sooner rather than later. Here are the key support levels to watch on both:
MDY:
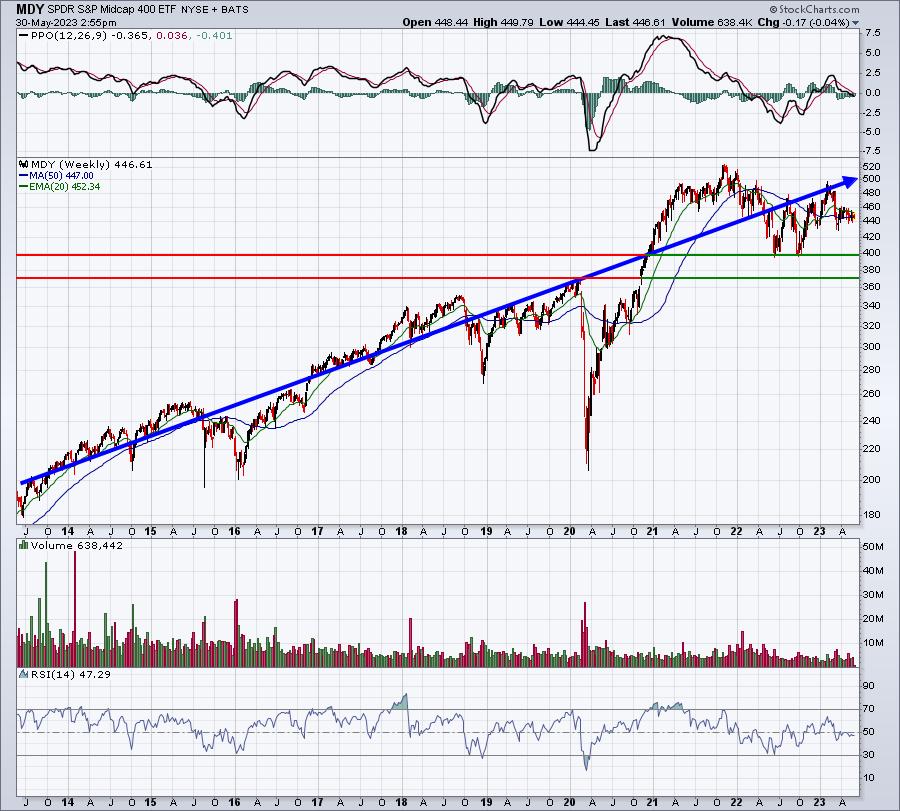
If you have perspective, then you can look rationally at this MDY chart and see a solid uptrend in play. But if you're blinded by a bearish perspective, then you can't think past 2023 performance and breadth issues. If we see key support levels break down, THEN we've got a problem. Until then, give the MDY time to begin its next upward thrust.
IWM:
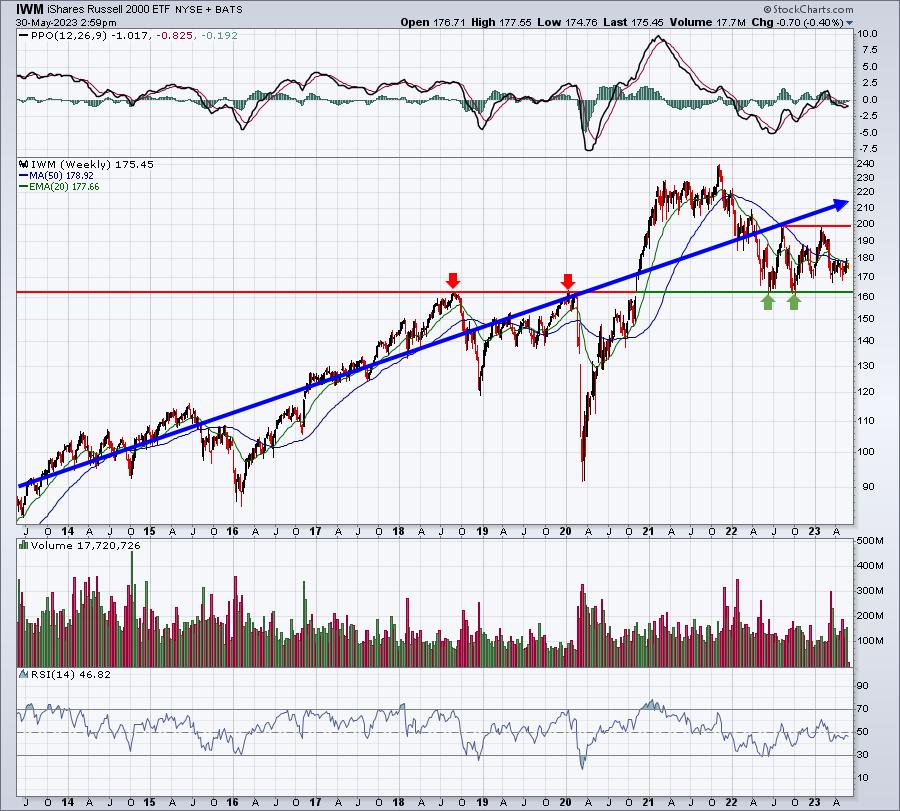
The IWM remains technically sound in the longer-term as well, but you can see it's window of support is tighter. Thus far, I see a classic "broken price resistance becomes price support" pattern. Different asset classes see bullish rotation at different times. The IWM ran from just above 90 at the pandemic low to 240 at the 2021 high. The significant pullback resulted primarily from the huge advance over just 19 months. The overall long-term trend, in my opinion, is very bullish. I'm expecting rotation to lift both the MDY and IWM later in 2023. When? I'm not sure, but I'll want to make sure that price support holds on both while we wait.
Sector/Industry Focus
Software ($DJUSSW) is one industry that's really performed well in 2023 and it continues to lead the NASDAQ 100 higher. First, let's look at the latest 3-year weekly chart:
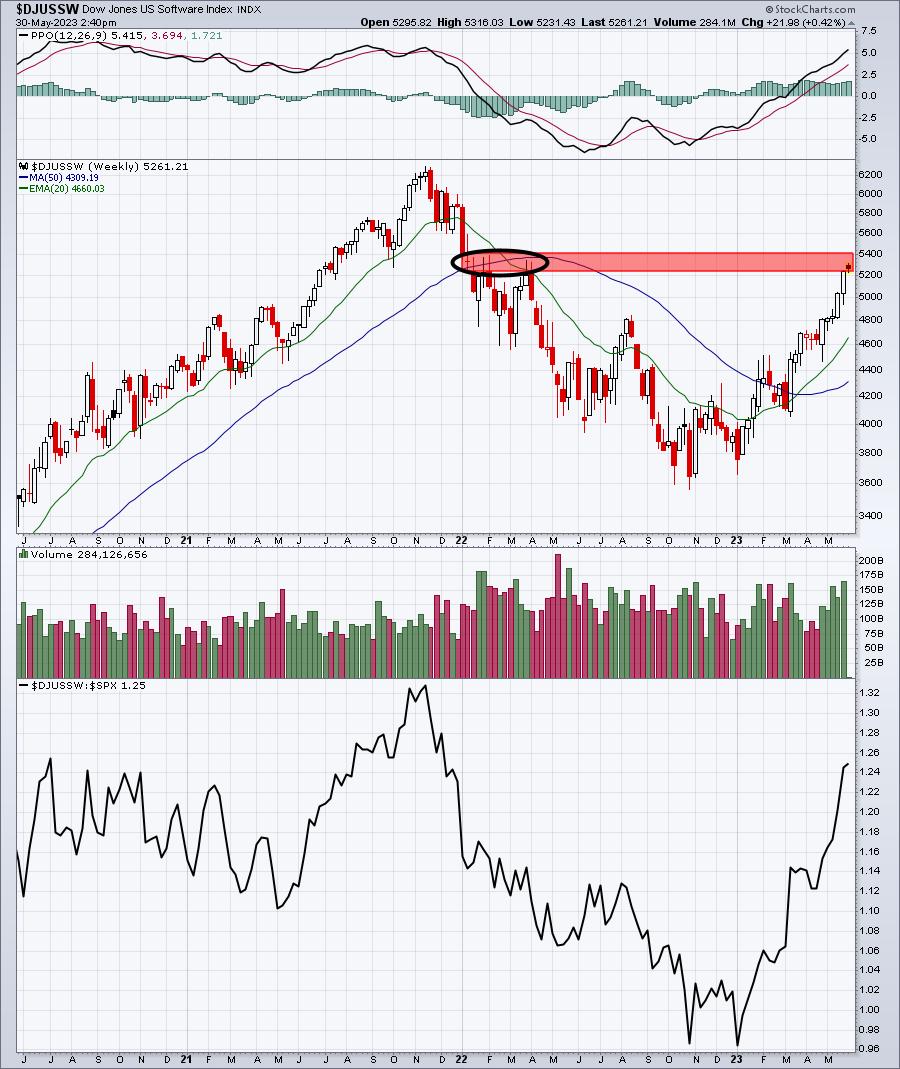
Early in 2022, we saw software really struggle when it bounced back into this 5200-5400 range. Therefore, we need to give this zone a bit of respect, though I believe we're eventually going right through it. We have a few software earnings reports out over the next two days and this is how I'd categorize them as they get set to report:
Bullish: CRM, AI
Neutral: CRWD, OKTA
Bearish: BOX, VEEV, NCNA, PHR
CRM is the 800 lb. gorilla in this room and it's a component of the Dow Jones, so it's influence will be obvious. AI will be important, because of the crazy buying of all AI stocks over the past week. CRWD and OKTA may hold the key for small and mid cap growth stocks and I see both going either way with earnings. I'd also put VEEV in this category, but after looking at the chart, I don't see any great news being released with its quarterly results. We'll know soon enough.
ChartLists/Strategies
I'm currently working on updating the Raised Guidance ChartList (RGCL), which is very time consuming. But there are two that I've added that look very interesting to me at their current price:
INGR:
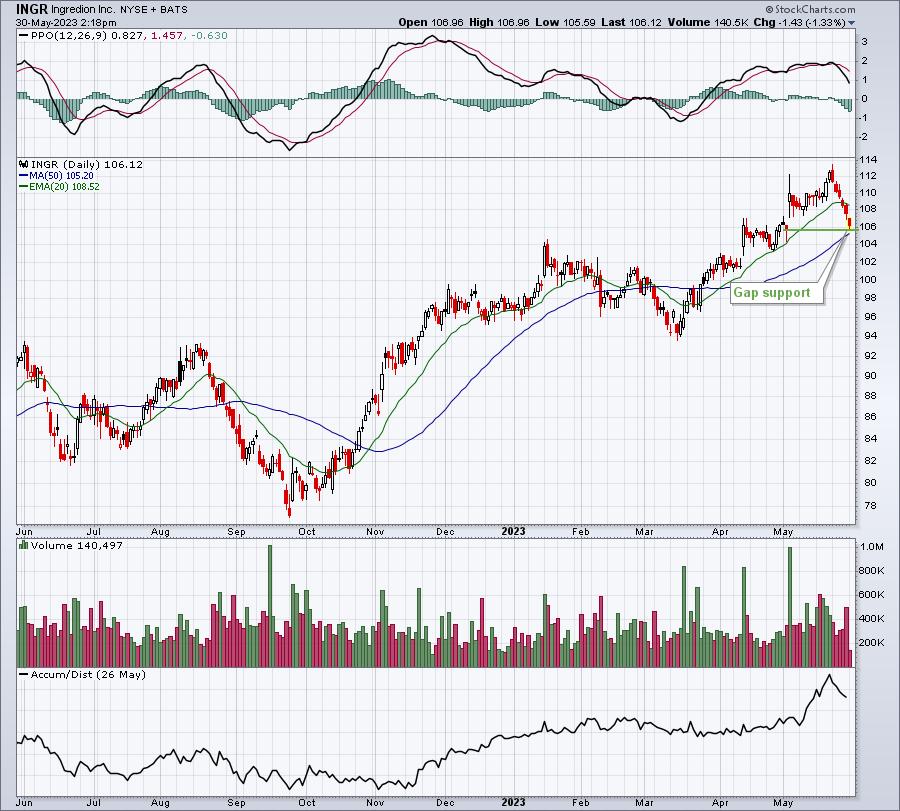
INGR raised guidance in early May and has now returned to a very solid gap support level and it just above its 50-day SMA. I like the reward-to-risk at the current level (took a small position). I'll exit on any close beneath the lower of (1) gap support at 105.68, or (2) the 50-day SMA at 105.20. My initial target would be the range from 112.50-113.00.
LNTH:
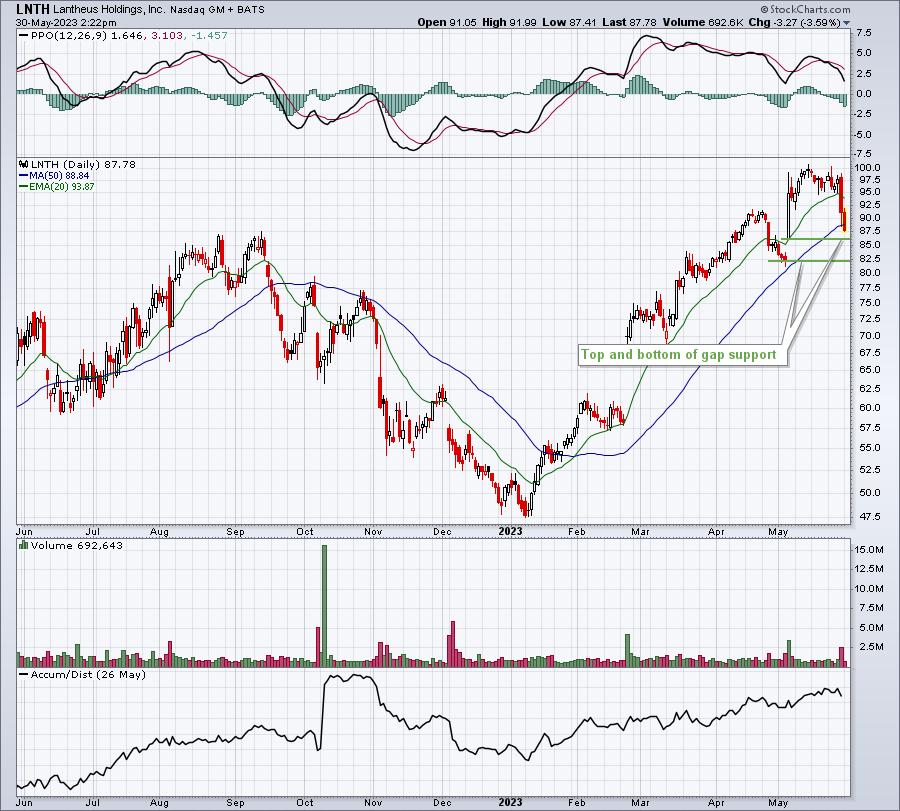
LNTH surged when it raised its guidance in early May. The opening bell price was 86.15 (top of gap support), while the prior close was 82.51 (bottom of gap support). I like entry into LNTH at these two levels, should they be tested. Any close beneath 82.00 would be reason for me to exit, while my target would be the recent high near 100. I do not own a position in LNTH currently.
Earnings Reports
Here are the key earnings reports for the next two days, featuring stocks with market caps of more than $10 billion. I also include several companies with market caps below $10 billion. Finally, any portfolio stocks that will be reporting results are highlighted in BOLD. If you decide to hold a stock into earnings, please understand the significant short-term risk that you are taking. Please be sure to check for earnings dates for any companies you own or are considering owning.
Tuesday, May 30:
HPQ, HPE, UHAL, ESLT, BOX, AMBA
Wednesday, May 31:
CRM, CRWD, VEEV, NTAP, OKTA, CHWY, PSTG, DCI, CAE, AAP, DSGX, PVH, CPRI, AI, FRO, NCNO, JWN, VSCO, PHR
Economic Reports
March Case-Shiller home price index: +0.5% (actual) vs. -0.1% (estimate)
March FHFA house price index: +0.6% (actual) vs. +0.3% (estimate)
May consumer confidence: 102.3 (actual) vs. 100.00 (estimate)
Happy trading!
Tom