
EB Daily Market Report - Wednesday, May 31, 2023
Spring Special Extended to Midnight Tonight
Because of the holiday weekend, we decided to allow a couple more days for you to take advantage of our Spring Special. It absolutely will end at midnight tonight, however, so if you're interested in extending your membership, you should CLICK HERE and do so NOW.
Thanks for your loyalty and support!
Executive Market Summary
- Futures were lower overnight and all of our major indices extended the early-morning weakness into the afternoon session
- The Dow Jones is today's best performer among our major indices, however
- We saw a very weak May Chicago PMI report at 9:45am ET and the selling intensified after that
- Cryptocurrencies are lower as bitcoin ($BTCUSD, -2.80%) has fallen 780 and is approaching 27000
- Commodities are mostly lower as crude oil ($WTIC, -2.10%) takes another tumble to $68 per barrel
- Gold ($GOLD, +0.25%) and silver ($SILVER, +1.73%) are bucking the commodity weakness
- The 10-year treasury yield ($TNX) has fallen another 7 basis points to 3.63%
- Defensive sectors are leading today, as you'd expect with weakness across the board
- Energy (XLE, -1.76%) is today's biggest loser, down in sympathy with crude oil prices
- Semiconductors ($DJUSSC, -2.48%) are finally taking a day off, weighing on technology (XLK, -0.49%)
- Advanced Auto Parts (AAP, -34.83%) is getting slammed after falling WAY SHORT of earnings expectations ($.72 vs. $2.60); auto parts ($DJUSAT, -3.59%) have hit a 7+ month low as a result
Market Outlook
Yesterday, I provided the long-term chart of the MDY and IWM and why I believe the technical foundation remains sound. Because I've been discussing and trading the TNA (3x the Russell 2000, or IWM), I wanted to provide you more of a short-term view of the small caps and why they've not kept up with their large cap counterparts. First, to truly understand the IWM movement, you need to know a few things about what it owns and doesn't own. From Fidelity.com, the IWM is comprised of nearly 2000 companies and the heaviest individual stock concentration is ShockWave Medical (SWAV) at 0.45% of the entire ETF. That's the LARGEST holding, so it's very clear that the IWM is a widely-diversified ETF that does NOT concentrate in any key individual stocks. But it does concentrate in certain sectors and industry groups and therein lies the problem currently.
Here are the top sectors:
- Health care (XLV): 17.12%
- Industrials (XLI): 16.46%
- Financials (XLF): 15.84%
You can see that technology (XLK), consumer discretionary (XLY), and communication services (XLC), the 3 sectors leading the 2023 advance, are not a significant part of the IWM. While those 3 sectors represent 80% of the QQQ, they only represent 25% of the IWM. When all sectors move higher together, we see both the QQQ and IWM perform well. But when only 3 of the sectors are gaining ground in 2023 and none are significant pieces of the IWM, it's much easier to see why the IWM appears stuck. Because it is.
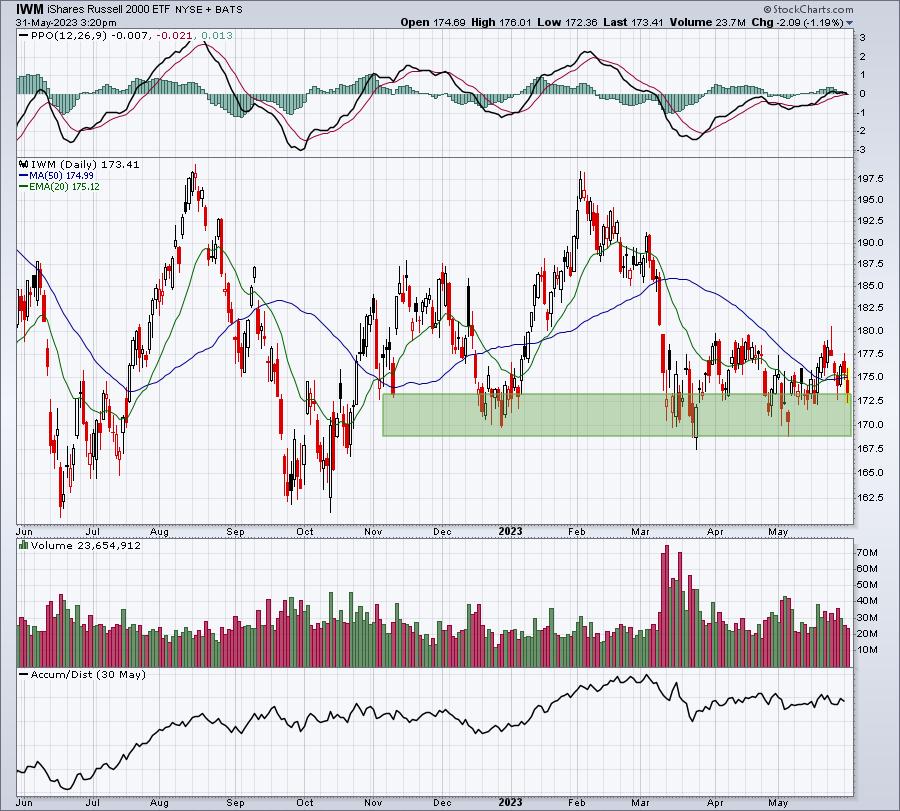
My belief is that we are resuming the secular bull market that began in 2013. If I'm correct, we'll see all areas of the stock market move higher. Currently, large cap growth is where the bullish momentum lies, but there'll be rotation. While maintaining a portion of a portfolio in the QQQ makes a lot of sense, I also believe that the recent selling in the IWM provides a great opportunity as well. That's why I've used weakness to build a position in the TNA. I'm holding it for now and am okay so long as key price support is not lost:
One industry that has a BIG impact on the IWM is the banks ($DJUSBK). The big bank selloff in March took the IWM down with it as can be seen in this chart:
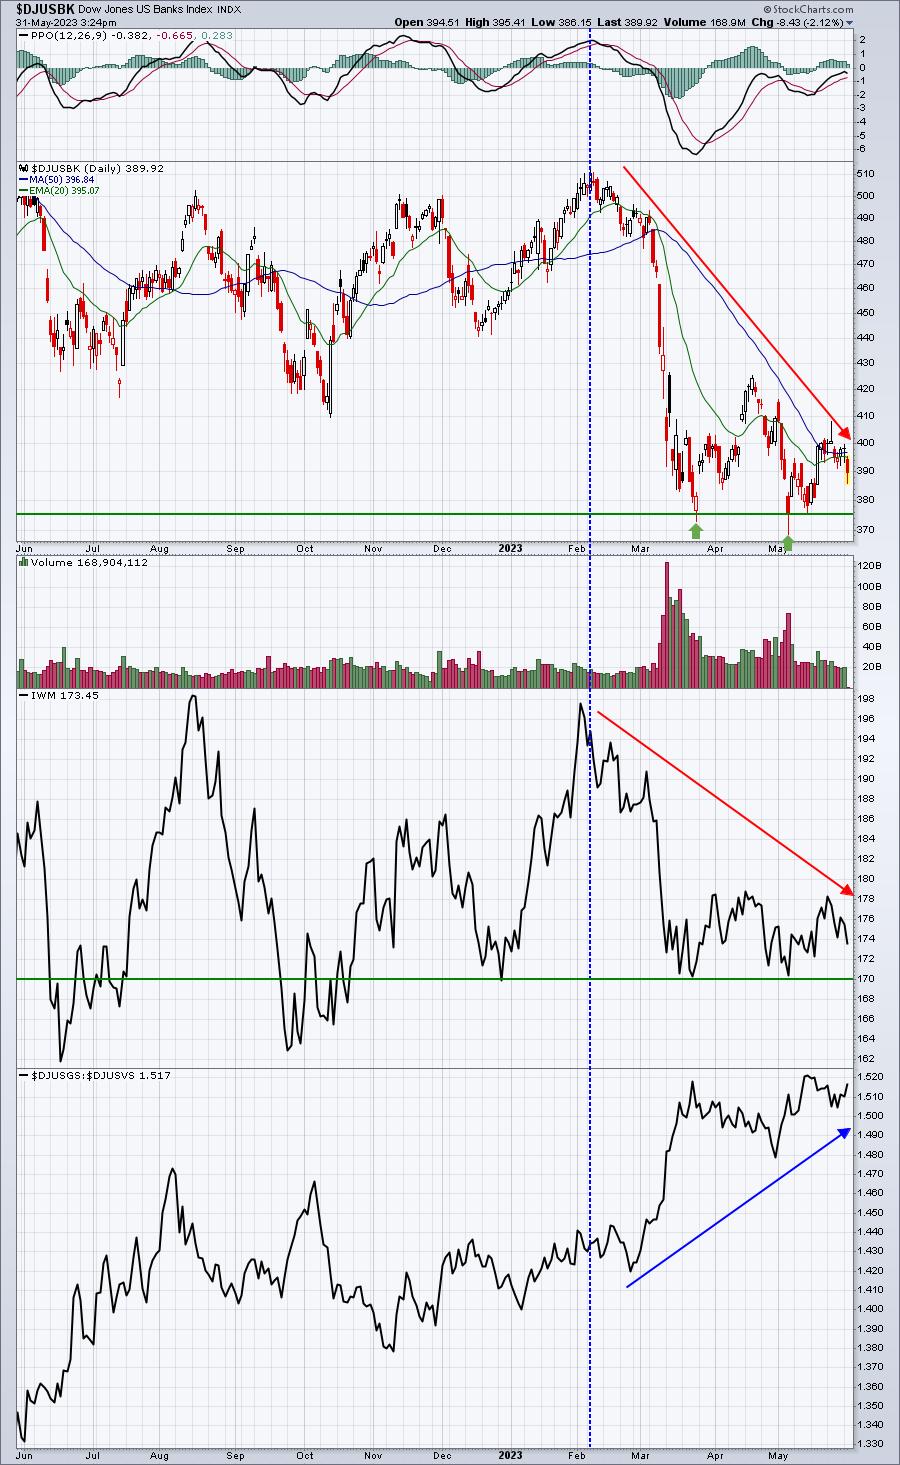
Banks represent just over 8% of the IWM, so the regional bank crisis certainly helped to hold back the IWM, while the tech-laden NASDAQ was soaring. It's important the industrials hold onto the support that I identify in the next DMR section and it's also important for banks to do their part as well. Given how the growth portion of small caps is performing, a rebound in the XLI and banks would likely send the IWM back up to the 180 level and ultimately break out. That's what I'm looking for and why I'm in the TNA right now. I'll keep you posted if I decide to sell the TNA, but I have my full position right now in anticipation of strength ahead.
Sector/Industry Focus
Industrials (XLI) have been consolidating for months now. The good news, as you can see below, is that its AD line continues to push higher. So while there's clearly been rotation out of the group, I don't see full-scale distribution:
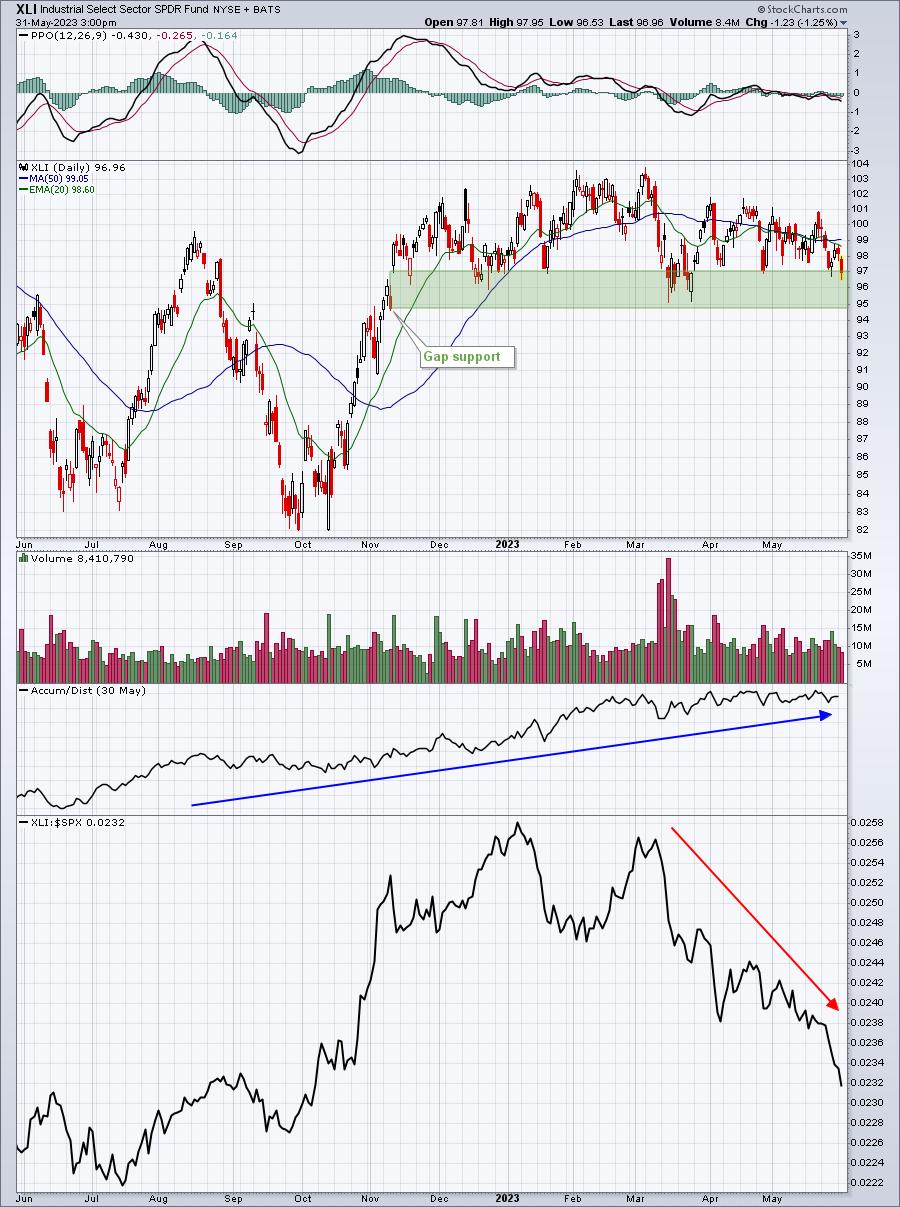
Since gapping higher in November from the 94.74 level, the XLI has found short-term bottoms from there up to roughly 97.00. We've tested this area on multiple occasions, but we've yet to fail to hold. Secular bull markets thrive on rotation. Money has rotated away from industrials and into growth areas in 2023. As a result of the XLI consolidation, the XLI has dropped rapidly on a relative basis. I'm okay with that so long as price support holds. Over the next couple days to couple weeks, it'll be very important for the XLI to hang onto the price support zone highlighted in green above.
ChartLists/Strategies
I've just about completed the Raised Guidance ChartList (RGCL) and I'm hoping to update several of the ChartLists, along with the RGCL, by Friday. In the meantime, here are two additional charts on the RGCL that I think look interesting here:
ENR:
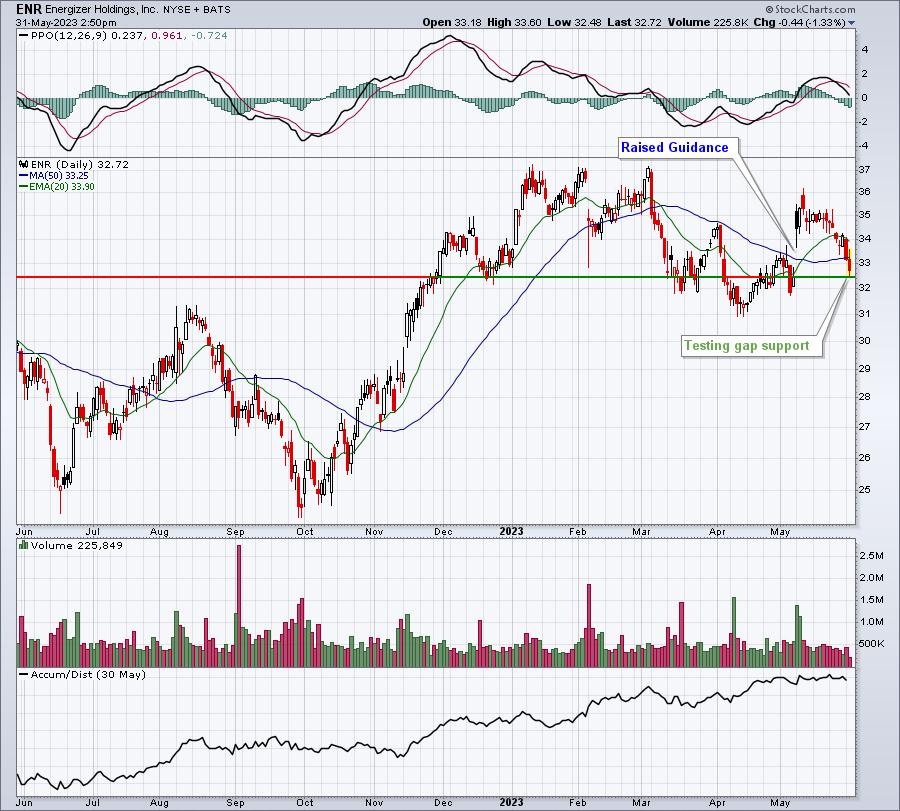
Tested key gap support.
EVRI:
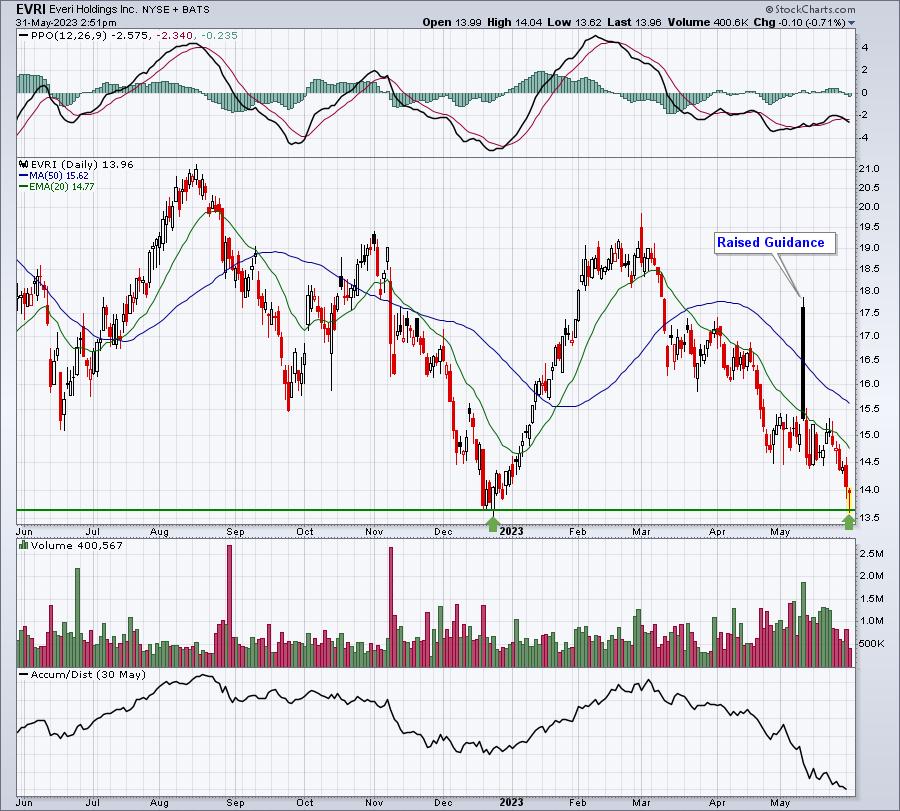
Testing major price support after gapping up just 2-3 weeks ago to 17.70 or so.
TDG:
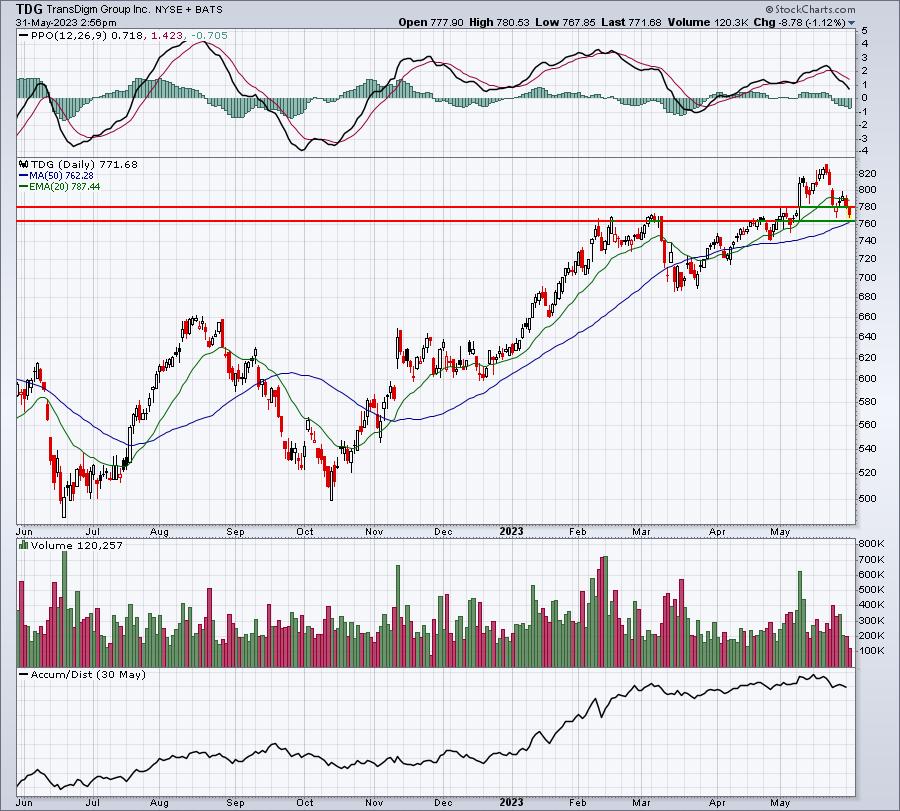
This is one of our portfolio stocks and I see solid price support in the 765-780 range and we're sitting squarely in the middle of it.
Earnings Reports
Here are the key earnings reports for the next two days, featuring stocks with market caps of more than $10 billion. I also include several companies with market caps below $10 billion. Finally, any portfolio stocks that will be reporting results are highlighted in BOLD. If you decide to hold a stock into earnings, please understand the significant short-term risk that you are taking. Please be sure to check for earnings dates for any companies you own or are considering owning.
Wednesday, May 31:
CRM, CRWD, VEEV, NTAP, OKTA, CHWY, PSTG, DCI, CAE, AAP, DSGX, PVH, CPRI, AI, FRO, NCNO, JWN, VSCO, PHR
Thursday, June 1:
AVGO, VMW, DG, LULU, DELL, HRL, MDB, ZS, COO, IOT, FIVE, ESTC, GWRE, BILI, ASAN, M, CHPT
Economic Reports
May Chicago PMI: 40.4 (actual) vs. 47.0 (estimate)
Beige book released at 2:00pm ET
Happy trading!
Tom