
EB Daily Market Report - Thursday, June 1, 2023
Executive Market Summary
- Futures were mixed overnight and we had bifurcated action at the opening bell
- The ADP employment report was better than expected, as were initial jobless claims and unit labor costs
- After the initial weakness, our major indices climbed throughout the session, though they've turned a bit weaker in the past 20 minutes
- Energy (XLE, +1.45%) is the best-performing sector, taking a cue from the rebound in crude oil prices ($WTIC, +2.98%) to $70 per barrel
- Materials (XLB, +1.17%) and industrials (XLI, +1.10%) also are showing strength
- The sector scorecard is flipped today as all four defensive sectors are in the bottom four positions
- The 10-year treasury yield ($TNX) is down 3 ticks to 3.61%, a third consecutive day of bond market strength
- Oil equipment & services ($DJUSOI, +5.13%) is having its best day in two months and one of its best days of 2023
- Network Appliance (NTAP, +8.58%) is one of today's best performing stocks after releasing its latest quarterly results, which exceeded Wall Street consensus estimates
Market Outlook
Perhaps my favorite sustainability ratio is consumer discretionary vs. consumer staples (XLY:XLP). When the S&P 500 is rising, I love to see the XLY:XLP ratio moving higher too, as it suggests that the market is in "risk on" mode, an environment that encourages higher prices ahead. There is no doubt that May has been very, very good to this ratio:
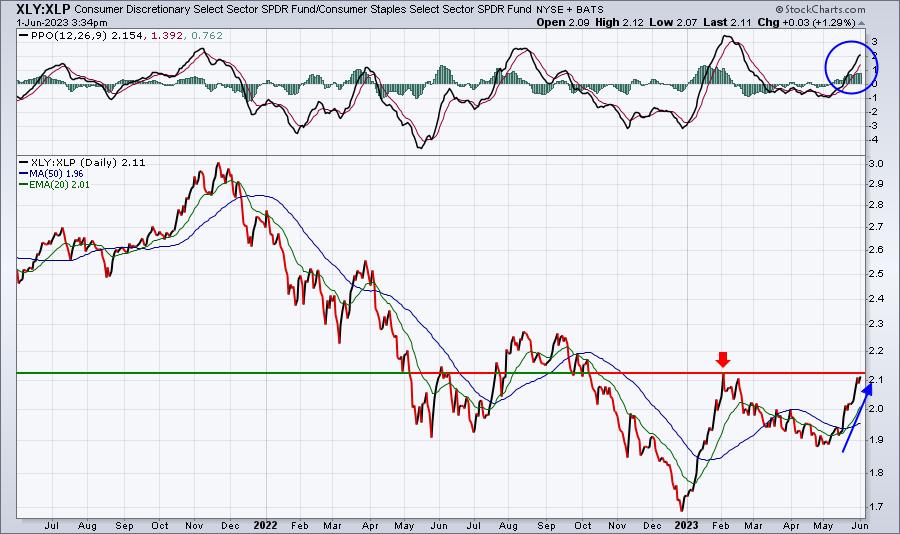
A break above the 2.13 level would be yet another bullish signal, one signaling that we're quite likely to see a sustained rally over the balance of 2023. That's what most of my signals have been telling me since last summer.
Sector/Industry Focus
Transports ($TRAN) are showing nice strength today. I'm waiting for a big breakout above the recent downtrend line:
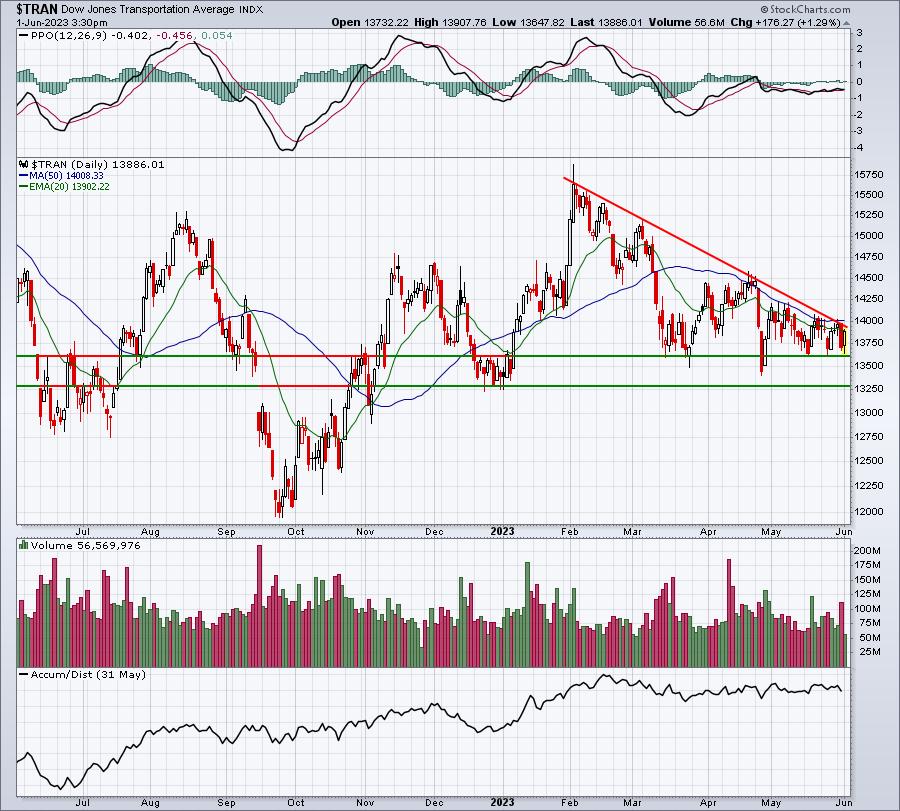
Key price support has been in the 13300-13600 range, while the downtrend line suggests a breakout would occur on any close above 14000. Transports have been lagging and holding back the Dow Jones, in particular. A breakout would be very bullish, in my view.
ChartLists/Strategies
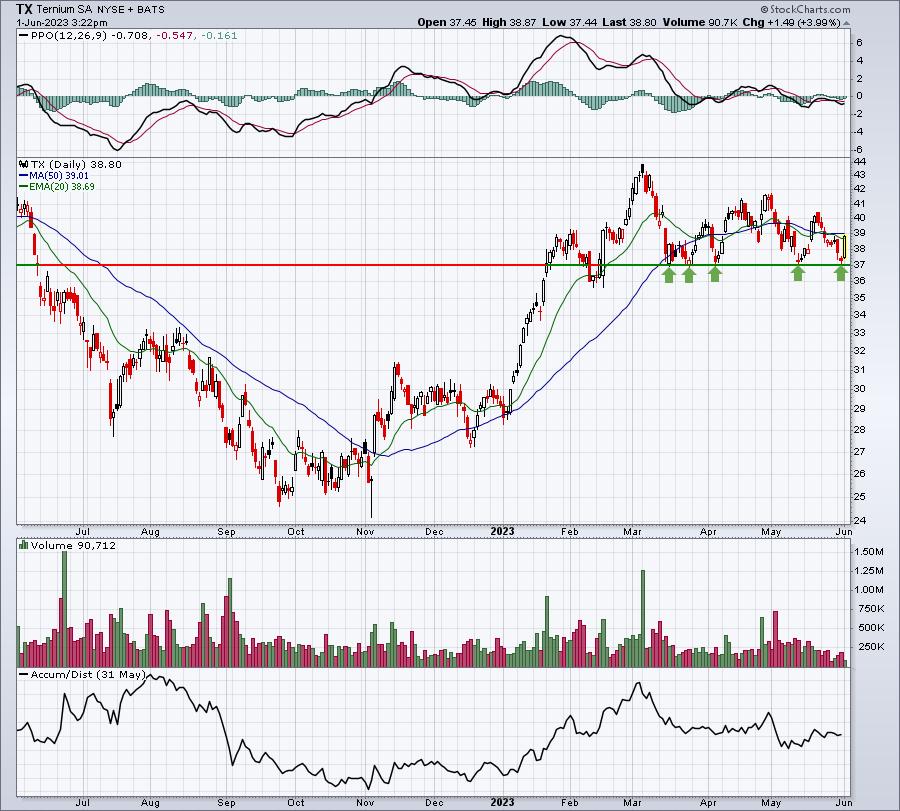
The following charts come from our Strong Earnings ChartList (SECL) and help to explain why we like entries at or near key price support levels:
TX:
ALGN:
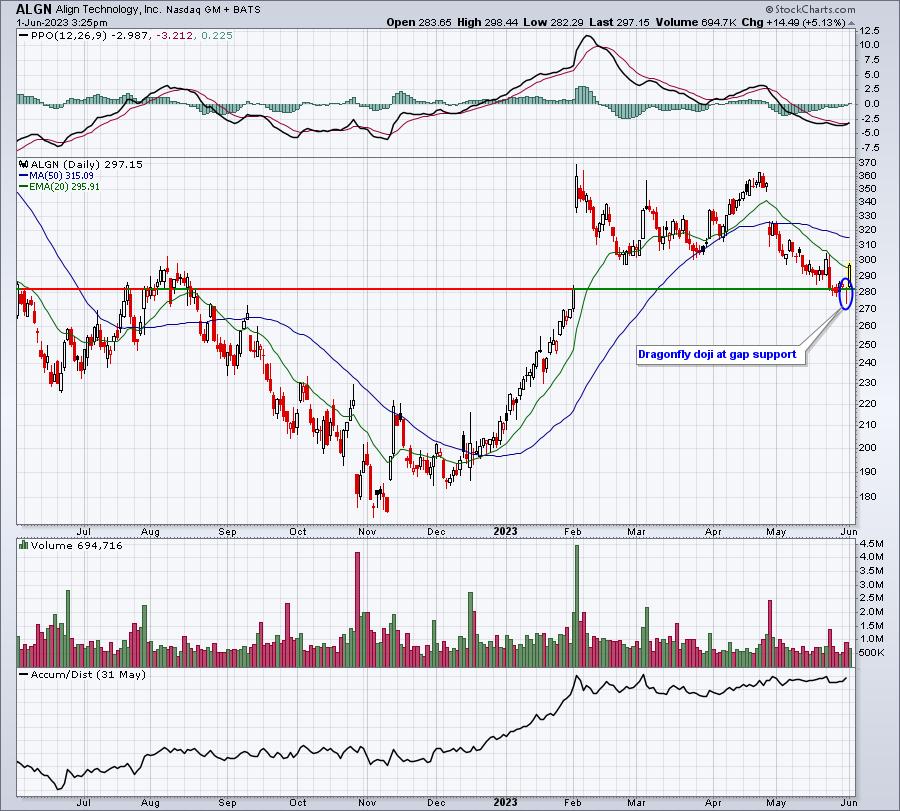
As we work through all the various charts that we organize in our ChartLists, we need to continue to train our eyes to find opportunities like these two. That's why I've provided several charts the past few days to illustrate this concept of buying at price support - ENR, EVRI, etc.
Earnings Reports
Here are the key earnings reports for the next two days, featuring stocks with market caps of more than $10 billion. I also include several companies with market caps below $10 billion. Finally, any portfolio stocks that will be reporting results are highlighted in BOLD. If you decide to hold a stock into earnings, please understand the significant short-term risk that you are taking. Please be sure to check for earnings dates for any companies you own or are considering owning.
Thursday, June 1:
AVGO, VMW, DG, LULU, DELL, HRL, MDB, ZS, COO, IOT, FIVE, ESTC, GWRE, BILI, ASAN, M, CHPT
Friday, June 2:
None
Economic Reports
May ADP employment report: 278,000 (actual) vs. 160,000 (estimate)
Initial jobless claims: 232,000 (actual) vs. 235,000 (estimate)
Q1 productivity (2nd estimate): -2.1% (actual) vs. -2.7% (estimate)
Q1 unit labor costs (2nd estimate): 4.2% (actual) vs. 6.3% (estimate)
May ISM manufacturing: 46.9 (actual) vs. 47.0 (estimate)
April construction spending: +1.2% (actual) vs. +0.2% (estimate)
Happy trading!
Tom