
EB Daily Market Report - State of the Market, Part 2 - Thursday, June 22, 2023
Trading Places LIVE
We will be making changes to our Trading Places LIVE shows starting sometime in July, so stay tuned for announcements. We're still working out details and considering different possibilities. One change that's already taken place - and completely out of our control - was StockCharts.com's decision to move away from their 24/7 streaming TV channel. Of course, my show has been recorded since the 2020 pandemic and played back at 9am ET on their channel since. Because they are no longer producing content for a streaming channel, the availability of my recorded shows on Tuesdays and Thursdays has changed. It will no longer be broadcast there at 9am ET like it's been in the past. Instead, my show is posted to my "card" at StockCharts and can be accessed sometime later in the morning if you click on the StockCharts TV link at the top of their home page. It will continue to be posted on YouTube, but that typically doesn't occur until late morning the day of the show.
Next, I will be traveling on Friday and Monday as I have an out-of-town family reunion this weekend. It's VERY unlikely that I'll have time to write a Weekly Portfolio Report this weekend, so just assume that we won't have one. Also, I'll definitely be canceling our TP Live show for Monday morning. There will most likely be abbreviated DMRs on both Friday and Monday. We should be back to normal on Tuesday. I appreciate your understanding so that I can spend some time (and golf) with family this weekend!
Today's Brief Market Update
Before I complete our 2-part series, State of the Market, let me point out a couple things from today's trading:
First, I've been discussing that the best leveraged entry (TNA) into small caps was on a 20-day EMA test on the IWM. That occurred this morning, as follows:
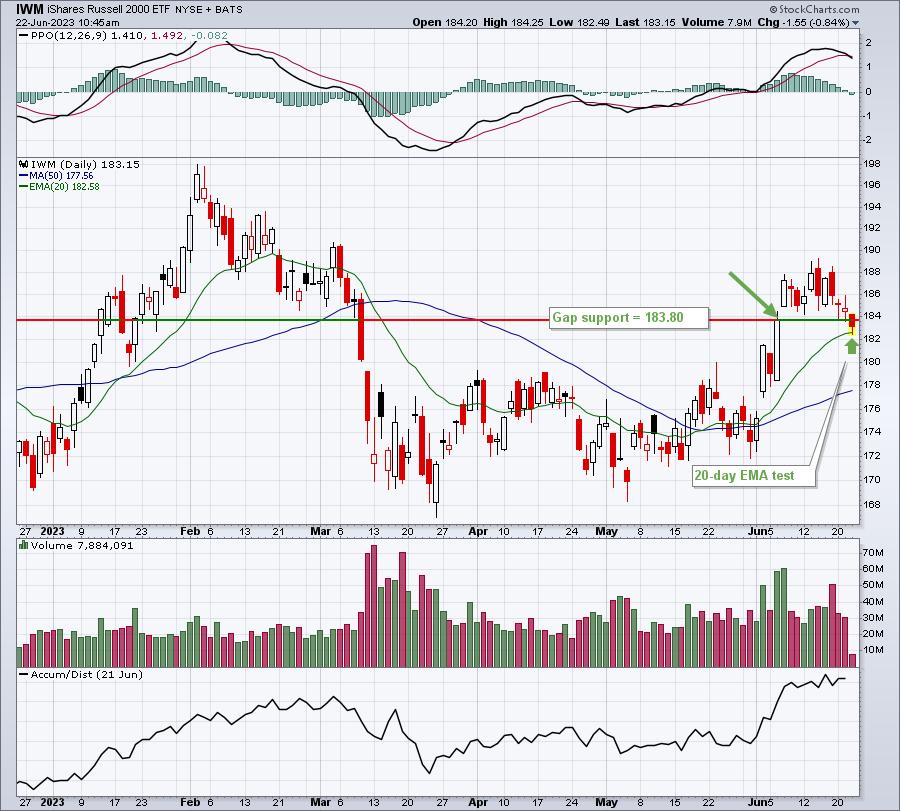
We've had a successful test of the 20-day EMA and we quickly bounced back to the gap support level at 183.80. We moved lower after that, however, so let's see where we close today. Short-term, a close over the 20-day EMA is good. A close over 183.80 gap support would be more bullish, potentially ending today with a hammer. A close below the 20-day EMA would open up downside to perhaps 179-180. That's where we had overhead price congestion prior to the latest breakout.
Tesla's (TSLA) candle from yesterday is a perfect illustration of what to look for to take profits. After a lengthy uptrend, volume accelerated and a bearish engulfing candle printed. While it's certainly no guarantee, that type of reversing candle increases the odds significantly of further short-term selling. Check out TSLA's chart:
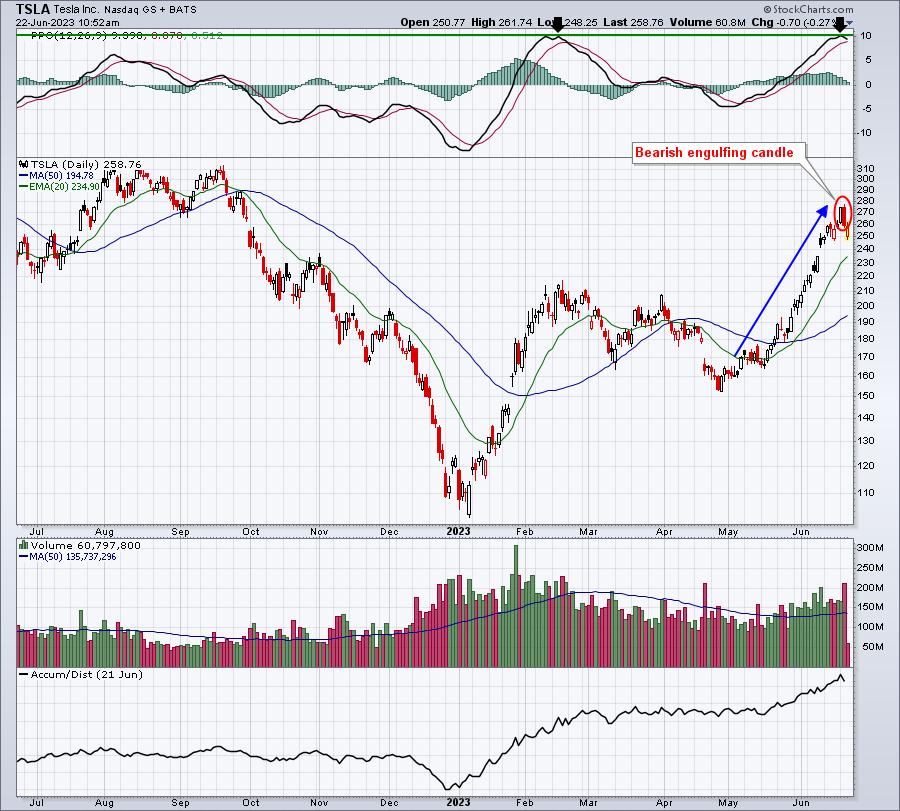
This could be a short-term top for TSLA, very similar to the top we saw in February. Check out the eerily similar PPOs. I'd be surprised if the subsequent selling was as heavy, but a 20-day EMA test isn't out of the question.
Let's move on to the State of the Market, Part 2, which will cover U.S. stocks.
Sentiment - Put Call Ratio
I want to start with sentiment, because I'm a HUGE believer that sentiment helps to drive market action - both in the short-term and the long-term. At the beginning of 2022, at MarketVision 2022, I indicated that sentiment was the market's biggest problem. It wasn't inflation, the Fed, potentially higher interest rates, a recession, blah, blah, blah. It was clearly sentiment to me. Everyone was all in. The wallstreetbets.com folks viewed the stock market like they did an ATM machine. Just buy a stock and cash in. It was simple. That's the euphoria that sets in after the S&P 500 rises 115% in 22 months. I always talk about perspective and you have to realize that the S&P 500 averages gaining 9% a year since 1950. Going up 115% in less than two years is UNSUSTAINABLE, period!
This is just pure common sense. If you take our GDP, add in a mild inflation rate, and then add in a few more points for innovation, you'll essentially come up with why the S&P 500 rises 9% a year over time. When the market rises too much, those lacking perspective, begin to believe that "trees will grow to the sky", but sadly they don't. Reality sets in, usually in the form of a bear market, which helps to explain why I was extremely cautious to open 2022 and suggested there was the potential for a 20-25% drop on the S&P 500 to 3500-3800 - before the cyclical bear market ever began!
I like the equity-only put-call ratio ($CPCE) as my "go to" for sentiment. I have a short-term indicator ("speed boat") that I like to watch for short-term reversals and a long-term indicator ("freight-liner") that helps me spot MAJOR turning points in the stock market that can last for many months, even years. Let's start with the former.
5-day SMA of the CPCE (speed boat):
I don't know of a better indicator in terms of spotting short-term tops and bottoms. The following is a long-term daily chart of the S&P 500 with an indicator window below that demonstrates just how incredibly accurate short-term sentiment can be in spotting key reversals, especially key market bottoms:
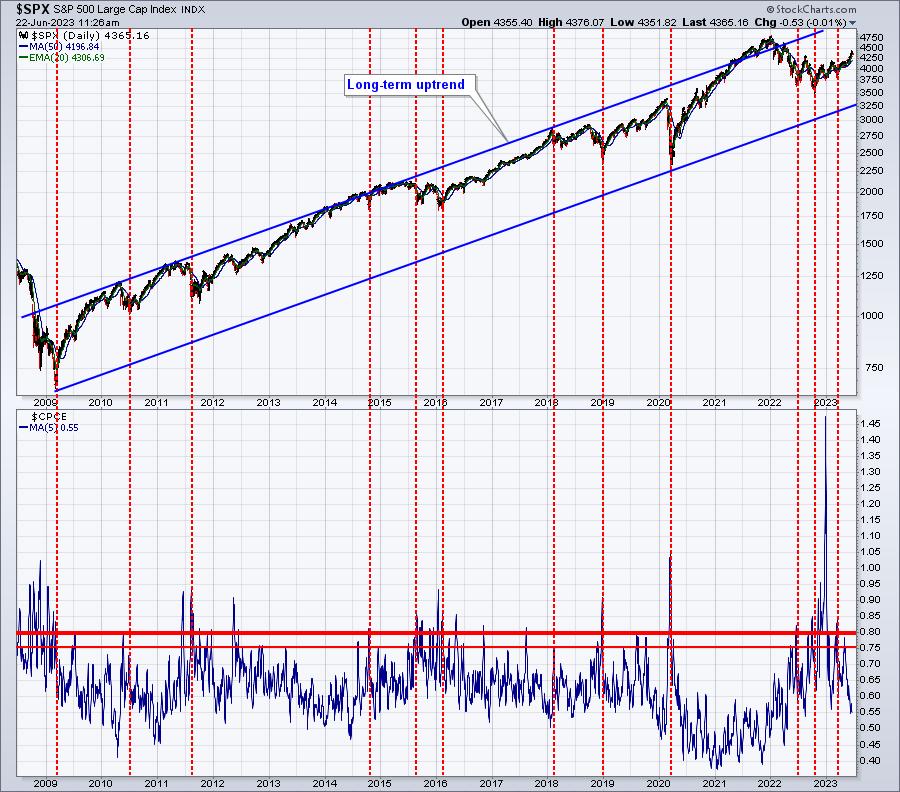
I don't find it as useful at marking key market tops. Extreme complacency over an extended period of time can be problematic, as it was to start 2022. But a short-term period of complacency is often times followed up by more complacency. Secular bull market advances can get quite boring, rising nearly every single day, as bears continue to be forced to cover (buy) short positions, adding more fuel to the bulls' rocket.
253-day SMA of the CPCE (freight-liner):
This one is really important in my view. It takes a long, long time for sentiment to shift from extreme bullishness to extreme bearishness. I said at the beginning of 2022 that we needed a sentiment "reset" in order to resume the long-term secular bull market. And that it would likely require a lot of pain (lower prices) along the way in order to shift folks' mindset. Well, I believe the process of shifting began in April/May 2022 and has now fully completed the process. Check this out:
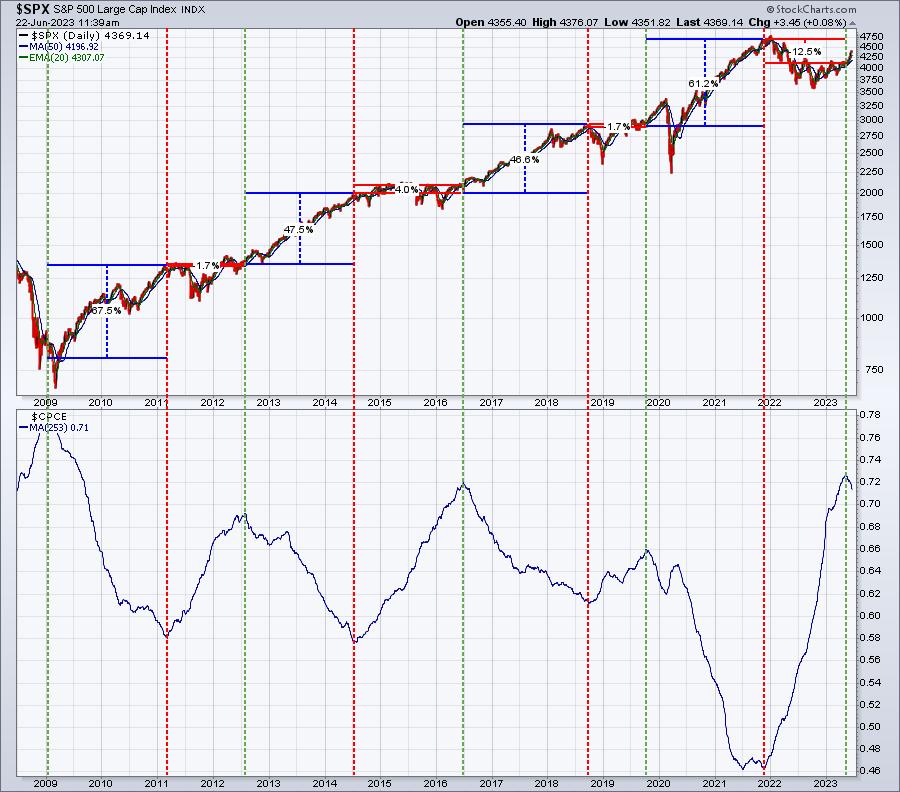
It takes a long time for this 253-day SMA of the CPCE to reverse course. But when it does, it has very measurable consequences for the S&P 500. In every instance, when the extreme pessimism begins to subside and this 253-day SMA starts to roll over, it's an EXTREMELY BULLISH time to enter the stock market. That's EXACTLY what's happening right now. These reversals do not always coincide perfect with market tops and/or bottoms, but they're generally close. When the CPCE tells us that options traders are too bullish (extreme low 253-day SMA readings) and we begin to turn higher - just as we did to enter 2022 - the opportunity for market strength is very limited. However, once everyone has turned bearish, exhausted selling takes place, and this 253-day SMA of the CPCE begins to roll over and start moving lower, it precedes the absolute biggest stock market advances. That's where we're at right now. And, quite honestly, this just makes perfect common sense, doesn't it? When everyone has thrown in the kitchen sink and the bearishness is overwhelming, who's left to sell?
I am extremely bullish right now and told our EB.com members that I was going all in just over a year ago at the June 2022 bottom. There are plenty of reasons for that change in heart, and I'll discuss more of them below, but the rapidly-declining sentiment in June 2022 was one of the contributing factors. Now it's simply beating us over the head to be invested on the long side.
Sentiment - Volatility Index ($VIX)
Keep in mind that the VIX is priced based on premiums on short-term S&P options. The premiums on these options are established by market makers. If market makers see turbulence ahead, premiums rise, and so too does the VIX. If, however, market makers are forecasting less volatility, it generally means they see higher prices ahead for the S&P 500, resulting in less volatility and lower premiums. There are times when the S&P 500 drops, which normally triggers higher VIX readings as market makers price in that increased volatility. Occasionally, though, we'll see the S&P 500 fall and the VIX fall with it. That's a tell-tale sign that it's less likely that we'll see selling morph into more dramatic selling. Instead, I use this signal at a potential reversal. Remember this headline?
"This Sentiment Signal Is Solid And Says We Could Soar Short-Term"
You can click on this headline to learn more about how I use the VIX in my trading. It's important to realize that the day after I wrote about it, the S&P 500 surged during the balance of January to post its 6th-best January since 1950. The market gave us clues, but most traders are completely unaware of how to interpret certain VIX developments.
Longer-term, one thing I've learned through multiple bear markets is that once the VIX drops beneath the 16-17 level, you can FORGET about all the bear market talk. It's over. History proves me correct on this. As an analogy, does every thunderstorm produce tornadoes or the threat of tornadoes? No, not every bad storm results in a tornado or the fear of one. The stock market is similar. Even while you're in the midst of a serious stock market storm, if the VIX drops below 16, a market tornado has never formed. Today, the VIX is at 13.44. While many analysts are still calling for the resumption of the 2022 bear market, I just do not see it. Could it happen? Sure, but I believe the odds are so low that I believe there's much more risk sitting on the sidelines and missing a HUGE bull market advance than being in the stock market and seeing it return to the 2022 bear market low.
Everyone has to make their own personal investing decisions, but I base mine on a healthy dose of perspective and the best research on the planet. We're going higher.
Technical Considerations
Some have inferred I don't follow technical analysis, because of all the research I do and the non-traditional means of calling market tops and bottoms. Hogwash. I'm very well-versed on technical analysis. But you have noticed that a large number of technical analysts are just now coming to the realization that the bull market is back? The S&P 500 is nearly 1000 points (!!!!!!!) off the low and expert TAs are saying to GET IN. Doesn't that seem odd? Call me crazy, but isn't it better to jump in when the S&P 500 is at 3600, rather than 4400? One problem with technical analysis is that it tells you everything is great AFTER everything is great. Few technical indicators are "ahead of the game". That's why I do additional research. I believe technical analysis is GREAT to help manage risk during uptrends and downtrends. Unfortunately, it's just not very good at calling tops and bottoms - at least not the long-term variety.
Now that the bottom is in and we're in a clear uptrend, I love to use technical analysis to help me find solid support/resistance levels and to evaluate momentum, or the lack thereof. Let's check out the S&P 500 over different time frames:
S&P 500 Long-Term Monthly Chart:
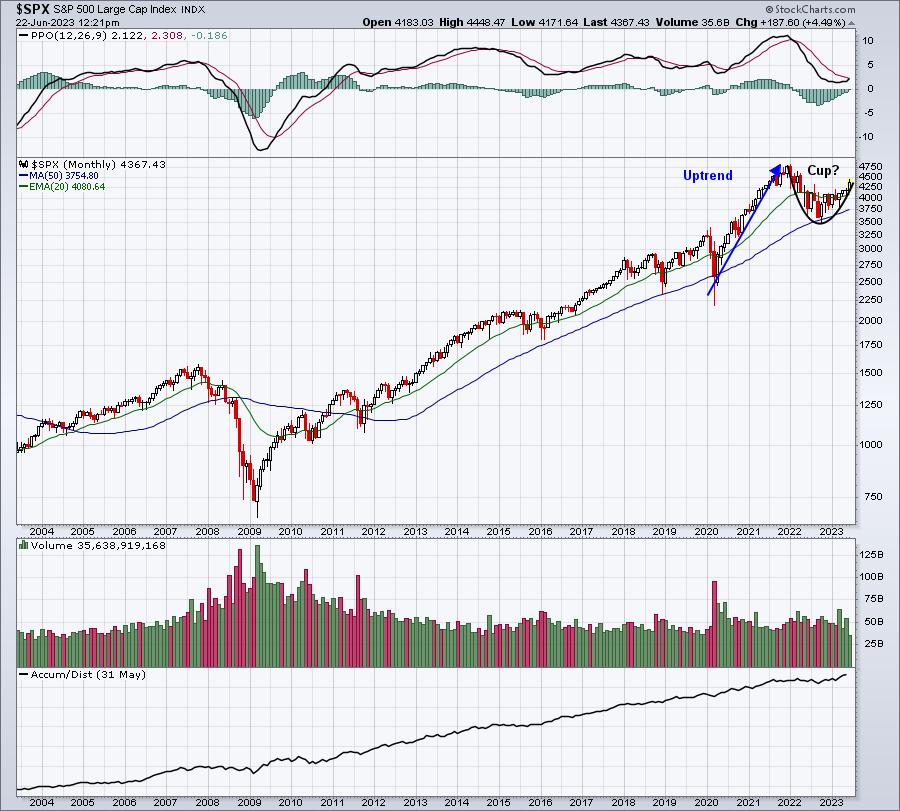
It certainly looks like a bullish cup forming after an extended uptrend. This is where perspective comes in handy. Many don't have the ability to step back and see the big picture, which, in my opinion, remains extremely bullish.
S&P 500 Intermediate-term Weekly Chart:
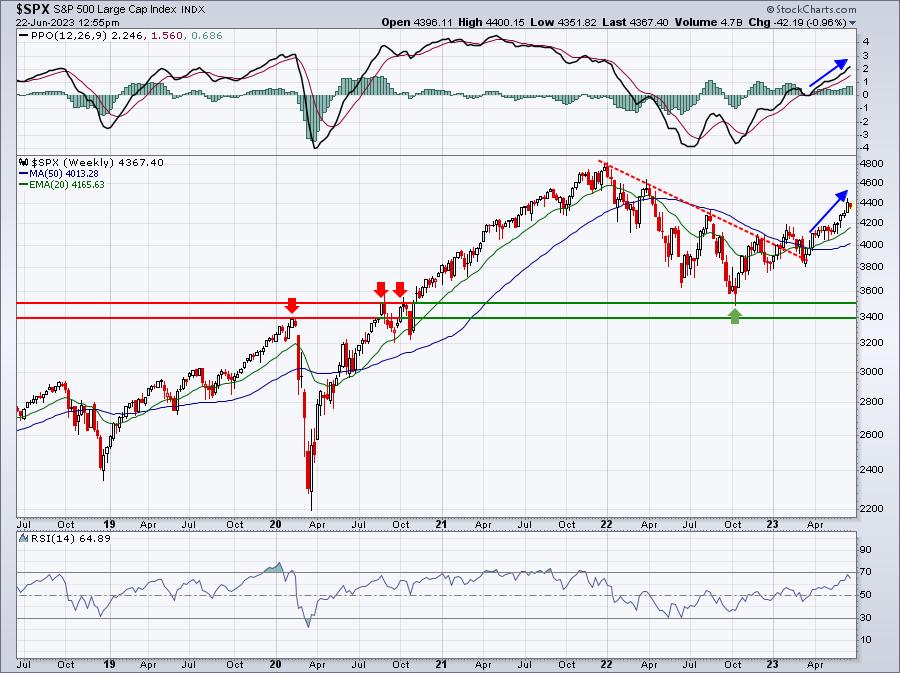
Note a few things here. First, it's clear that the downtrend of 2022 (lower highs and lower lows) has been broken. the configuration of price and moving averages is very bullish. Current price action is well above its rising 20-week EMA, which in turn, is well above its now-rising 50-week SMA. This type of action does not occur during bear markets.
Also, the weekly RSI doesn't usually push through 60 in a downtrending bear market. The fact that we just hit RSI 70 supports my theory that the secular bull market has resumed.
S&P 500 Short-term Daily Chart:
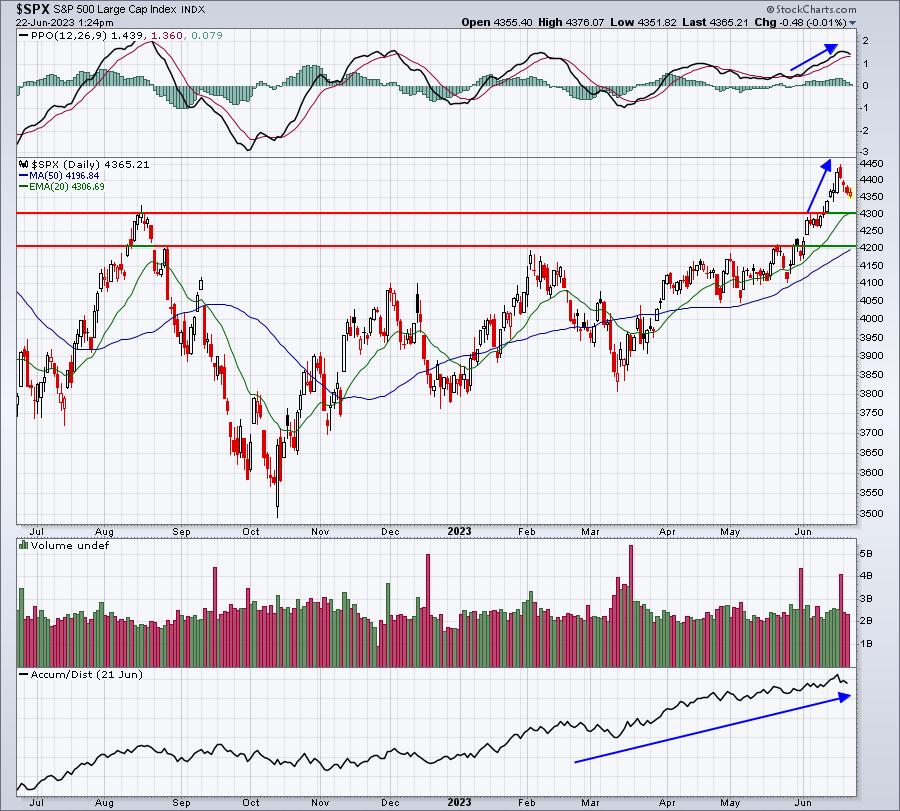
The AD line, which moved up and broke out earlier in 2023, continues to climb, suggesting that this rally has legs. Normal profit taking does occur from time to time, though, and I've provided a couple of key short-term support levels that I'll be watching. I'd be surprised at this point if the S&P 500 were to fall back below 4200. I don't see it happening, but I never say never. I would just consider it very unlikely.
Manipulation
Before you ever invest $1 in the stock market, you need to understand the ridiculous conflict of interest in play on Wall Street. Big Wall Street firms buy stocks for themselves and their wealthy clients. They also have stock analysts (I like to call them "influencers") that parade on CNBC and other media outlets, telling us all what to buy and sell. That's so nice of them <sarcasm>. Finally, many of these same firms have market making units that allow them to do the opposite of what their "influencers" are telling us to. So remember that when a Goldman Sachs "influencer" shows up on CNBC and says to BUY, it's quite likely that their market making unit is providing liquidity and selling us those shares that we buy. Our financial system is set up to LINE THE POCKETS of the big Wall Street firms. Sorry, but there's no other way to put it. They have tremendous advantages and coerce retail traders to buy and sell all the wrong stocks at all the wrong times. It's why the majority of traders feel that they can't make money in the stock market over time.
I showed throughout 2022 how market makers were accumulating shares throughout the trading day. It was quite evident to me on both the SPY and QQQ. We saw PURE DISTRIBUTION from January through May of 2022. But, from that point on, morning selling gave way to afternoon buying. The headlines remained very negative and the big gaps to the downside encouraged panicked retail traders to sell in the first 60-90 minutes of trading - what I like to refer to as "amateur hour". Then the big Wall Street firms would show up and begin accumulating. Look at this chart of the QQQ and how it traded during the trading day:
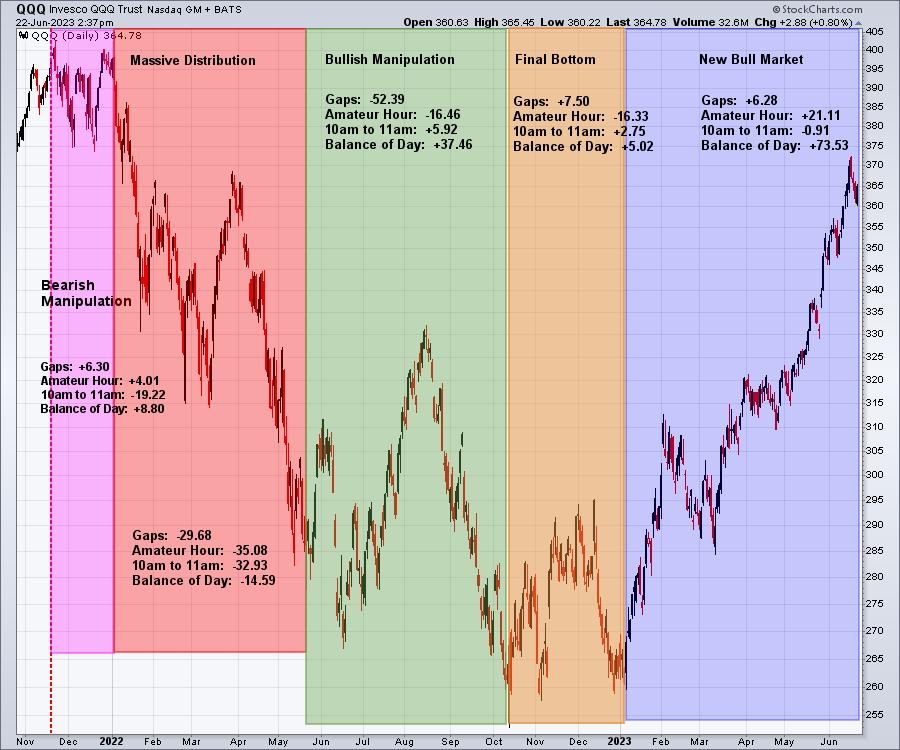
Those intraday numbers are astounding if you look at them closely. The selling at the open and during "amateur hour" was intense, causing many individual investors to panic and sell in the mornings to end the pain. Meanwhile, the big Wall Street firms simply bought all they could and are now seeing tremendous returns as a result.
Listen to these stats. On November 19, 2021, the QQQ topped at 400.52. As of Wednesday's close, the QQQ stood at 361.90, a decline of 38.62 dollars. Here's the breakdown at how the QQQ has traded during various time periods throughout the trading day:
- Opening gaps: -61.70
- 9:30am-10:00am: -42.75
- 10:00am-11:00am: -44.39
- Balance of the day: +110.22
The total of all times of the day is that 38.62 difference, but do you see how the intraday trading went? So manipulative and it's what I started talking about in June of last year. I argued that the stock market would rally strongly as Wall Street firms were accumulating. Now we see the result.
Sector Relative Strength
During secular bull market advances, money rotates to the most aggressive areas of the market, particularly technology (XLK), consumer discretionary (XLY), and communication services (XLC). We tend to see money rotate away from the defensive areas like health care (XLV), consumer staples (XLP), real estate (XLRE), and utilities (XLU). Absolute performance tends to move higher across ALL sectors, but I'm talking about relative performance. We want to see the aggressive sectors performing best.
When the stock market topped at the beginning of 2022, the awful relative performance of aggressive areas during December 2021 as the S&P 500 hit fresh all-time highs was quite discouraging:
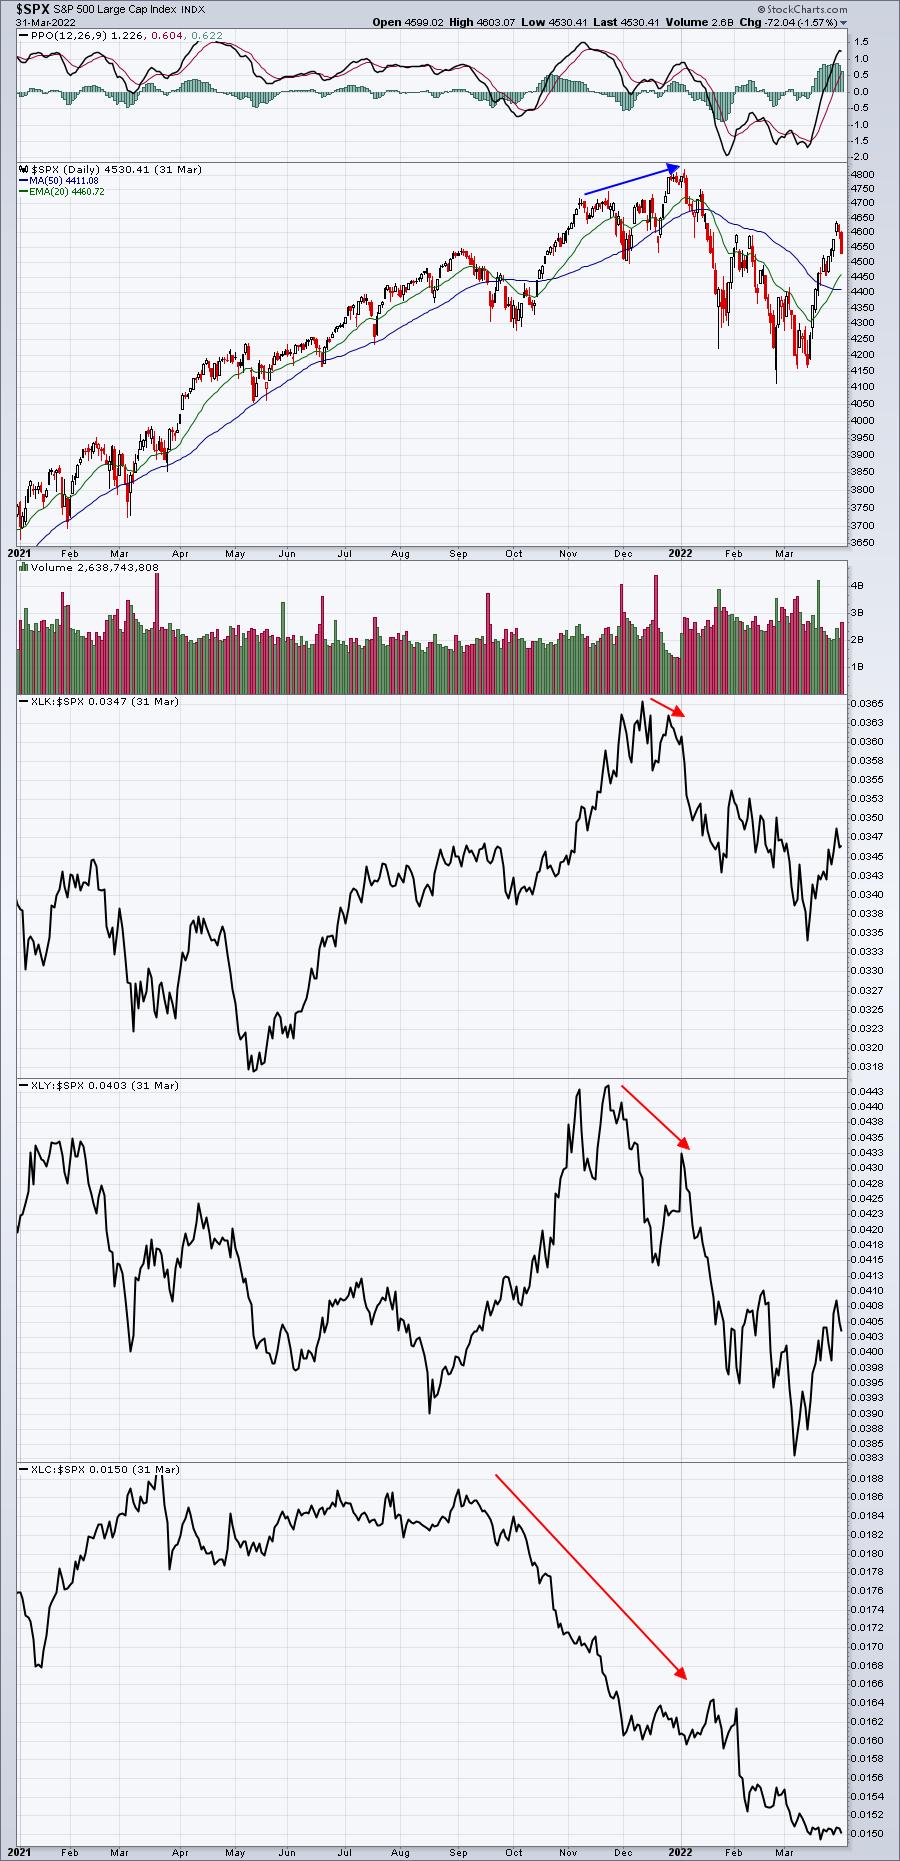
This was a big problem as Wall Street firms showed their first signs of bailing on the great bull market run of 2020/2021.
What do these groups look like today?
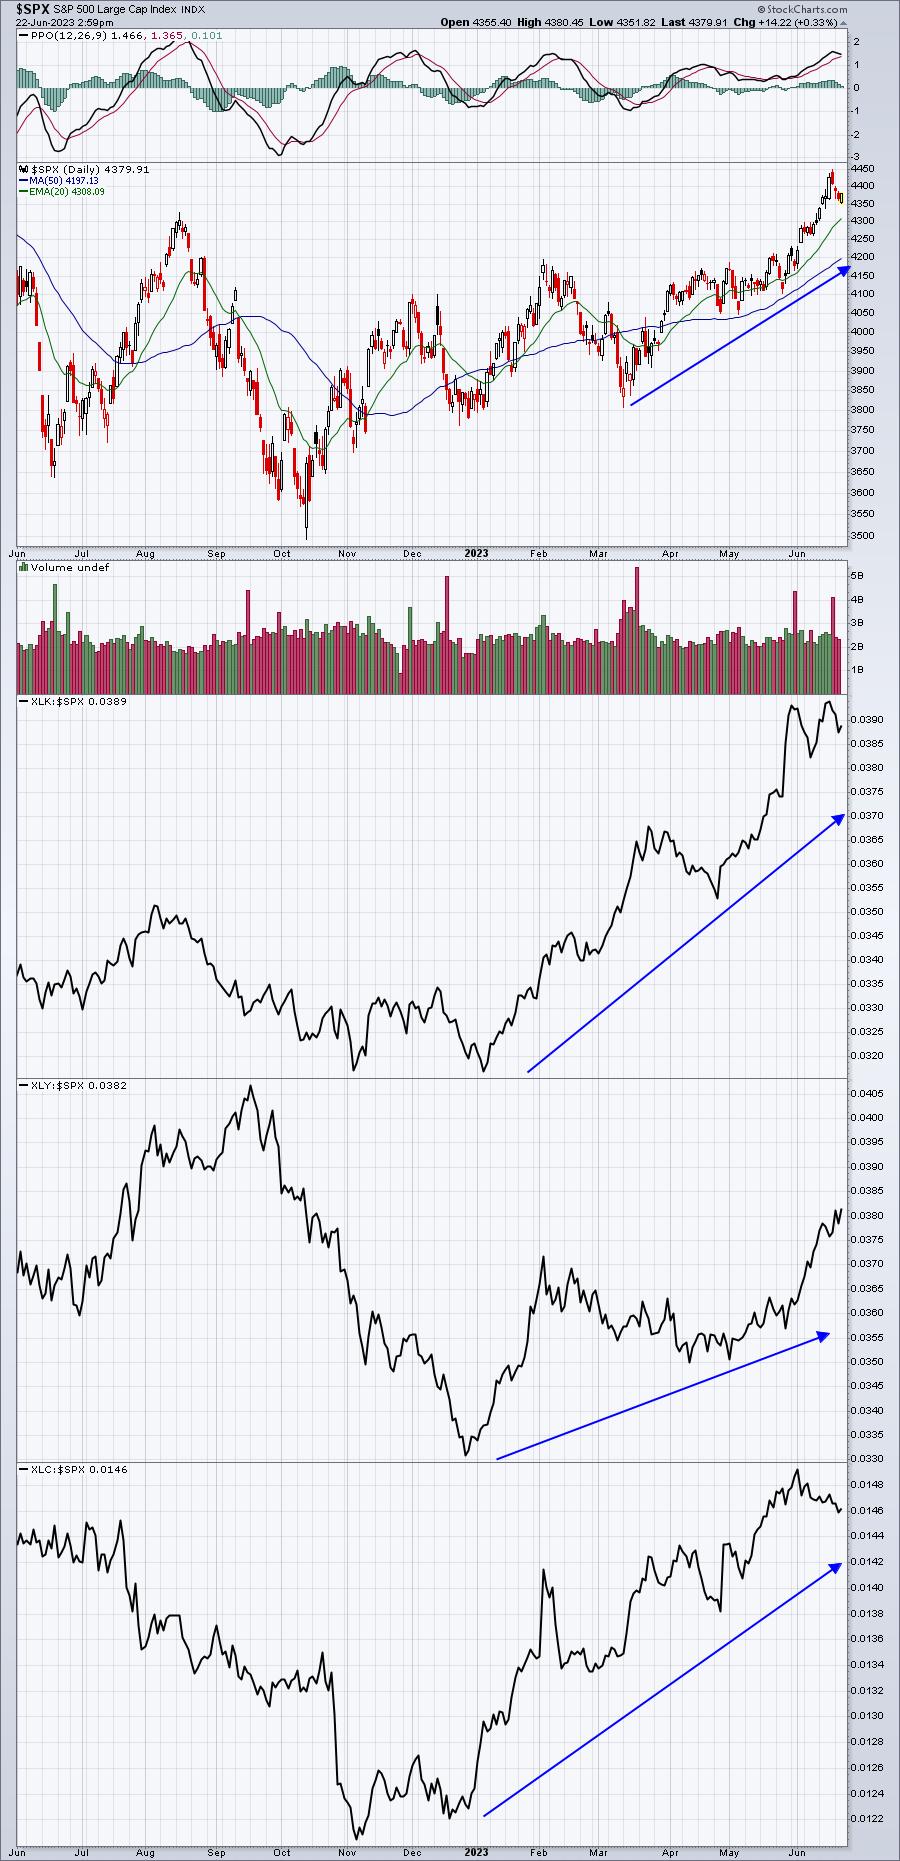
It's a much different picture now. Wall Street firms are rotating INTO these areas, not OUT of them. This is a very strong reason to believe that we're going to see higher prices ahead.
Sustainability Ratios
I like to make sure that money is rotating in bullish fashion in order to help sustain the bull market advance. The sector relative strength charts I showed you above are a part of this analysis. But I have others that I like to watch. Again, let's look at them as they stood at the beginning of 2022, just before the cyclical bear market kicked in:
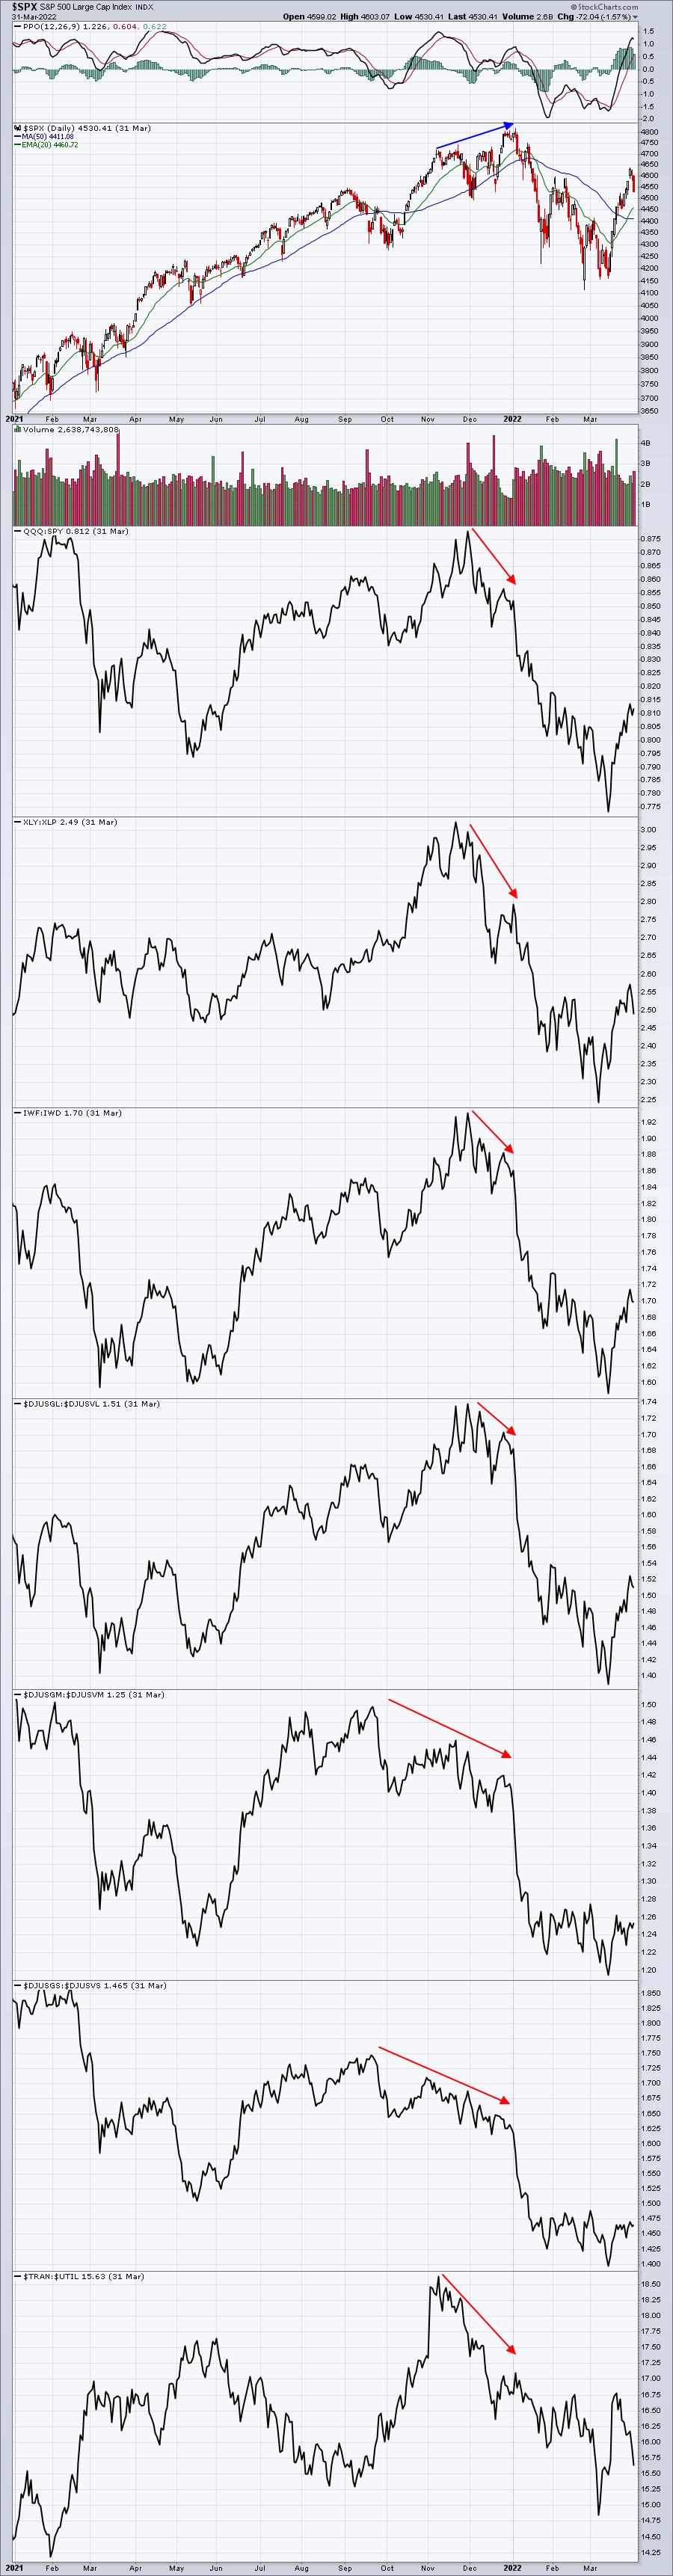
Every single important ratio was turning lower as money rotated OUT of aggressive or growth-oriented areas and moved to defensive or value-oriented areas. That was another MAJOR signal that a top was at hand.
What do these sustainability ratios look like today?
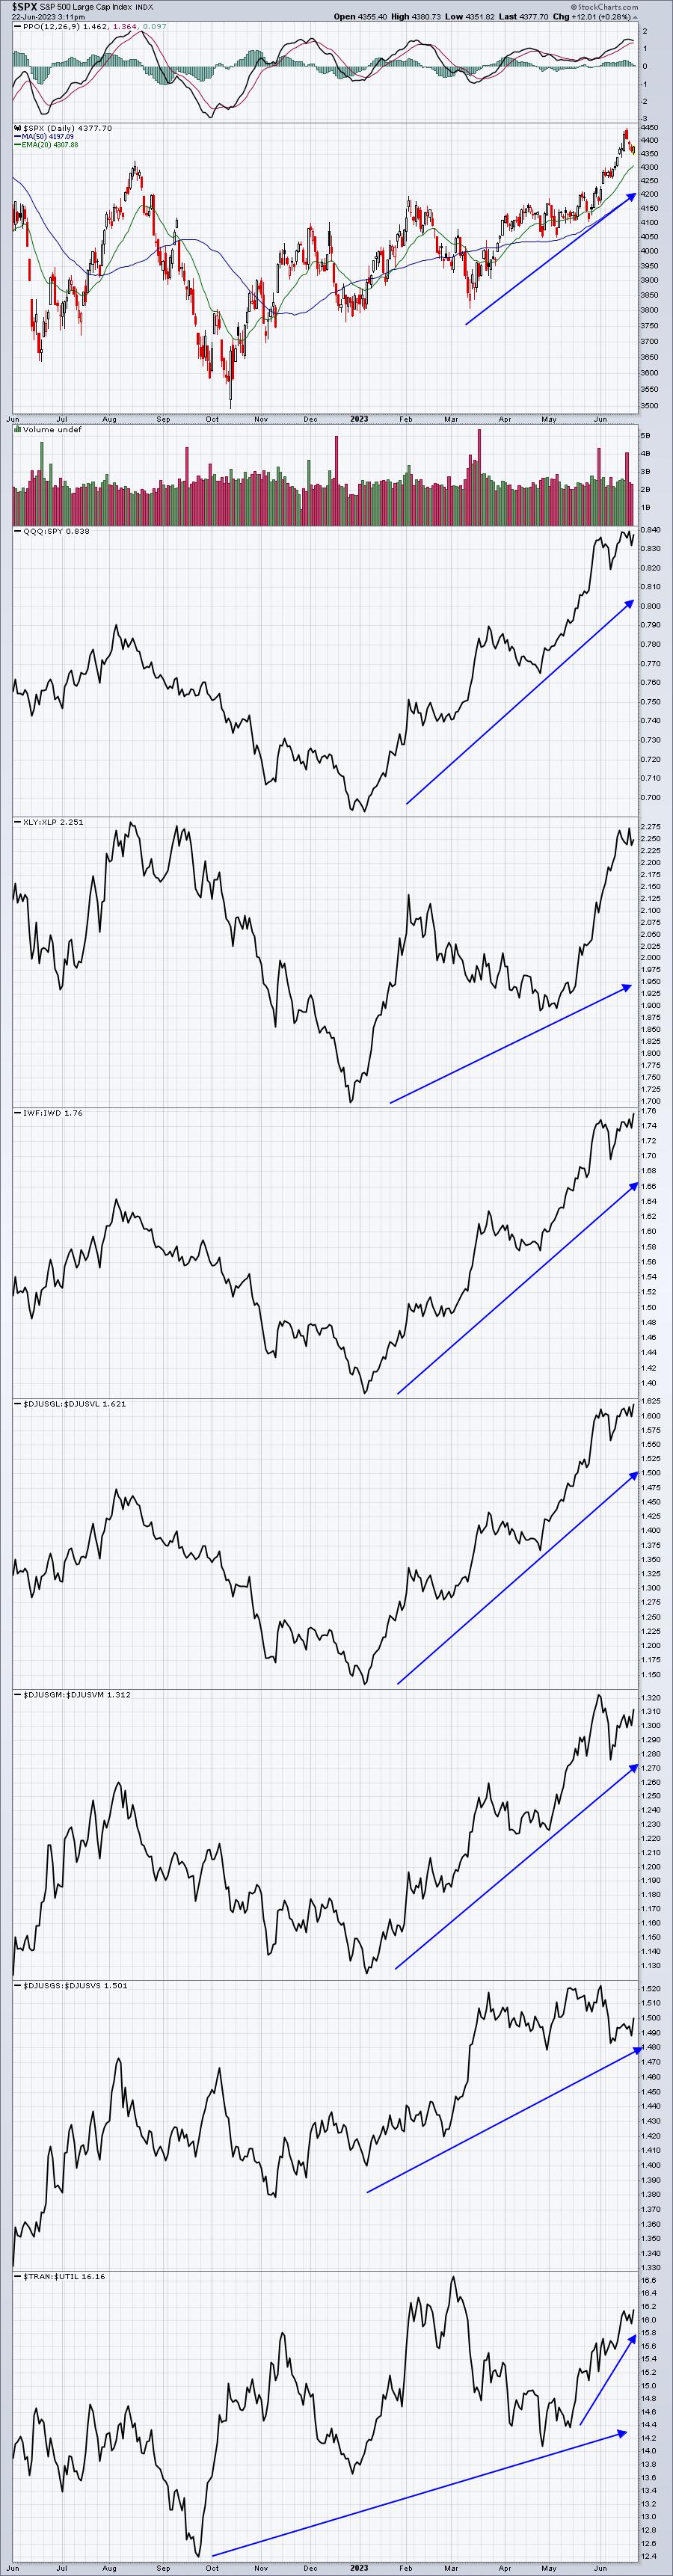
Do you see how much different this current market is than the one we experienced at the end of 2021/beginning of 2022? It's like night and day. When these ratios are moving up in unison with the S&P 500, history suggests we have a lot further to go to the upside on the S&P 500. That's why I believe we'll be at an all-time high on the S&P 500 by year end.
Transportation Stocks
Listen, when transportation stocks ($TRAN) move higher, so too does the S&P 500. History confirms this. Look at this long-term chart of the TRAN and check out its positive correlation with the S&P 500:
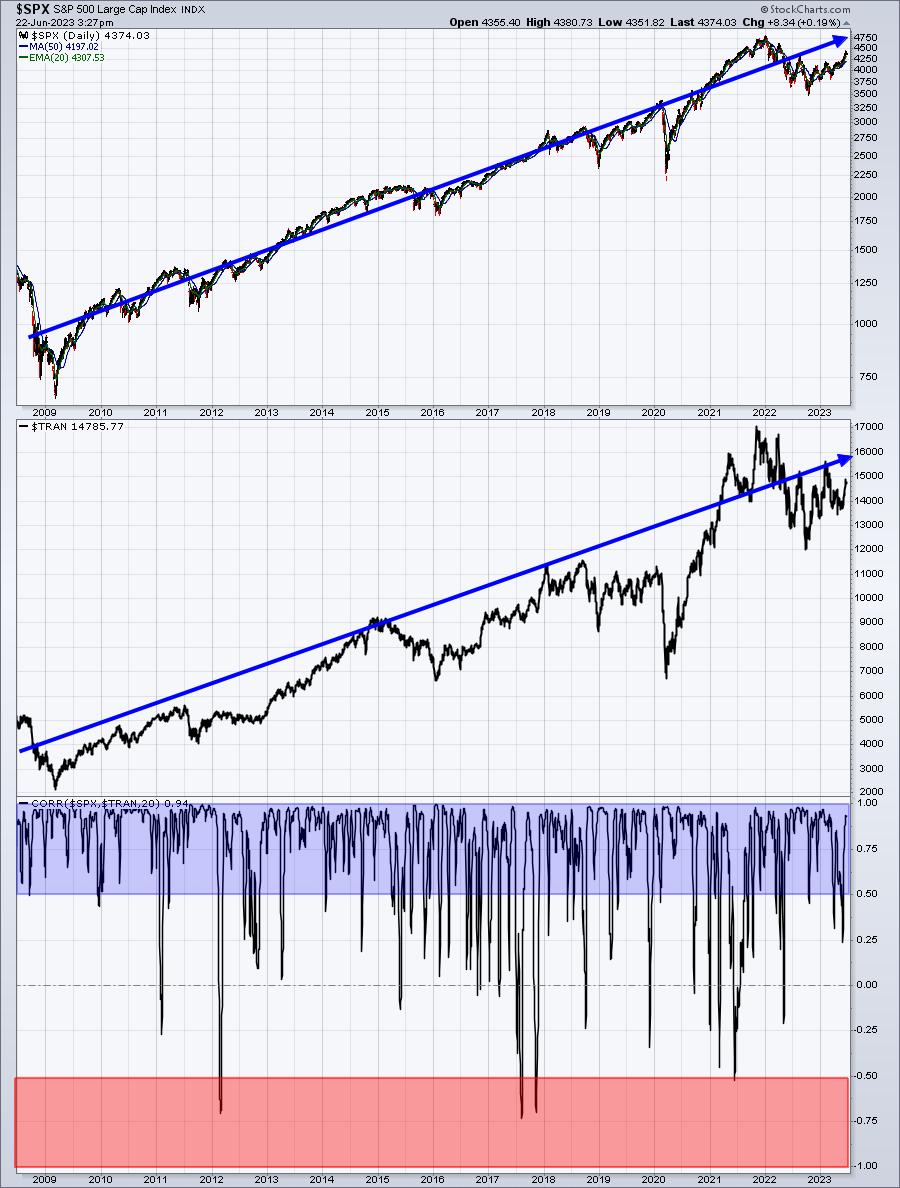
I love the correlation coefficient at StockCharts, because it really shows us visually what matters and what doesn't. A strong transportation group matters. We've begun to see it strengthening and I believe it's just getting started. Next is another chart of the TRAN. I believe it shows very obviously that when the transports break out, the S&P 500 is READY TO ROLL. Check out where the TRAN currently resides:
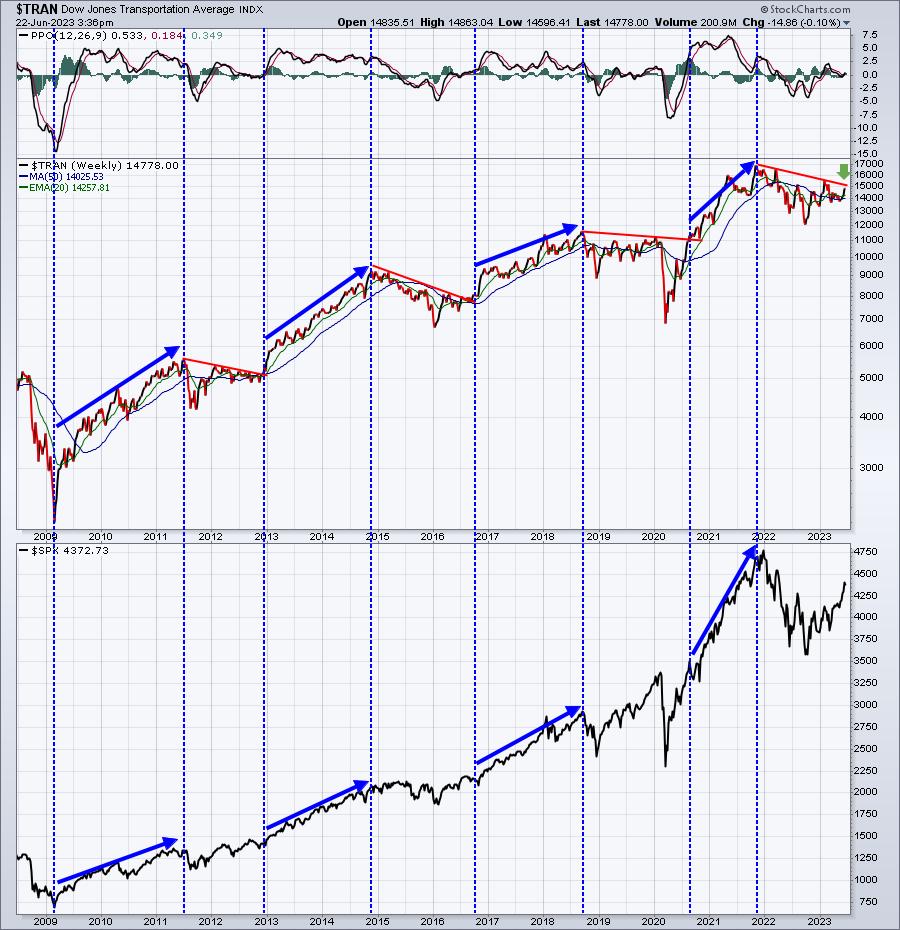
That green arrow says it all to me. I'm awaiting this MAJOR breakout in the TRAN. You can see what's happened over the past 15 years when the TRAN breaks out of a period of consolidation/weakness. The S&P 500 flies. As good as the S&P 500 has been since the October 2022 low, it's had very little help from transportation stocks, but that is all about to change. Watch the TRAN chart for yet another MAJOR bullish indicator.
Banks/Inverted Yield Curve
This is a topic that I completely understand. The inverted yield curve occurs when short-term treasury yields move above long-term treasury yields and this is a signal of trouble for banks ($DJUSBK), in particular, and can be for the overall market in general. It simply depends on whether the shrinking profits at banks result in a much tighter lending environment. If banks truly grow conservative, it can have a negative impact on economic growth. When I see an inverted yield curve, I mainly tend to stay away from banks until their relative performance begins to suggest things are improving. Here's where we are right now:
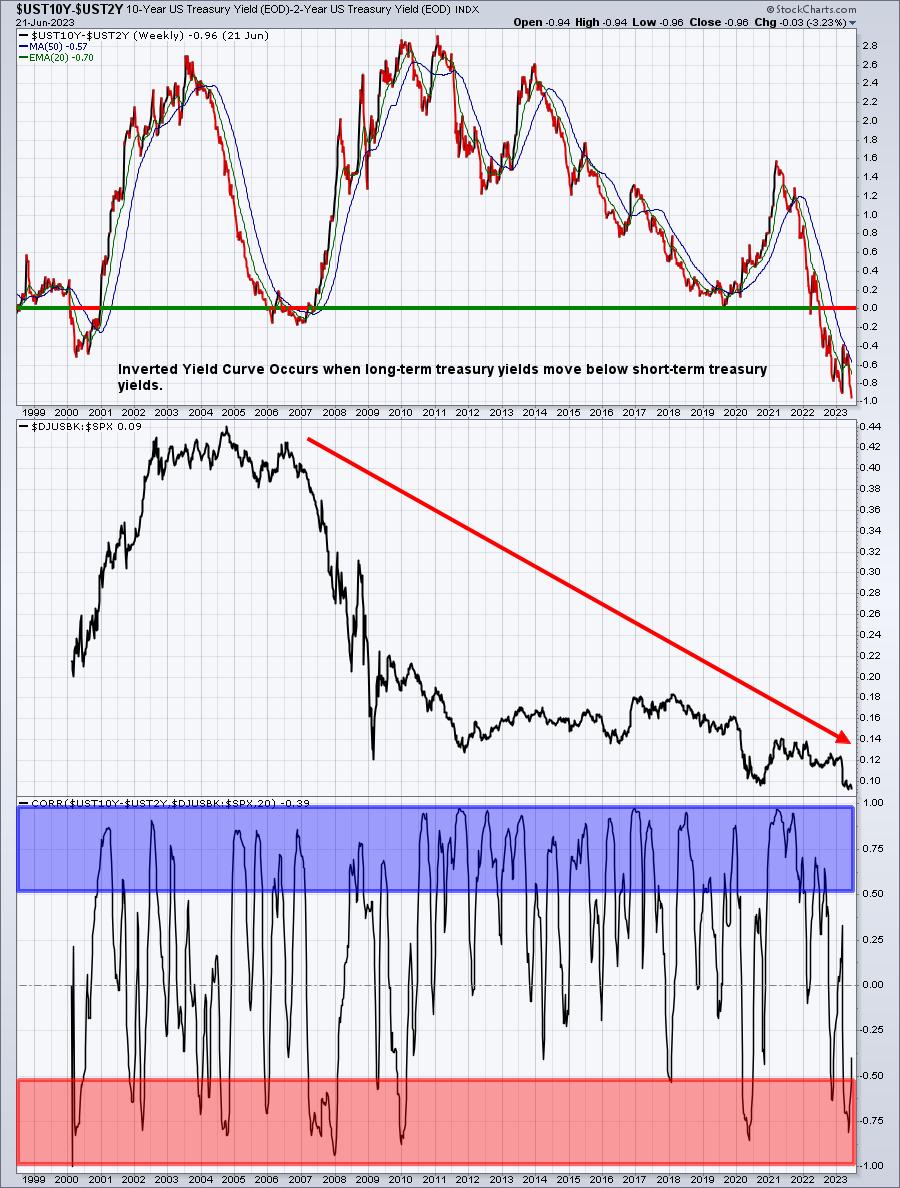
Correlation isn't perfect, but it's more positively correlated than inversely correlated. This suggests that a falling yield curve spells trouble for banks, but not necessarily the overall market.
Prediction: Balance of 2023
At the beginning of each calendar year, during our annual MarketVision event, I provide my forecast of the S&P 500 and even lay out how I expect it to unfold. Here's the chart I laid out at MarketVision 2023 in early January and where we currently stand:
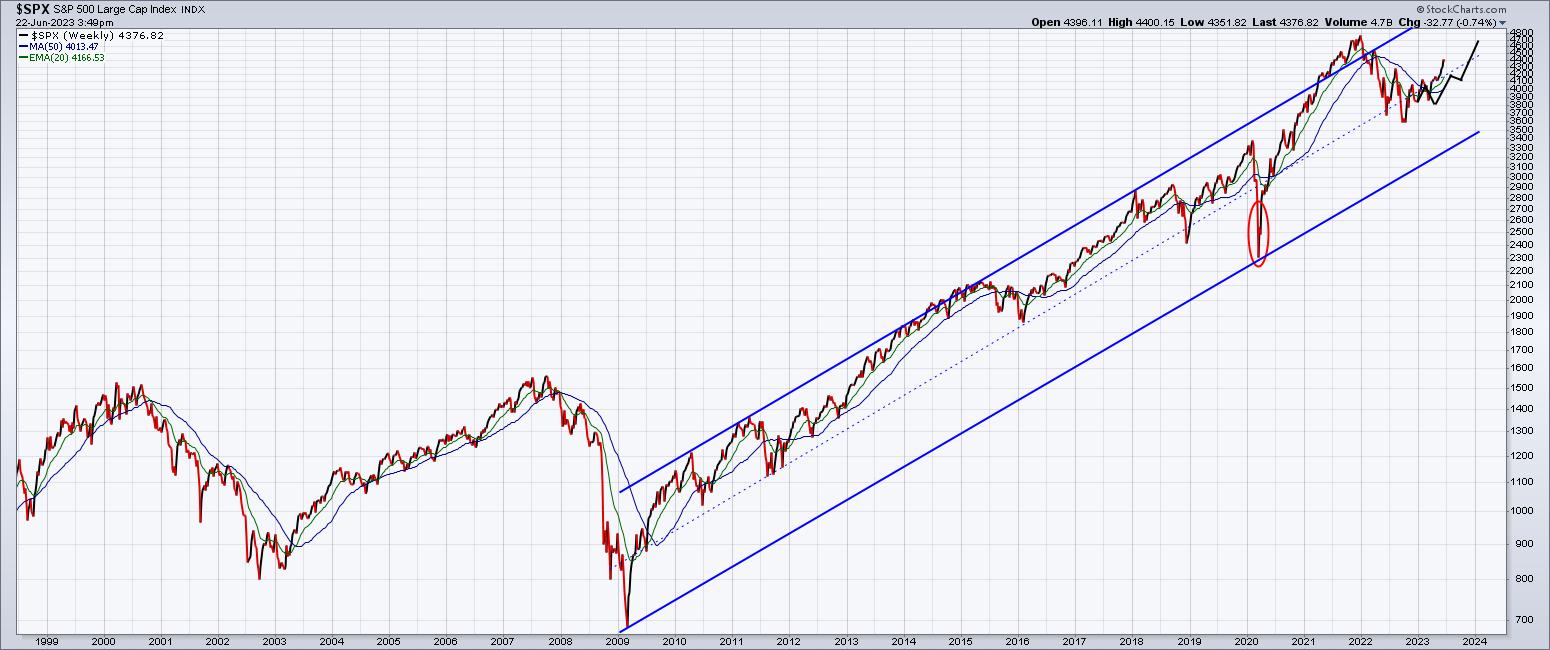
The black line highlights how I expected the S&P 500 to behave this year. Not too bad, huh? I take into account technical considerations, tons of research, historical data, and a hefty dose of perspective. The actual S&P 500 performance has been even stronger than what I anticipated, which is why I now believe we'll see all-time highs on the S&P 500 by year end.
This State of the Market didn't cover everything, but hopefully it's provided you solid information to use (and to watch) as the balance of the year unfolds.
Happy trading!