
EB Daily Market Report - Tuesday, June 27, 2023
Bulls-Eye Forecast: Mid-Year Update
We will be hosting our mid-year update event on Tuesday, July 6th at 7:00pm ET. EB members will automatically be registered a couple days before the event, but it's fine if you sign up first. Either way, we'll make sure all of our members have full access to the live event and also the recording, which will be time-stamped for your convenience.
Executive Market Summary
- Futures were bifurcated overnight with Dow futures lagging, while the others were higher
- We've seen mostly buying thus far today with leadership in transports ($TRAN, +2.55%) as the group rapidly closes in on its early-February high
- Aggressive sectors are seeing relative strength as communication services (XLC, +1.61%) and consumer discretionary (XLY, +1.56%) lead the action
- A bounce in semiconductors ($DJUSSC, +2.12%) is providing technology (XLK, +1.39%) a lift as well
- Crude oil ($WTIC, -1.95%) prices have dropped back to $68 per barrel, holding back energy (XLE, -0.05%)
- Airlines ($DJUSAR, +5.14%) are "flying" today as many component stocks attempt breakouts like American Airlines (AAL, +5.87%)
- FedEx (FDX, +4.83%) is soaring, hitting fresh 52-week highs to help lift the delivery services index ($DJUSAF, +2.21%)
Market Outlook
Today's strength in U.S. equities is coming just as a couple of our key indices test or approach rising 20-day EMAs. A perfect example is the S&P 500, which is bouncing beautifully after days of weakness:
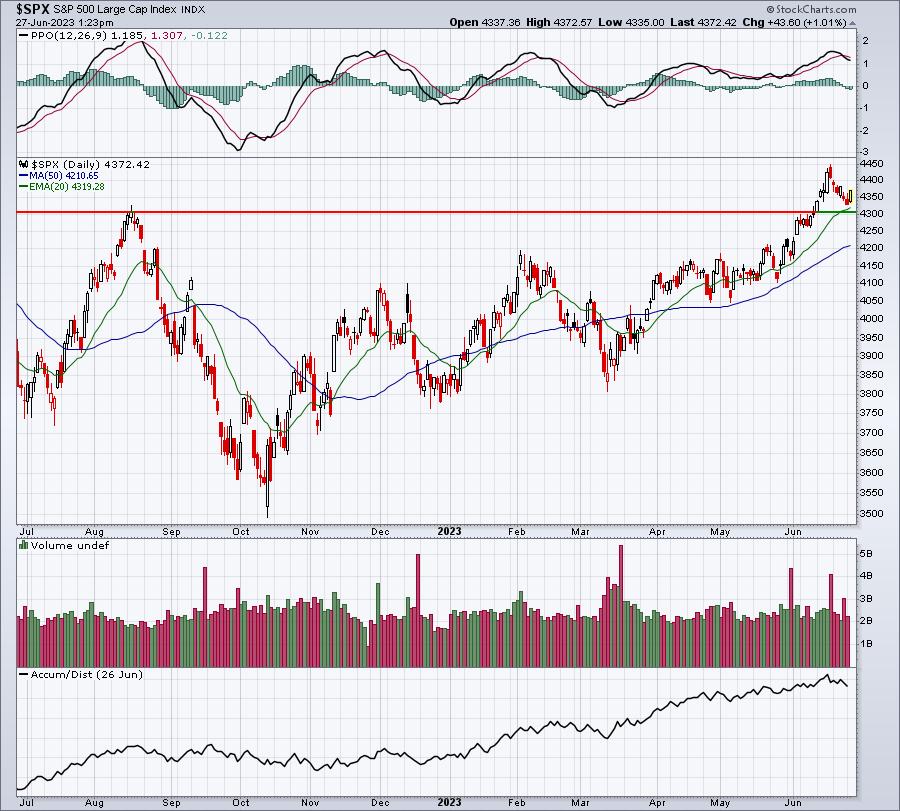
We certainly could see another pullback to test that 20-day EMA, but today's reversal has cleared yesterday's high. We previously had 5 consecutive days of lower highs. Today's action breaks that streak and provides more ammunition for bulls to carry prices higher, which is the higher likelihood, in my opinion.
Sector/Industry Focus
I wrote about the transportation stocks ($TRAN) in Part 2 of the State of the Market DMRs from last week. This group has an absolutely amazing track record in terms of predicting S&P 500 strength. When this group breaks downtrends or clears key price resistance, it normally results in a fiery uptrend, lifting the S&P 500 in the process. First, let's look at the chart I provided last week:
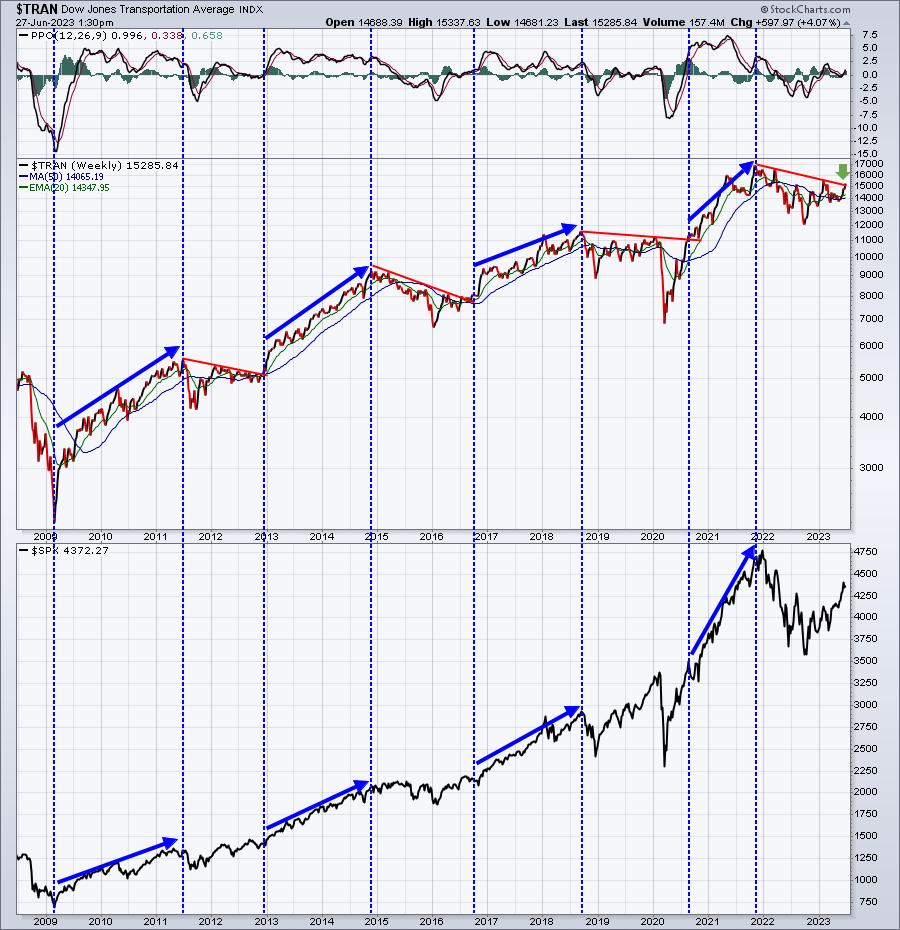
Trendlines are subjective as different folks might draw the lines slightly differently. However, if we see much more strength from this group, it'll be clear to all that a breakout is underway. Here's a shorter-term 1-year chart of the TRAN that might help visualization a bit:
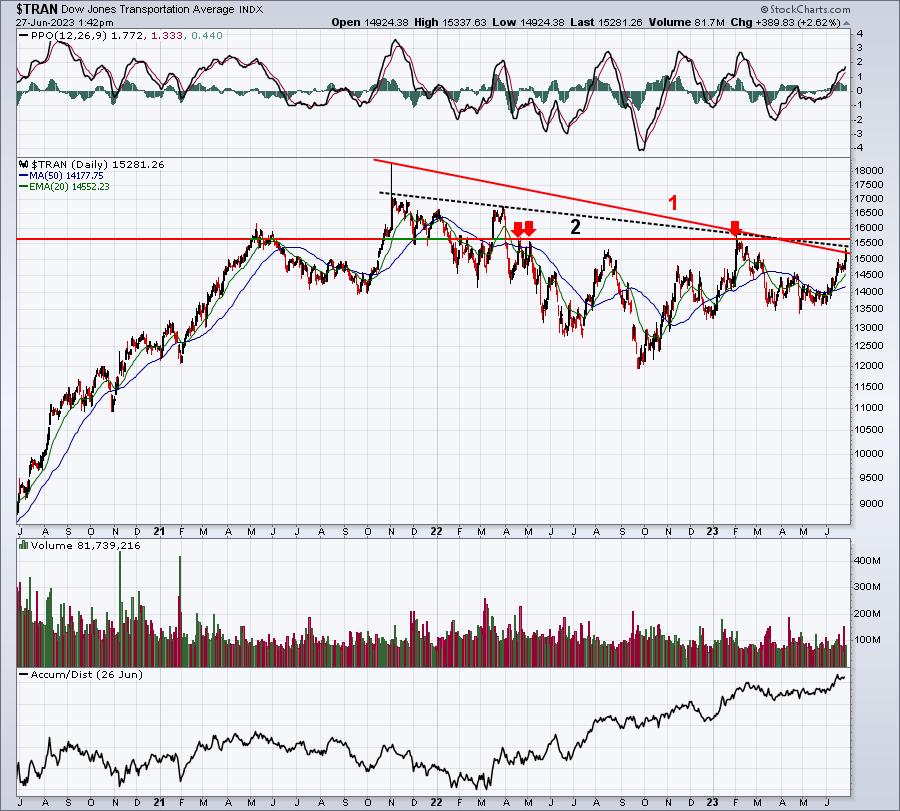
Resistance line #1 (in red) represents the trendline if we connect the intraday highs. Resistance dotted line #2 (in black) represents the trendline if we connect the closing prices. You can see that the breakout changes depending on which line you choose. So I like to see a breakout that leaves no question marks. In the case of TRAN, I believe that level is 15500. But just above that level is MAJOR price resistance from several failed attempt to clear 15600 on the close. Therefore, I'd go up to that 15600 level. If we close above 15600, I believe that is THE confirming signal that the S&P 500 is prepared to make a very meaningful advance during the balance of 2023.
Also, check out that AD line. It appears rather obvious to me that Wall Street is prepping for a much bigger advance in transports in the weeks and months ahead.
ChartLists/Strategies
The reversal in the S&P 500 tells me one thing that I absolutely want to do - run our Downtrend Reversal scan today and over the next couple days to spot strong stocks that are also beginning to reverse. When I ran this scan against all of our ChartLists, 44 stocks were returned, with SCTRs ranging from 11 (NVAX) to 97 (U). Some may favor stocks with lower SCTRs, suggesting these stocks could be very oversold in addition to showing signs of reversing. Others might want to stick with only those stocks showing excellent relative strength. It comes down to preference. I looked at all 44 stocks and thought the following looked very interesting for continuing strength in the days and weeks ahead:
- ALTR
- ANSS
- BRZE
- CNMD
- JNPR
- KBR
- OTEX
- RRR
- SBUX
- TCOM
Earnings Reports
Here are the key earnings reports for the next two days, featuring stocks with market caps of more than $10 billion. I also include notable companies with market caps below $10 billion. Finally, any portfolio stocks that will be reporting results are highlighted in BOLD. If you decide to hold a stock into earnings, please understand the significant short-term risk that you are taking. Please be sure to check for earnings dates for any companies that you own or are considering owning.
Tuesday, June 27:
WBA, SNX, KFY, SCHN
Wednesday, June 28:
MU, GIS, CNXC, FUL, WOR, BB
Economic Reports
May durable goods: +1.7% (actual) vs. +1.2% (estimate)
May durable goods ex-transports: +0.7% (actual) vs. +0.6% (estimate)
April Case-Shiller home price index: +0.9% (actual) vs. +0.5% (estimate)
April FHFA house price index: +0.7% (actual) vs. +0.4% (estimate)
June consumer confidence: 109.7 (actual) vs. 103.7 (estimate)
May new home sales: 763,000 (actual) vs. 667,000 (estimate)
Happy trading!
Tom