
EB Daily Market Report - Wednesday, June 28, 2023
Bulls-Eye Forecast: Mid-Year Update - Correction
We will be hosting our mid-year update event on Thursday, July 6th at 7:00pm ET. In yesterday's DMR, I incorrectly indicated that it would be held on Tuesday, July 6th, which obviously was a mistake. EB members will automatically be registered a couple days before the event, but it's fine if you sign up first. Either way, we'll make sure all of our members have full access to the live event and also the recording, which will be time-stamped for your convenience.
Executive Market Summary
- Futures were lower overnight, but buying began just after the opening bell
- The NASDAQ and small caps are showing relative strength today - especially the small caps after a rough start this morning
- Cryptocurrencies are mostly lower on the session, with litecoin ($LTCUSD, -6.12%) losing substantially on an absolute and relative basis
- Commodities remain mostly weak, although crude oil ($WTIC, +2.41%) is rebounding; accordingly, energy (XLE, +0.95%) is today's top-performing sector
- Semiconductors ($DJUSSC, -1.11%) gapped lower after a Wall Street Journal report suggested that the U.S. is considering new AI chip export restrictions with China
- Utilities (XLU, -1.62%), a defensive sector, is the primary sector laggard on the session
- Cruise lines are flying again as Carnival Group (CCL, +8.56%) leads the entire group higher and leads the S&P 500 leaderboard
Market Outlook
I update a few proprietary intraday ratio charts periodically, usually at least once per week, so that I can visualize the intraday happenings to evaluate the sustainability of the stock market's advance or decline. In other words, is Wall Street's "during the day" rotation suggesting that our indices are likely to continue pushing higher. The two primary ratio charts that I follow are as follows:
- QQQ:SPY (growth vs. value)
- XLY:XLP (aggressive vs. defensive)
Here they are:
QQQ:SPY
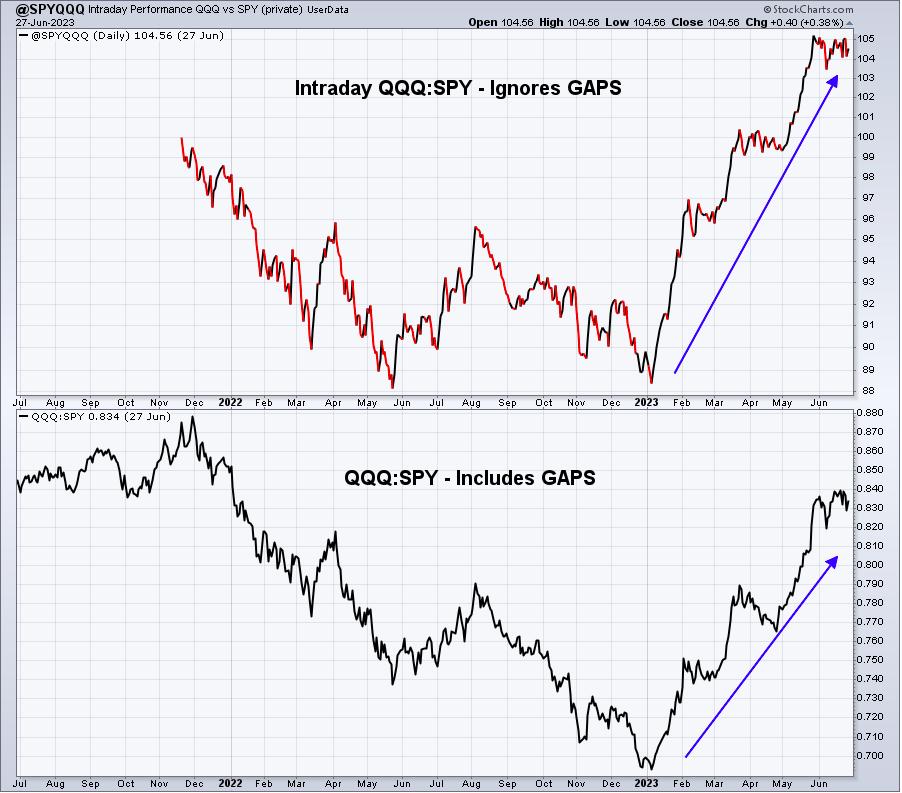
The top panel summarizes the relative price action on an INTRADAY basis (ignoring gaps) based solely on the User-Defined Index that I've created at StockCharts.com. If you notice, the bottom QQQ:SPY panel easily set new relative lows in January, but in the top panel, the QQQ:SPY that ignored gaps did not. That tells me that market makers were manipulating prices lower throughout the second half of 2022 on the more aggressive QQQ. We've seen what's happened since then - a massive rally off the October low on the S&P 500 and an even-more exhilarating rally on the QQQ year-to-date 2023. The current chart shows the QQQ:SPY ratios screaming higher, easily supporting the notion that the stock market is heading higher.
XLY:XLP
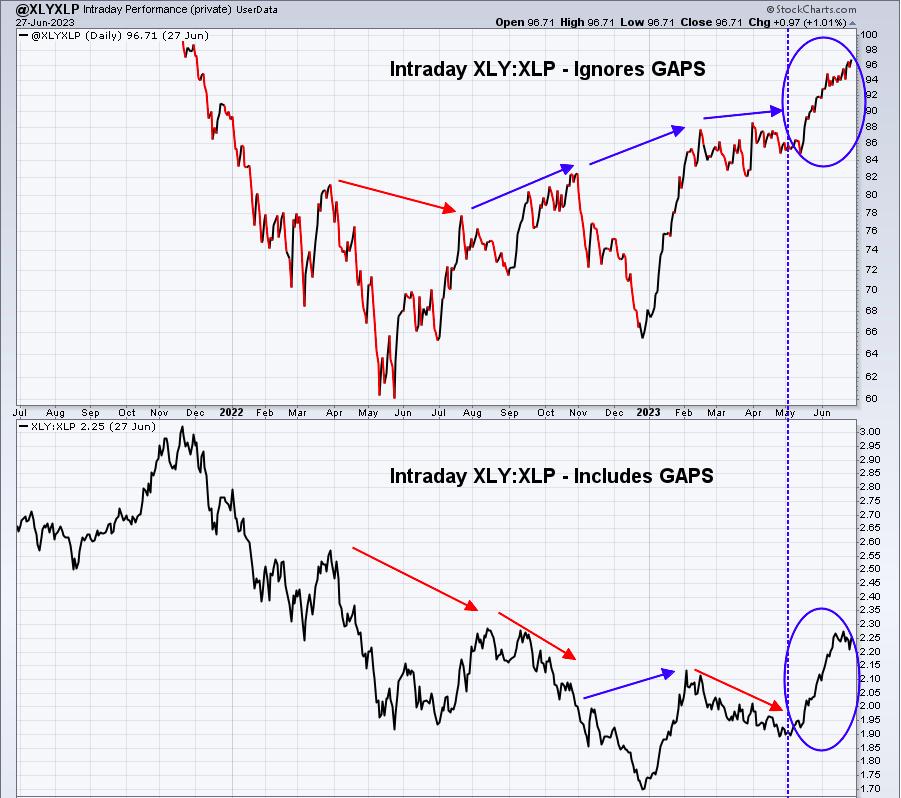
Again, I want you to check out those lows in May 2022 and late-December 2023. If we include gaps, new lows were triggered. If we ignore gaps, we see a completely different story (top panel). The rotation from staples to discretionary began from that May 2022 low during the trading day. But market makers "hid" most of that bullish rotation until May 2022. That's the ridiculous manipulation that I've spoken about often.
Sector/Industry Focus
I've received multiple questions recently about biotechs ($DJUSBT) and their poor performance. So I thought I'd show you a current chart of the DJUSBT and a couple of ETFs that track biotechs, IBB and XBI. The IBB is more concentrated in a few biotech names, as VRTX, GILD, AMGN, and REGN make up roughly one-third of the entire ETF. The XBI, on the other hand, is much more diversified with only IMGN currently representing more than 2% of the ETF. Here's how all three look at the moment:
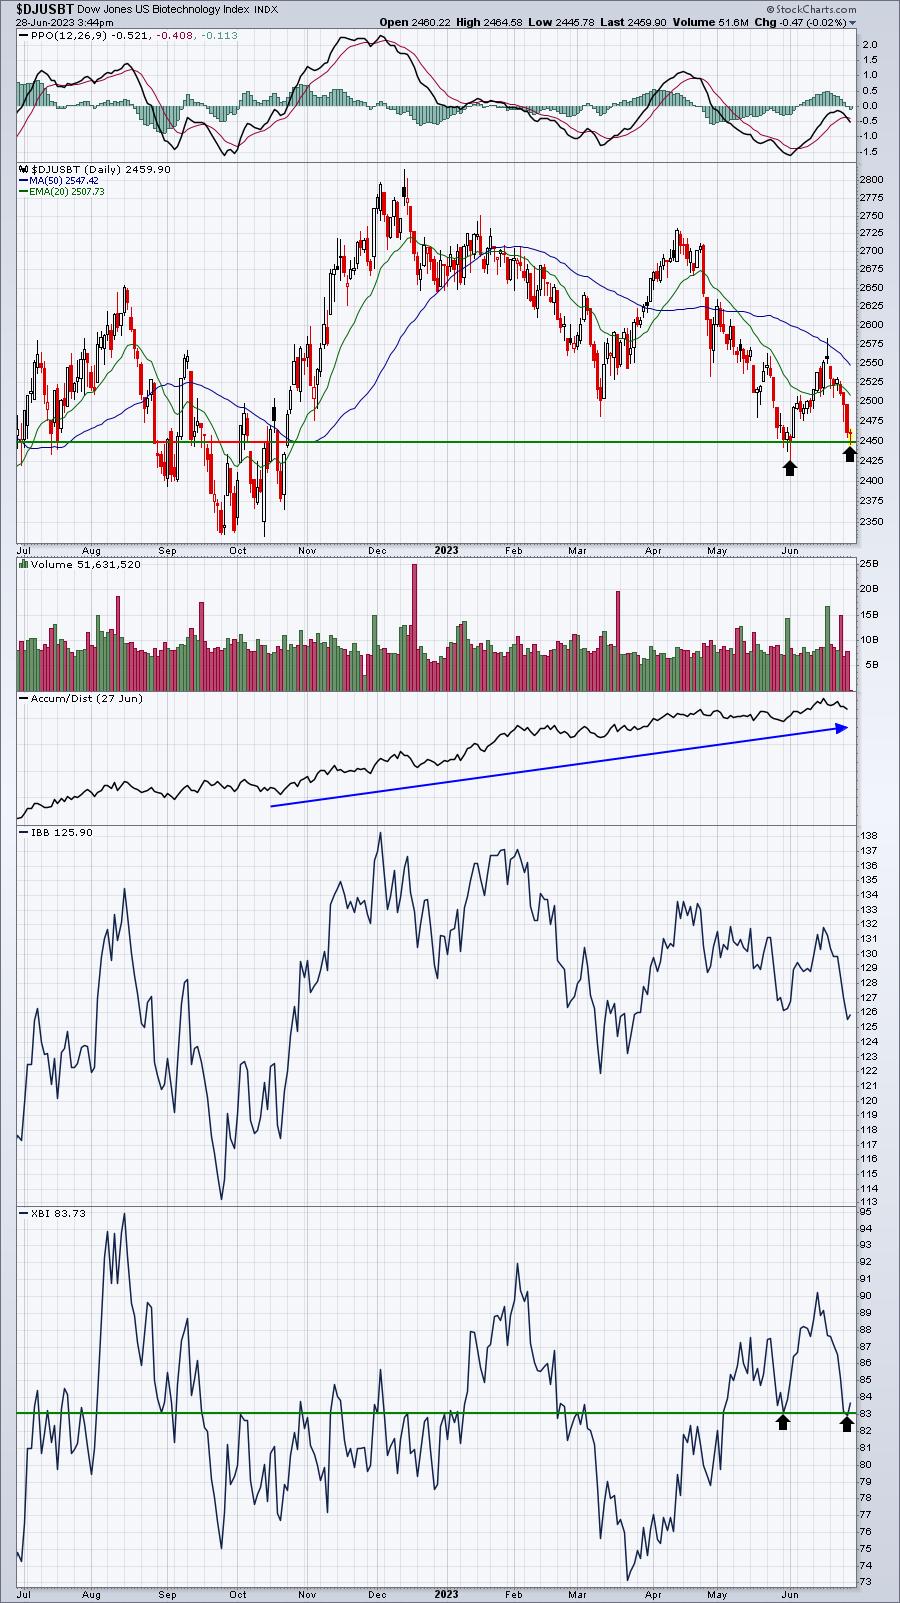
The DJUSBT has potentially formed a double bottom that will not confirm as a bottom until the high in between is cleared. That level is close to 2575. Meanwhile, if I'm looking at the two biotech ETFs, I prefer the XBI at this point, because I can keep a very tight stop just below 83 and minimize my losses if biotechs turn lower again. I do like today's test on the DJUSBT at 2450 and the reversal. We could see a run in this group at any time. From a seasonality perspective, July has been the best month for biotechs over the last 20 years. So perhaps both seasonality and the double bottom are pointing to a near-term rebound in this group.
ChartLists/Strategies
I once again ran our Downtrend Reversal scan, looking for additional trading candidates that are also showing possible reversing tendencies. There were 30 stocks that are potentially reversing their recent downtrends. Here are the stocks that I like best from this list:
- AGYS
- AI (very high risk)
- DXCM
- FICO
- MAXN
- NTCT
- ORCL
- PLUG
- PRG
- SQSP
- TEAM
- TNET
- YMAB
Earnings Reports
Here are the key earnings reports for the next two days, featuring stocks with market caps of more than $10 billion. I also include notable companies with market caps below $10 billion. Finally, any portfolio stocks that will be reporting results are highlighted in BOLD. If you decide to hold a stock into earnings, please understand the significant short-term risk that you are taking. Please be sure to check for earnings dates for any companies that you own or are considering owning.
Wednesday, June 28:
MU, GIS, CNXC, FUL, WOR, BB
Thursday, June 29:
NKE, PAYX, MKC, MSM, AYI, SMPL, PRGS, LNN, SGH, ACCD
Economic Reports
None
Happy trading!
Tom