
EB Daily Market Report - Thursday, June 29, 2023
Bulls-Eye Forecast: Mid-Year Update
We will be hosting our mid-year update event on Thursday, July 6th at 7:00pm ET. EB members will automatically be registered a couple days before the event, but it's fine if you sign up first. Either way, we'll make sure all of our members have full access to the live event and also the recording, which will be time-stamped for your convenience.
Executive Market Summary
- Futures were mixed overnight and we're seeing bifurcated action as the NASDAQ trails and is in red territory
- Small caps are leading today's advance, followed by mid caps and the Dow Jones
- The 10-year treasury yield ($TNX) is up 14 basis points to 3.85%, its highest level since early March
- Q1 GDP (final estimate) came in much higher than expected, 2.0% vs. 1.4%
- The aggressive sectors - XLC, XLK, XLY - are all lower today, while financials (XLF, +1.55%) and materials (XLB, +1.05%) lead the market higher, especially those small caps
- Banks ($DJUSBK, +2.50%) are leading financials higher, though all 12 industry groups within the sector are up
- Crude oil ($WTIC, +0.09%) is slightly higher on the session, but most other commodities are weak
- Goldman Sachs (GS, +3.61%) and JP Morgan Chase (JPM, +3.26%) are helping to push the Dow Jones higher
Market Outlook
Small caps (IWM) are having a very solid day, outperforming the other asset classes, continuing its recent bullish streak. The following is a chart that compares the 5-day performance of the IWM vs. the QQQ:
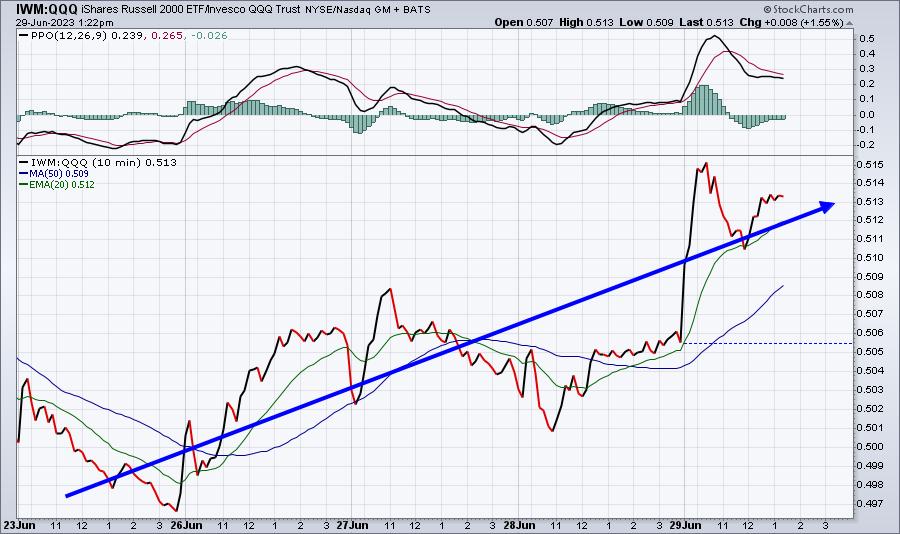
Right now, this is nothing more than a short-term bounce in the IWM:QQQ ratio and I wouldn't consider it as anything more. Now let me show you this same ratio since the beginning of 2023:
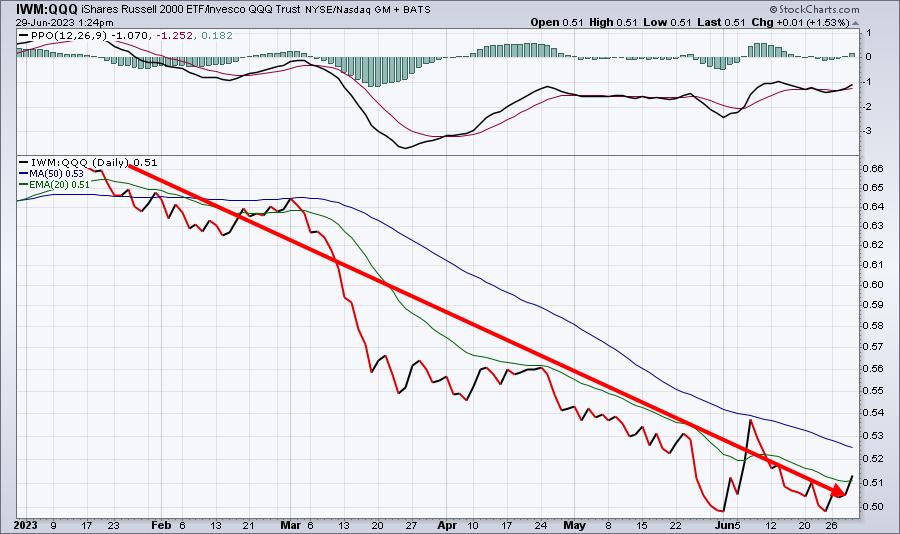
The year-to-date relative performance tells us something much different. If this ratio can break above .54, then perhaps we'll see extended relative strength by small caps. For now, however, I'd assume the strength will return to the QQQ.
I sold roughly 20% of my TNA (leveraged bullish ETF that tracks the IWM at a 3 to 1 clip) near 35 and reinvested most of it in the IWM. My plan is to continue selling chunks of the TNA as it moves to the 36 level. I'll likely hold half to see if we can make the breakout on the IWM around the 189 level.
The balance of the TNA proceeds was invested in the 3x leveraged biotech bull ETF, LABU. It's a fairly small position, but I'm exiting a leveraged ETF as its underlying index approaches key resistance and entering a leveraged ETF as its underlying index is testing key support. The strong upcoming seasonal period in biotechs (see below) is influencing this decision as well.
Sector/Industry Focus
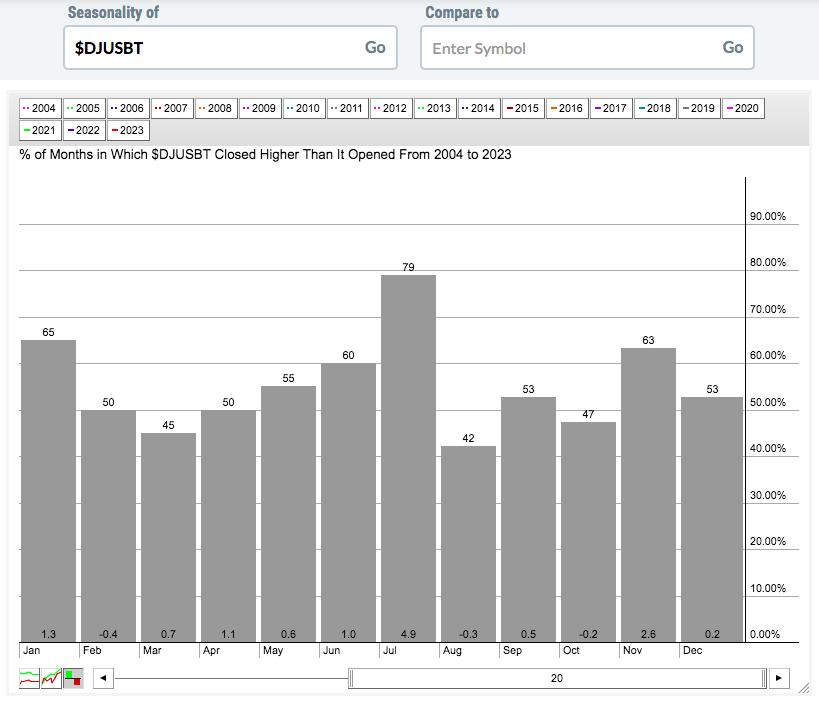
I discussed the biotech group ($DJUSBT) yesterday and mentioned the strong seasonal period ahead, as biotechs LOVE the month of July. Below is a seasonality chart that highlights this obvious strength:
And if we only look at the current secular bull market (since 2013), the odds of July gains move even higher. Check this out:
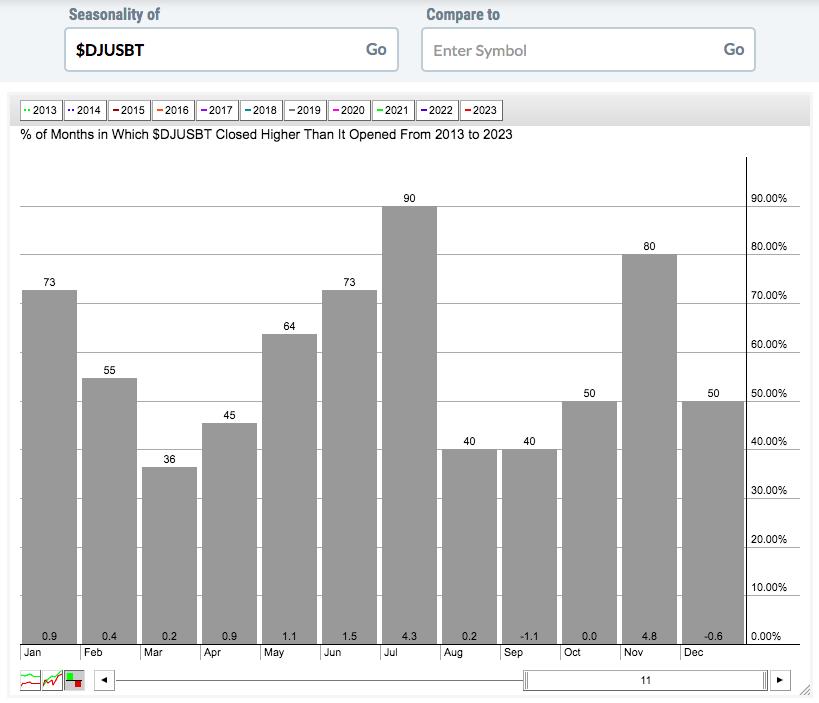
Biotechs have risen 9 out of the last 10 Julys. The average gain has been 4.3%. I don't know if July 2023 will be bullish or not, but history tells me that I should expect it. Combining that historical knowledge with the current test of price support makes this group rather intriguing right now.
ChartLists/Strategies
Let's roll the Downtrend Reversal scan one more day. Over the past two days, this scan has provided several exceptional trading candidates. Here are a few examples:
- AGYS (+4.00% today)
- PLUG (+5.35% today)
- BRZE (+5.33% yesterday)
So let's take another look at the results from this scan and see if we can find other winners. There were 25 more stocks returned today that broke recent downtrends (daily high lower for at least 5 consecutive days, but showing a higher daily high today):
- GPN (possible reversal off multi-month price support)
- HLIT (bouncing off price support and 50-day SMA)
- PYPL (has it finally reached bottom? I'd exit on any close beneath 65.00)
- QDEL (bouncing off multi-month price support)
- XYL (reversal off price support and 20-day EMA)
- YEXT (finally reversing after 8 consecutive days of lower daily highs, like it from current price down to gap support at 9.60)
Earnings Reports
Here are the key earnings reports for the next two days, featuring stocks with market caps of more than $10 billion. I also include notable companies with market caps below $10 billion. Finally, any portfolio stocks that will be reporting results are highlighted in BOLD. If you decide to hold a stock into earnings, please understand the significant short-term risk that you are taking. Please be sure to check for earnings dates for any companies that you own or are considering owning.
Thursday, June 29:
NKE, PAYX, MKC, MSM, AYI, SMPL, PRGS, LNN, SGH, ACCD
Friday, June 30:
STZ
Economic Reports
Q1 GDP (final estimate): 2.0% (actual) vs. 1.4% (estimate)
Initial jobless claims: 239,000 (actual) vs. 265,000 (estimate)
May pending home sales: -2.7% (actual) vs. -0.6% (estimate)
Happy trading!
Tom