
EB Daily Market Report - Monday, July 3, 2023
Early Close for Stocks
The New York Stock Exchange (NYSE) closed early today at 1pm ET in observance of the July 4th holiday, which will be officially observed tomorrow. There will be no Daily Market Report or Trading Places Live show on Tuesday. Our schedule will be back to normal on Wednesday.
Bulls-Eye Forecast: Mid-Year Update
We will be hosting our mid-year update event on Thursday, July 6th at 7:00pm ET. EB members will automatically be registered a couple days before the event, but it's fine if you sign up first. Either way, we'll make sure all of our members have full access to the live event and also the recording, which will be time-stamped for your convenience.
Executive Market Summary
- Futures were bifurcated overnight and right up until the opening bell; the QQQ opened higher, but it was a bit more challenging for both the DIA (Dow Jones) and SPY (S&P 500)
- We ended the holiday-abbreviated trading gains with gains across our major indices
- 9 of 11 sectors were positive on the session, with only health care (XLV, -0.82%) and technology (XLK, -0.21%) not participating
- After busting through a $3 trillion market cap on Friday, Apple (AAPL, -0.78%) saw some profit taking, leading to losses in computer hardware ($DJUSCR, -0.73%)
- Cryptos saw more buyers as ethereum ($ETHUSD, +3.01%) led the way; bitcoin ($BTCUSD, +2.47%) managed to move above 31000 for the first time in well over a year
- Commodities were mixed as crude oil ($WTIC, -0.84%) finished the week almost squarely on $70 per barrel
- The 10-year treasury yield ($TNX) jumped 4 basis points to close at 3.86%, the highest TNX close since March 9th
- Tesla (TSLA, +6.90%) was today's best-performing stock on the S&P 500 after reporting better-than-expected production and deliveries for Q2
Market Outlook
I fully expect prices to continue pushing higher during the second half of 2023. I do expect periods of selling and consolidation, but the primary direction, in my opinion, will be higher. In order to get there, however, we'll need to see more and more groups clear overhead price resistance. The S&P 600 Small Cap Index ($SML) is a perfect example. It's bumping up against short-term price resistance. Check this out:
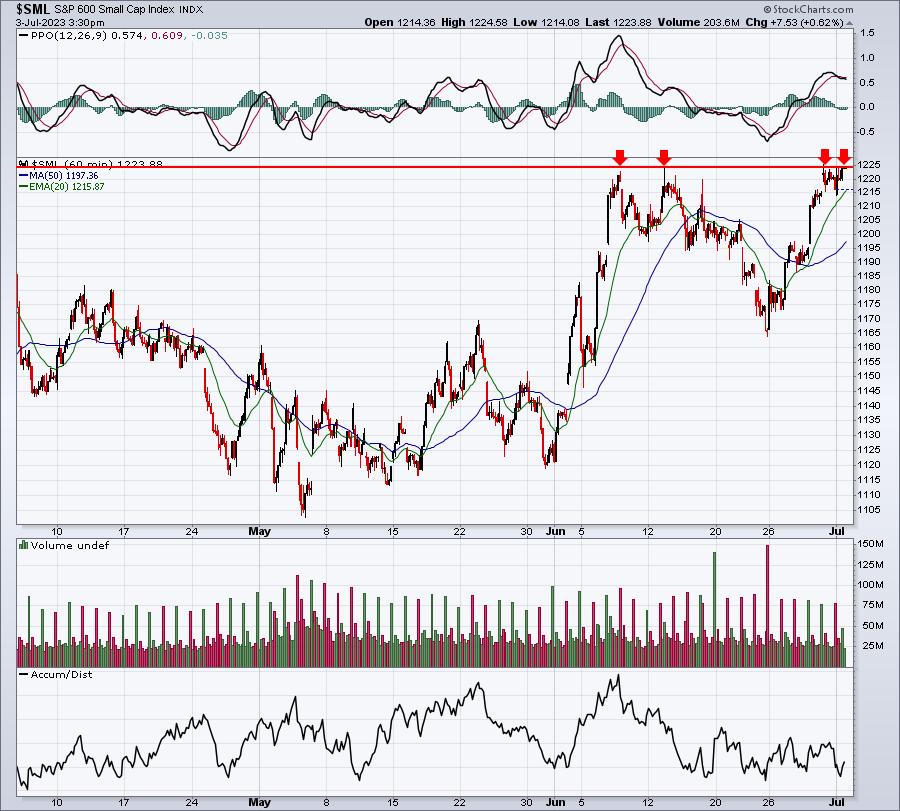
If we see a breakout above 1225 here, we should be prepared for a possible "melt up". Listen, no one thought we'd see a melt up in the FAANG stocks and NASDAQ 100 at the beginning of the year, yet we've seen one. More recently, who was calling for a breakout in transportation stocks and very quick upside (besides EB)? Well, now I'm telling you that small caps could be poised for much more upside. We need to respect the current price resistance that we're testing, but if that goes? I see some form of a "melt up", if the resistance dam breaks.
Sector/Industry Focus
First, a quick update on energy (XLE), which is at a very critical juncture technically:
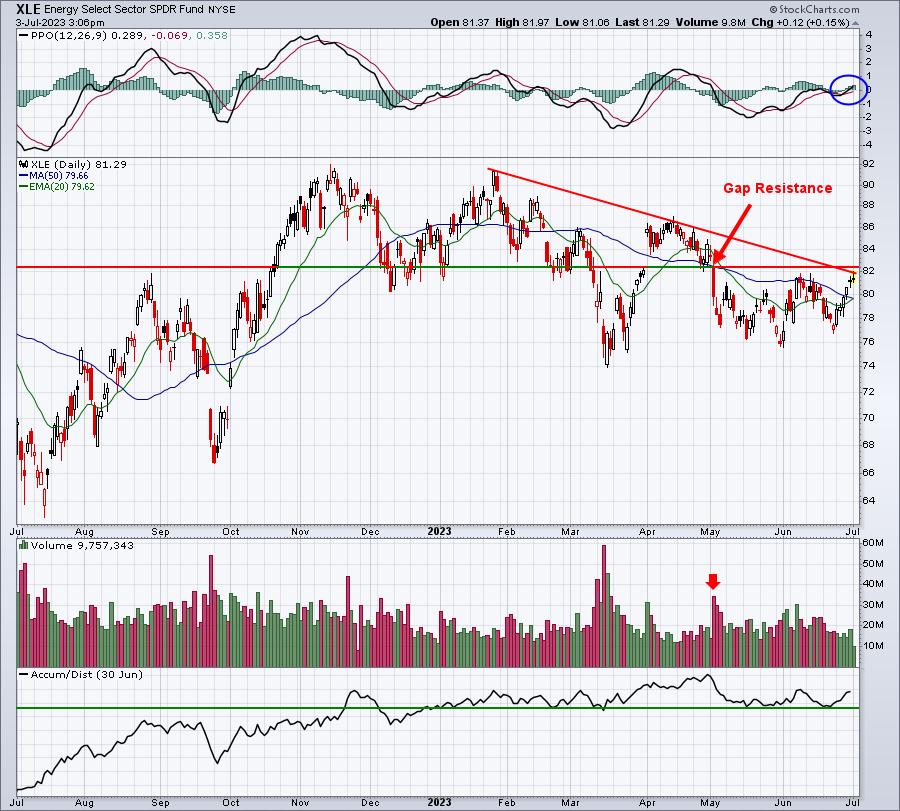
This is the same chart I showed late last week, but we've now inched even closer to a possible breakout. I'll be watching the XLE and its various industry groups on Wednesday and throughout the balance of the week.
Next, let's check out consumer discretionary (XLY), which has finally reached its August 2022 high. Today's candle isn't exactly bullish, so if we can't see some follow through on Wednesday, the XLY could find itself trapped beneath key price resistance for awhile longer:
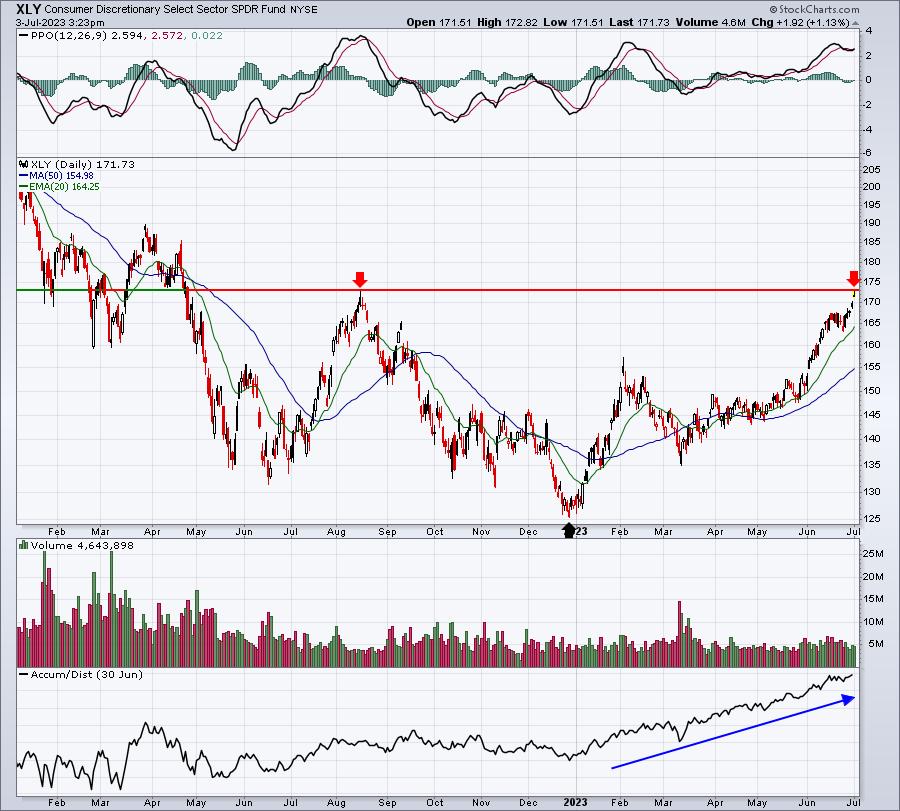
This is a classic double bottom pattern. The black arrow shows you where support broke and we printed (potentially) a final bottom. Most downtrends consist of lower highs and lower lows, so because we saw this rally carry us all the way back to that August 2022 high, it possesses more bullish characteristics. I'd now watch the rising 20-day EMA as key short-term support, while a closing breakout above 173 would provide a very bullish signal.
ChartLists/Strategies
Today I ran a scan of Strong AD ChartList (SADCL) stocks that were testing their 20-day EMAs. The 20-day EMA had to be above the 50-day SMA and both the open and the current price today had to be above the 20-day EMA, while today's low was beneath the 20-day. This filter ensures that we potentially saw a false breakdown intraday beneath the 20-day EMA and a recovery into today's early close at 1pm ET. Here were the 14 stocks returned:
- ANSS
- APPN
- BRBR
- CDAY
- CXM
- EPAC
- EPM
- LW
- SAP
- SGML
- SNOW
- SNPS
- YEXT
- ZUO
Here are my thoughts on my 5 favorites on this list - CXM, EPAC, SGML, SNPS, ZUO.
Of these, I like CXM, which has been trending higher since late 2022. It recently tested price support in the 13.25-13.50 area and has bounced to clear its 20-day EMA, increasing the likelihood that another uptrend has begun. EPAC showed excellent relative strength until its top in early March. It's lost relative strength while it's consolidated, but a breakout could be accompanied by renewed relative strength. Therefore, keep a close eye on 28.46 closing price resistance. SGML is similar to EPAC as its relative strength slowed while it consolidated. A close above 42.40 would be a potential trigger to higher prices here. I loved the late-May surge in SNPS and fully expect to see another. In the meantime, the best entry would be gap support at 410.03. Unfortunately, I don't think it'll get back down there before its next breakout. ZUO is aggressive, but the heavy-volume breakout in late May likely leads to further upside, in my opinion.
Earnings Reports
Here are the key earnings reports for the next two days, featuring stocks with market caps of more than $10 billion. I also include notable companies with market caps below $10 billion. Finally, any portfolio stocks that will be reporting results are highlighted in BOLD. If you decide to hold a stock into earnings, please understand the significant short-term risk that you are taking. Please be sure to check for earnings dates for any companies that you own or are considering owning.
Monday, July 3:
None
Tuesday, July 4:
None - Market closed
Wednesday, July 5:
None
Economic Reports
June PMI manufacturing index: 46.3 (actual) vs. 46.3 (estimate)
June ISM manufacturing index: 46.0 (actual) vs. 47.3 (estimate)
May construction spending: +0.9% (actual) vs. +0.5% (estimate)
Happy trading!
Tom