
EB Daily Market Report - Wednesday, July 5, 2023
Bulls-Eye Forecast: Mid-Year Update
Please NOTE: We are registering ALL EB.com members TODAY for tomorrow evening's "Bulls-Eye Forecast" event.
If you cannot attend live, no worries. We'll make sure all of our members have full access to the live event and also the recording, which will be time-stamped for your convenience.
Executive Market Summary
- Futures were weak overnight, but our major indices have improved off of a poor start to trading this morning
- Commodities are mixed, though crude oil ($WTIC, +3.07%) has jumped back to $72 per barrel
- Despite the strong jump in crude, energy (XLE, -0.86%) continues to struggle at 82.00 price resistance
- Gold (GLD, -0.33%) started the day strong, gapping higher to test its 20-day EMA, but it's been a failed test thus far
- The 10-year treasury yield ($TNX) is up 9 basis points to 3.94%, its highest level since the second week of March
- Utilities (XLU, +1.81%) and communication services (XLC, +1.01%) are the two strongest sectors on the session
- Materials (XLB, -2.43%) is badly lagging the other sectors today, though only 3 sectors are higher
- Meta Platforms (META, +3.45%) is among the S&P 500's top performers
Market Outlook
Here's a quick intraday look at the S&P 500 on a 5-day 10-minute chart. I was interested to see if we'd see any kind of significant push higher or lower after the FOMC minutes were released. Thus far, that question has been answered as we've seen little post-release volatility:
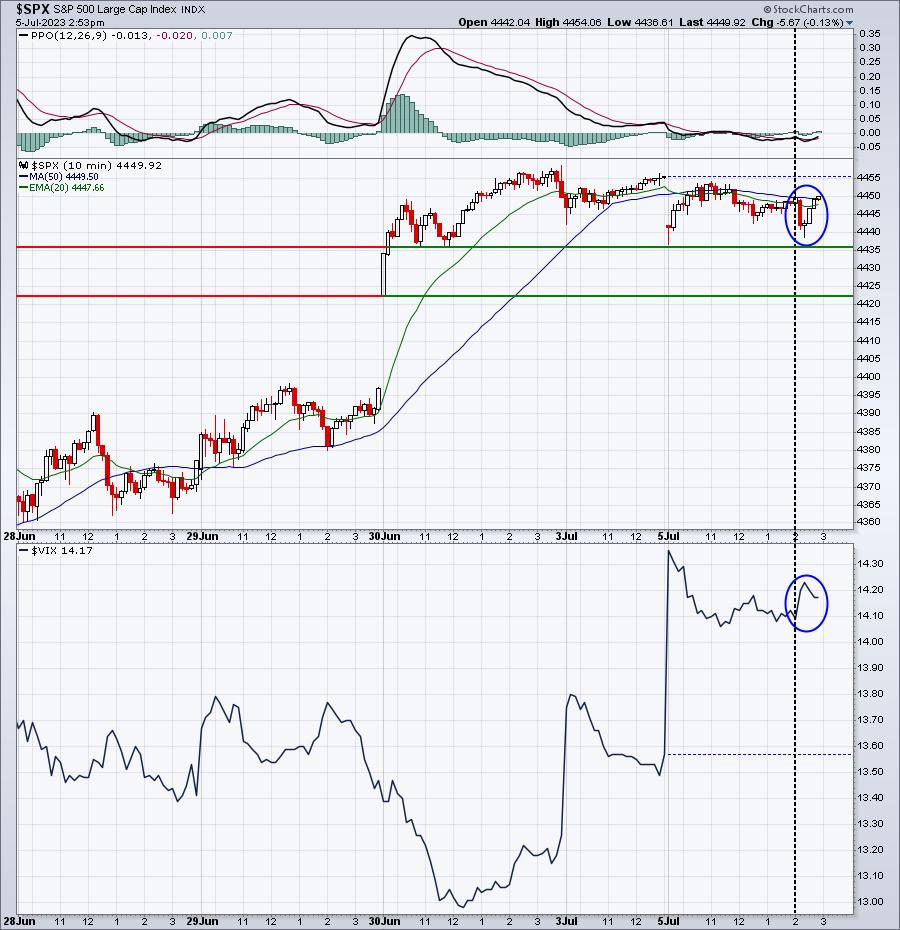
We saw a quick drop after 2pm, but the S&P 500 quickly reversed after nearing short-term price support close to 4436. If that level falls, look for gap support closer to 4423.
Sector/Industry Focus
Financials (XLF) have made a recent, short-term breakout, which is another bullish signal. We want to see wider participation in any advance and we've begun to see that. Recently, the XLI broke out. We've also seen the XLB and XLRE break out. The XLF has followed suit, as you can see below:
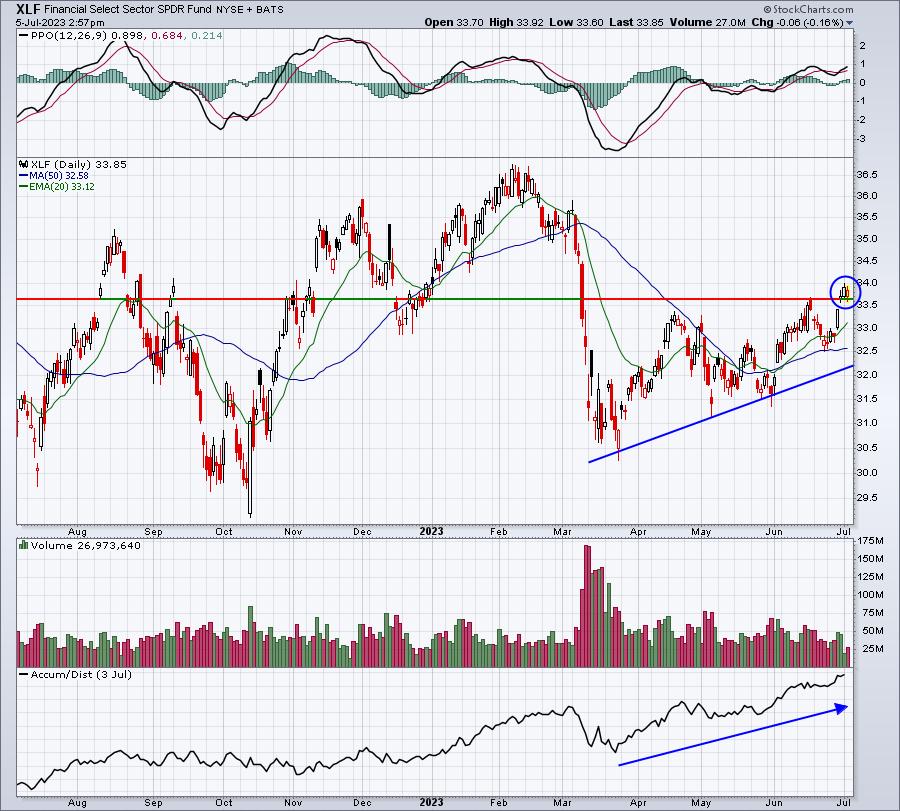
There was a lot of negativity surrounding many areas within financials over the past few months, especially banks ($DJUSBK), but check out that rising AD line after the initial panicked selloff. I'm now watching the rising 20-day EMA for support. So long as that holds, I expect that the XLF is heading higher. If I'm right, it's only a matter of time before small caps (IWM) join the "melt up" party.
ChartLists/Strategies
I don't have any trade strategies to discuss today as I wanted to see if we had any reaction to the FOMC minutes, which were released just a little bit ago at 2:00pm ET.
I will just provide a quick chart of Zuora (ZUO), which is a stock that I entered today at gap support at 10.00. If had fallen below 10.00 and I waited until it returned to 10.00, potentially leaving a long tail to the downside before a possible reversal to new highs. I'm planning to keep a very tight stop in the event ZUO closes below 10.00:
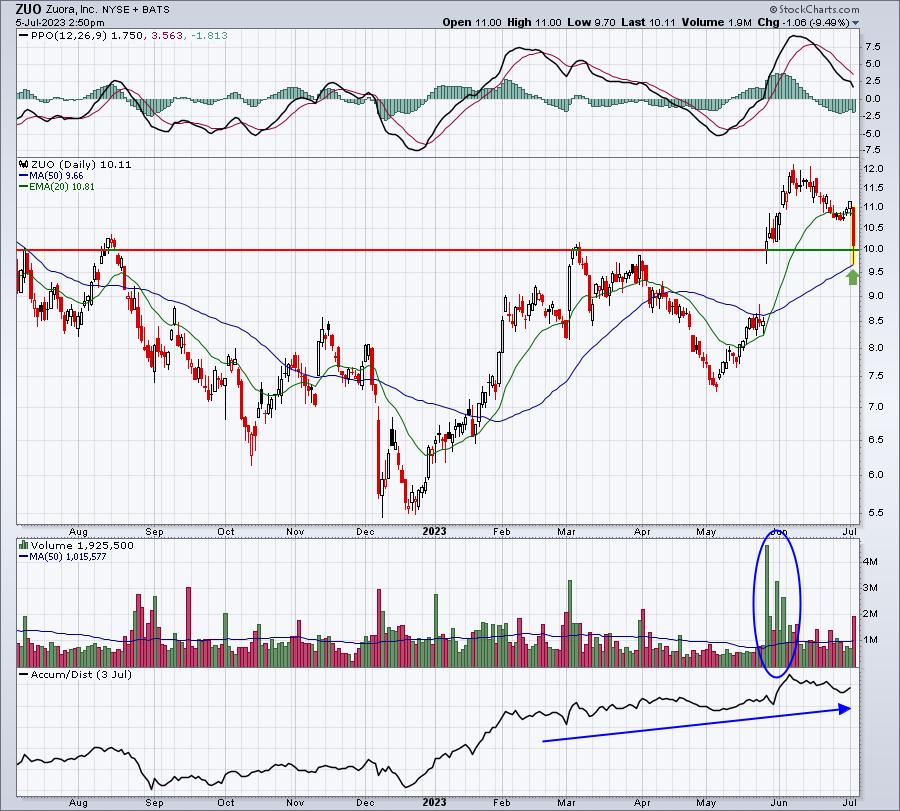
The strong AD line tells me that ZUO has a solid history of finishing trading days on a strong note and that's what I'm counting on here. Again, if I see weakness into the close, it's likely that I'll bail on this one and take a small loss.
Earnings Reports
Here are the key earnings reports for the next two days, featuring stocks with market caps of more than $10 billion. I also include notable companies with market caps below $10 billion. Finally, any portfolio stocks that will be reporting results are highlighted in BOLD. If you decide to hold a stock into earnings, please understand the significant short-term risk that you are taking. Please be sure to check for earnings dates for any companies that you own or are considering owning.
Wednesday, July 5:
None
Thursday, July 6:
LEVI
Economic Reports
May factory orders: +0.3% (actual) vs. +0.9% (estimate)
FOMC minutes released at 2:00pm ET
Happy trading!
Tom