
EB Daily Market Report - Friday, July 7, 2023
Bulls-Eye Forecast: Mid-Year Update
Last night's event was recorded and it'll be sent out later today. Also, we will make the ChartList of 31 charts available to all Annual members later today as well.
Executive Market Summary
- Futures were mostly lower overnight and we saw an initial gap down
- Small caps ($SML, +1.66%) are showing leadership today
- The 10-year treasury yield ($TNX) is flat today after June nonfarm payrolls came in slightly below expectations; average hourly earnings did come in slightly higher than expected, however
- Commodities are mostly higher as crude oil ($WTIC, +2.16%) jumps back above $73 per barrel
- Energy (XLE, +2.84%) and materials (XLB, +1.61%) are leading today's advance, while all four defensive groups are lower
- Oil equipment & services ($DJUSOI, +7.04%) are breaking their downtrend line (see below)
- Banks ($DJUSBK, +1.83%) are having a strong session, aiding the financials (XLF, +0.78%)
- Schlumberger (SLB, +8.14%) and other energy-related names are littering the top of the S&P 500 leaderboard today
Market Outlook
We always like to see banks ($DJUSBK) performing well. They don't have to lead the advance, but even short-term strength is welcome. Today, we're seeing that short-term strength and nearing a key resistance level:
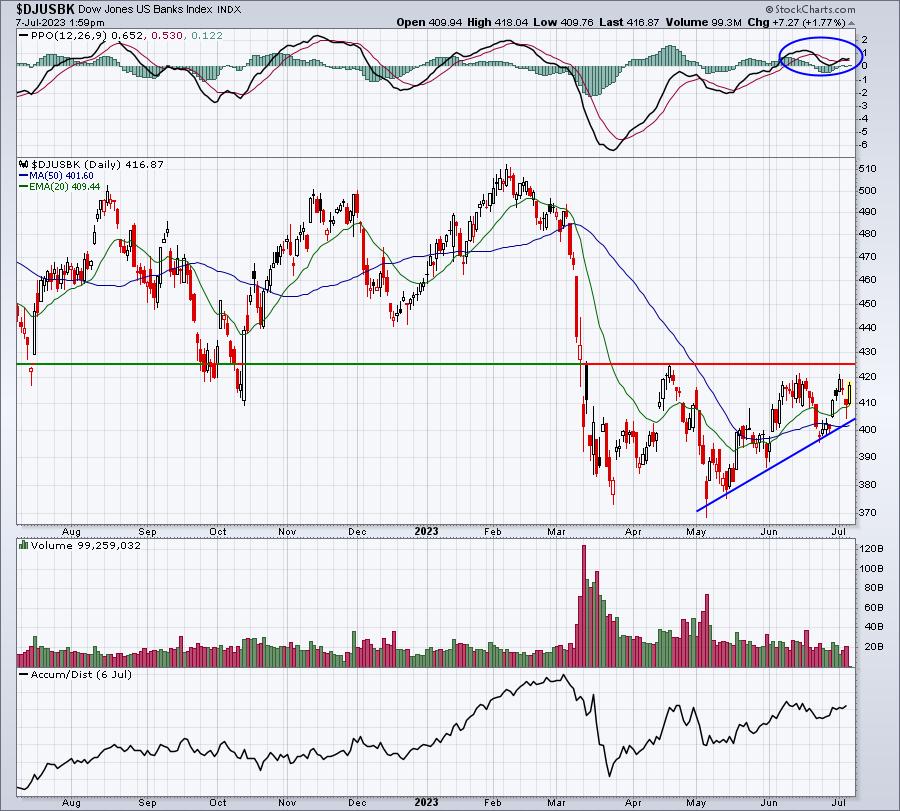
The bounce off of yesterday's successful 20-day EMA test is encouraging, but there's still plenty of questions on this chart. The first MAJOR price step would be to close above the 425 level. Fundamentally, however, the inverted yield curve usually results in relative underperformance in banks. Therefore, even a breakout should be approached with a bit of skepticism.
Sector/Industry Focus
Oil equipment & services ($DJUSOI) is having a very strong day, breaking a recent downtrend line:
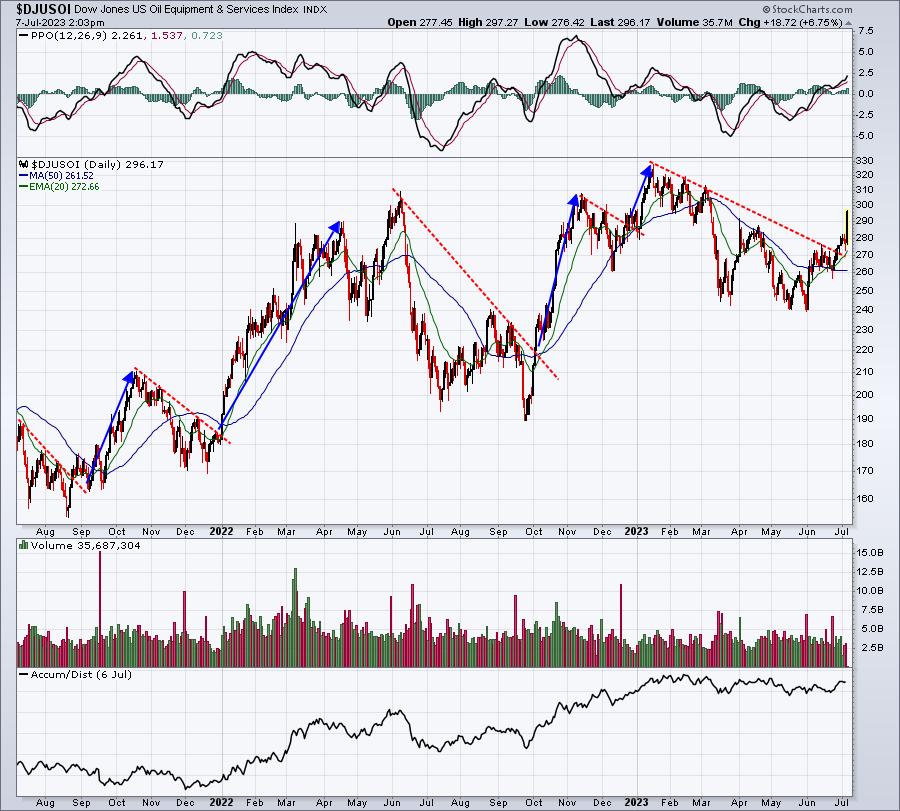
In the recent past, these downtrend line breaks have resulted in significant rallies. So as long as the DJUSOI trades above its now-rising 20-day EMA, I'd look for higher prices.
ChartLists/Strategies
It's worth mentioning that several stocks on the Short Squeeze ChartList (SSCL) are starting to make moves. Using the Summary feature at StockCharts.com and setting the period to "One Week", you can see that there've been many double digits moves higher over the past week. Perhaps this is just a quick little blip to the upside.....or maybe many of these stocks are just getting started. Check out the strongest performers over the past week:
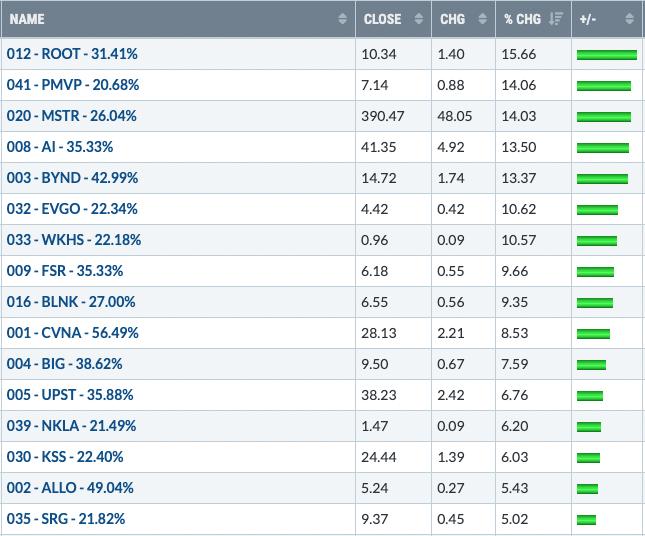
Here are the two that are of the most interest to me:
BYND:
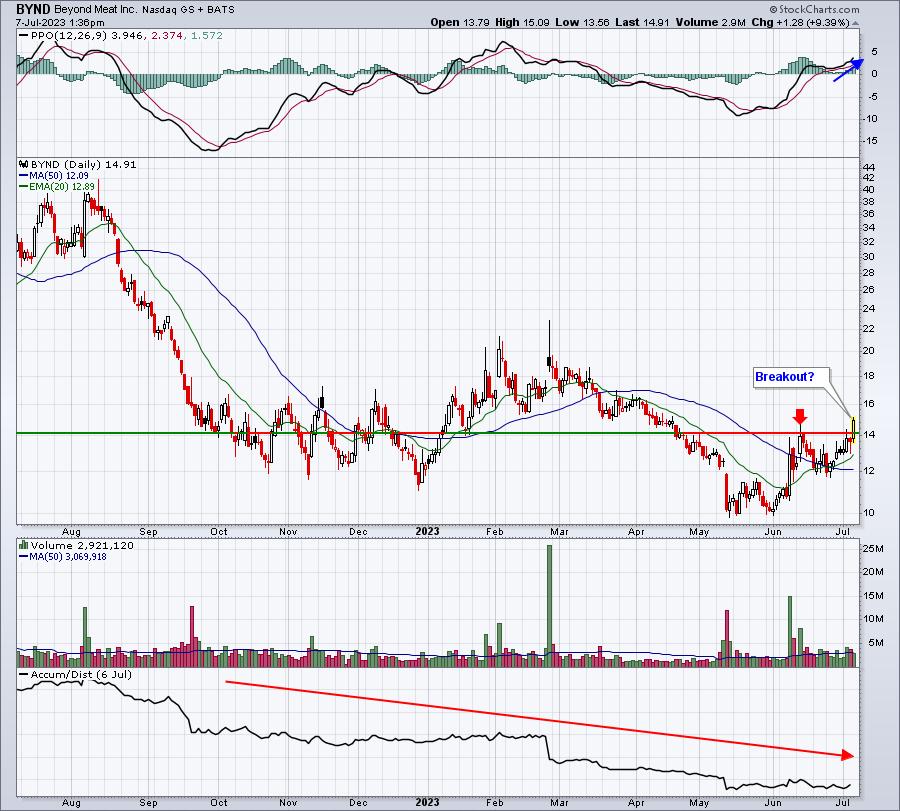
We've seen a lot of interest in BYND of late, but don't fall asleep on that poor AD line. That's a signal that BYND has a history of strong intraday moves with failures in the afternoons. I'm okay trading this breakout as volume is starting to pick up, but a close back below 14 would be a warning sign here. BYND is a VERY risky trade, but the potential reward is strong as well. Only riverboat gamblers need apply.
MSTR:
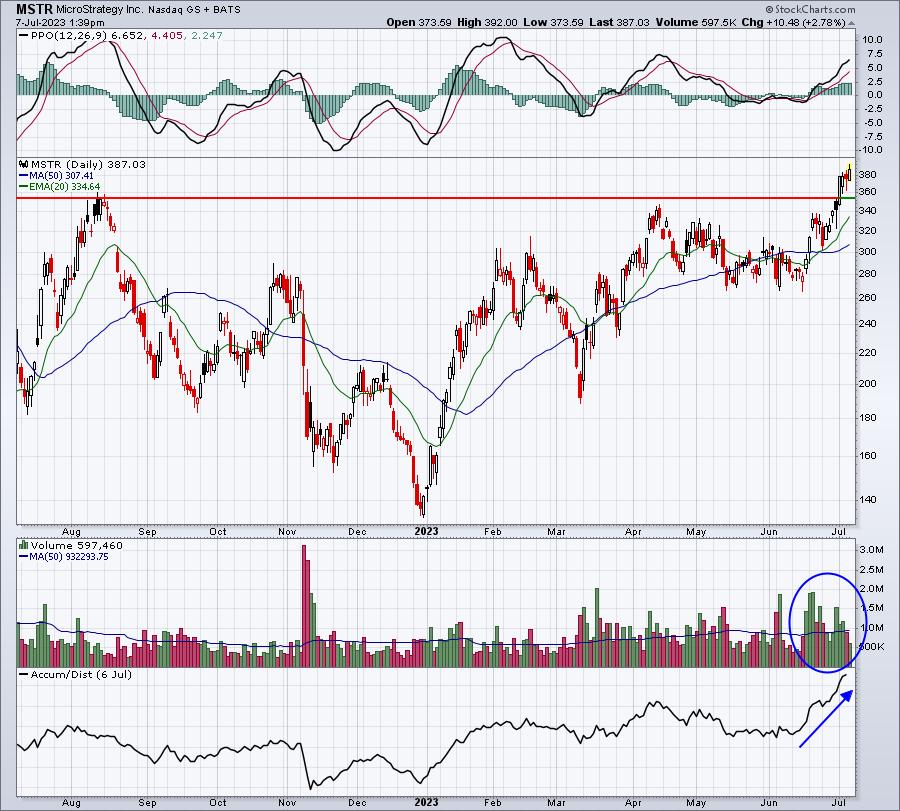
MSTR could use a bit more volume, but the fact that it's trading at a 52-week high means that every single share that's been shorted over the past year is underwater. That's a great recipe for a big short squeeze. We're in short squeeze territory right now, but surging volume is needed to confirm a major short squeeze. And I LOVE the HUGE increase in the AD line over the past 3-4 weeks. Unlike BYND, this one has been closing strong.
Earnings Reports
Here are the key earnings reports for the next two days, featuring stocks with market caps of more than $10 billion. I also include notable companies with market caps below $10 billion. Finally, any portfolio stocks that will be reporting results are highlighted in BOLD. If you decide to hold a stock into earnings, please understand the significant short-term risk that you are taking. Please be sure to check for earnings dates for any companies that you own or are considering owning.
Friday, July 7:
AZZ
Monday, July 10:
HELE, WDFC, ETWO
Economic Reports
June nonfarm payrolls: 209,000 (actual) vs. 213,000 (estimate)
June private payrolls: 149,000 (actual) vs. 199,000 (estimate)
June unemployment rate: 3.6% (actual) vs. 3.6% (estimate)
June average hourly earnings: +0.4% (actual) vs. +0.3% (estimate)
Happy trading!
Tom