
EB Daily Market Report - Quick Update - July 10, 2023
I just want to quickly touch on a few key areas today as money rotates in rather bullish fashion.
Biotechs ($SPSIBI):
Biotechs historically love the month of July, but during the first week of July, it didn't seem to matter. Well, it's mattering today as the $SPSIBI (underlying index for the 3x leveraged long ETF LABU) is moving strongly higher and clearing recent overhead resistance. We're right up against the declining 20-day EMA, so I've traded out of LABU, but I'm ready to jump right back in if the SPSIBI continues strengthening into the close:
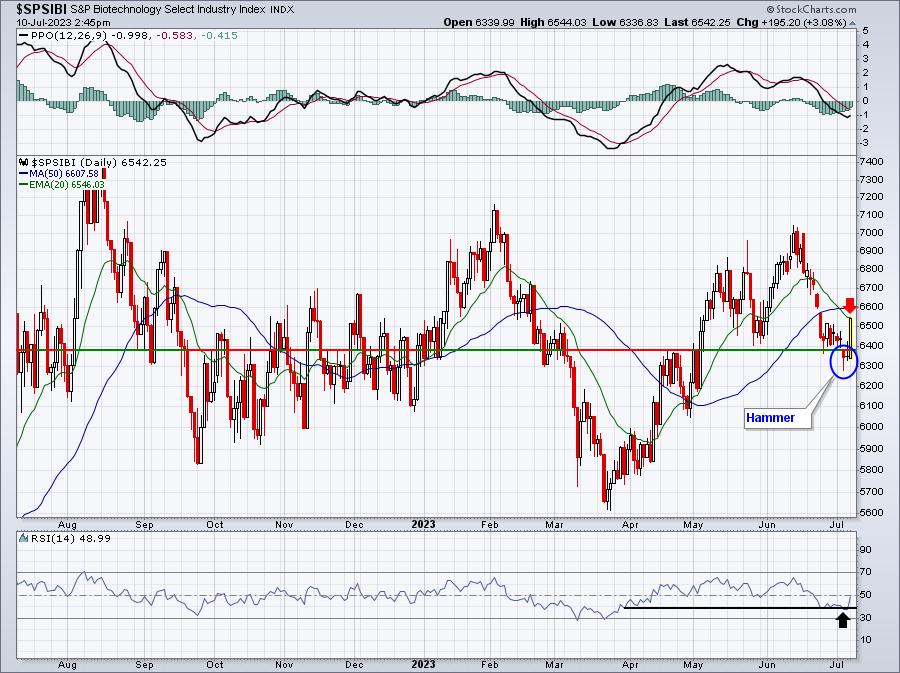
The 20-day EMA is 6546 and today's high was 6544 and we're currently trading near that level. Also, watch the RSI 40 support level. That's a typical area where we see a bottom during an advance. The break below 6400 price support could be a head fake as we did see strength into the close and a hammer print. Given today's surge, the SPSIBI is now up for the month of July and it just might get a lot better - but it all starts technically with clearing this 20-day EMA.
Small Caps (IWM):
Rotation today is really benefiting the small caps as the IWM continues to bounce sharply off of its recent rising 20-day EMA test. The chart looks more and more like IWM will make this breakout through key price resistance in the 188-189 area. If so, I'd look for further upside to nearly 200:
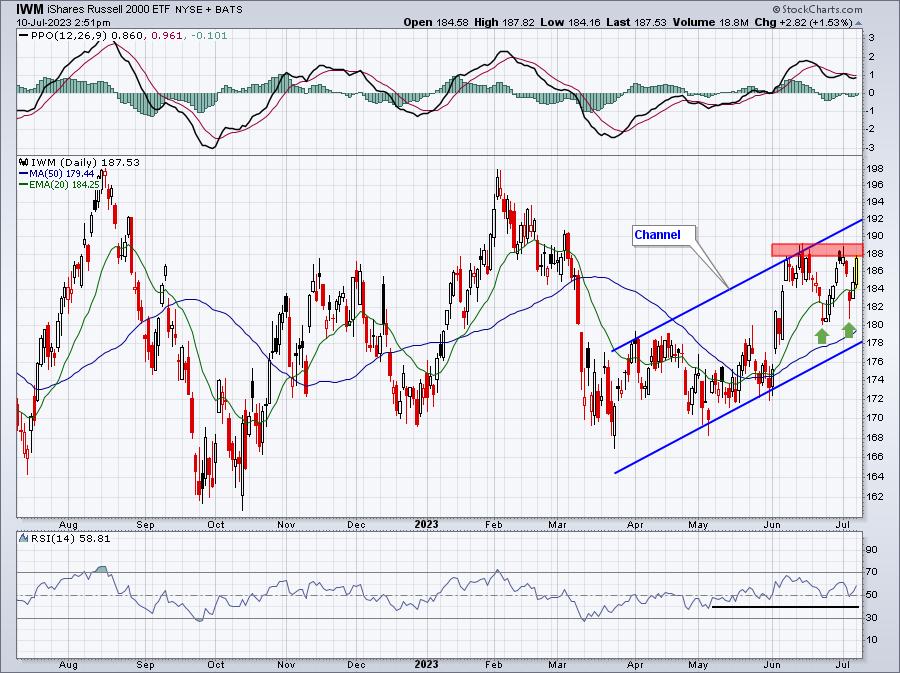
This channel looks very solid right now and those two green arrows show perhaps the beginning of higher lows. RSI has easily held above 40 support. The red-shaded area highlights the most important short-term price resistance on the chart. If the IWM can move through 189, I see another quick surge developing right after it.
Industrials (XLI):
The bullishness of the XLI chart is growing. I love the recent slightly pullback, followed by more buying. The XLI is moving to a new all-time high and that's excellent news for U.S. equities:
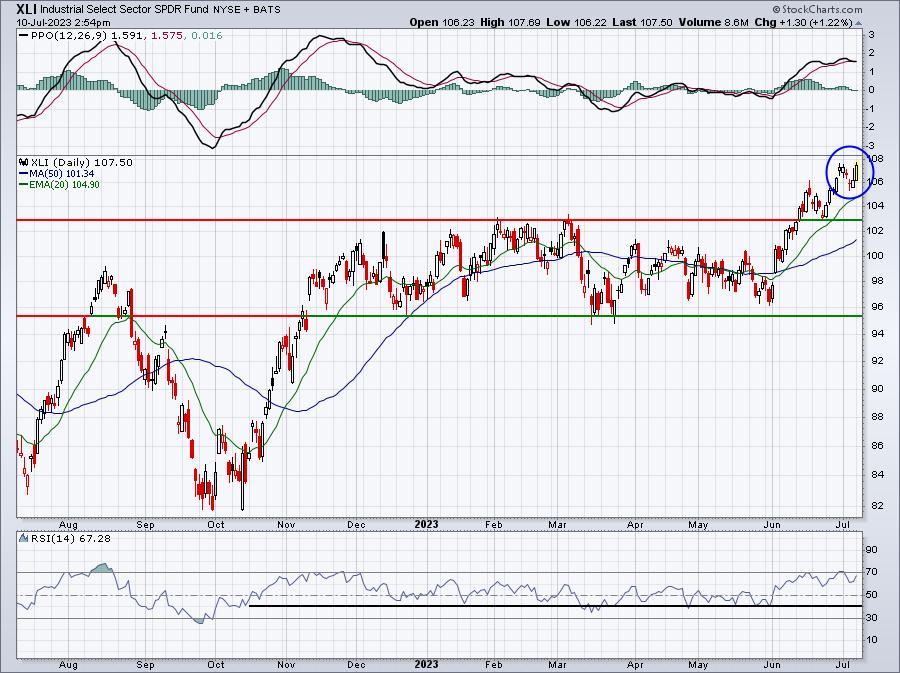
Most traders/investors have little patience. When something in the market isn't going quite right, they jump to conclusions way too early. The whole "breadth" worry in 2023 is a prime example. No one worried about industrials (XLI) in November and December, when the group was flying high. But while it consolidated after an uptrend, which is a bullish continuation pattern, by the way, note that the RSI fell back to that 40 area, before finally breaking out again in June. Now the group is showing leadership once again. Keep in mind that the XLI doesn't typically lead the market for long, but when it goes up, it's an excellent bullish signal about our economy. That's how I see it right now.
Transportation ($TRAN):
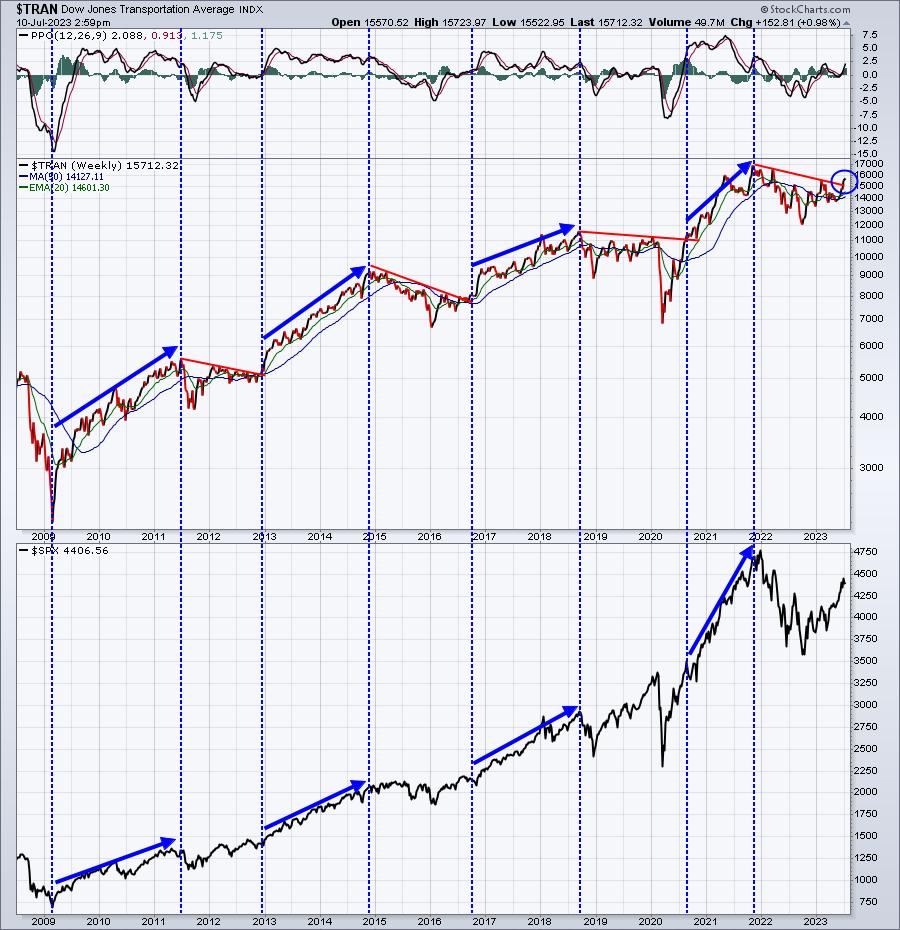
Want to know why the XLI has broken out? Well, take one look at transports, because that's your answer. I've spoken a lot about this group recently, highlighting the fact that when the TRAN breaks out of periods of consolidation, it generally leads to BIG moves up in the S&P 500. It's rallying again today after a very brief pullback. Here's a long-term refresher chart:
Giddy up.
10-Year Treasury Yield ($TNX):
The TNX moved up to test very important yield resistance near 4.10%. Thus far, it's backing off in a possible island cluster as you can see below:
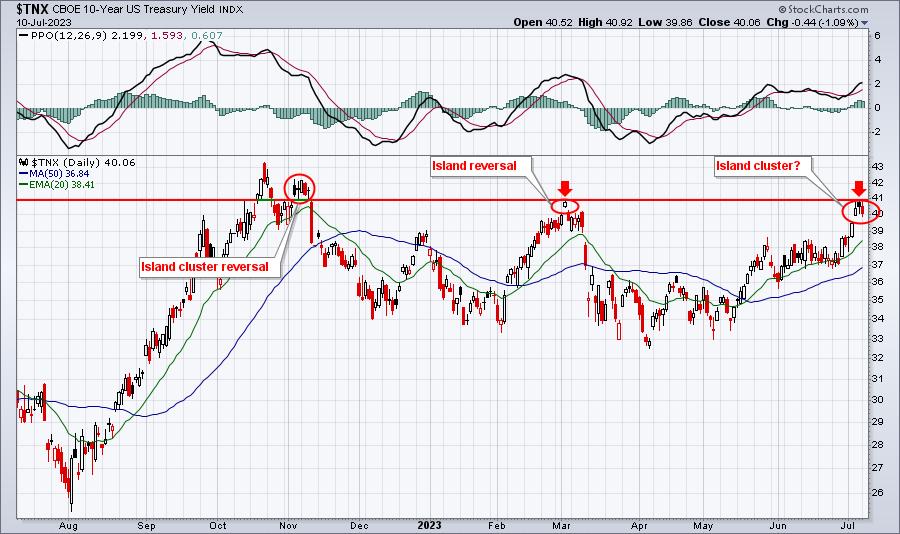
A gap down tomorrow would solidify the current pattern as an island cluster reversal, similar to the top we saw in November. There was also an island reversal (only one candle left on an island) at the beginning of March. But just because we have an apparent island cluster doesn't mean that we'll see a gap lower. We could move right back higher and bust through overhead yield resistance at 4.10%. Let's see which way we go. We should just be prepared in the event that we see a gap lower.
Happy trading!
Tom