
EB Daily Market Report - Tuesday, July 11, 2023
Executive Market Summary
- Futures were strong this morning and we've been higher throughout much of the day
- The NASDAQ, however, continues to lag and traded in negative territory for awhile this morning
- Cryptos are relatively flat on the session
- Crude oil ($WTIC, +2.62%) is just under $75 per barrel, threatening its 2-month high
- The 10-year treasury yield ($TNX) is down 2 basis points to 3.98%, continuing to back off of the recent 4.10% high
- Energy (XLE, +2.19%), buoyed by higher crude oil prices, has easily broken out above 82.00
- Financials (XLF, +1.11%), industrials (XLI, +1.08%), and transports ($TRAN, +1.40%) are breaking out to new recent highs as well - all aiding small caps (IWM, +0.91%) in its leadership role today
- Oil equipment & services ($DJUSOI, +3.82%) are soaring once again, adding to its recent surge; the group is now up more than 11% over the past week
- Activision (ATVI, +10.28%) is at the top of the S&P 500 leaderboard after its deal with Microsoft (MSFT, -0.25%) moves closer to completion
- The June CPI report is due out tomorrow morning and the June PPI report will follow on Thursday morning
Market Outlook
We know there is a negative divergence on the NASDAQ 100 ($NDX) daily chart. On the hourly chart, however, I'm watching a key gap support, while at the same time monitoring the current downtrend line:
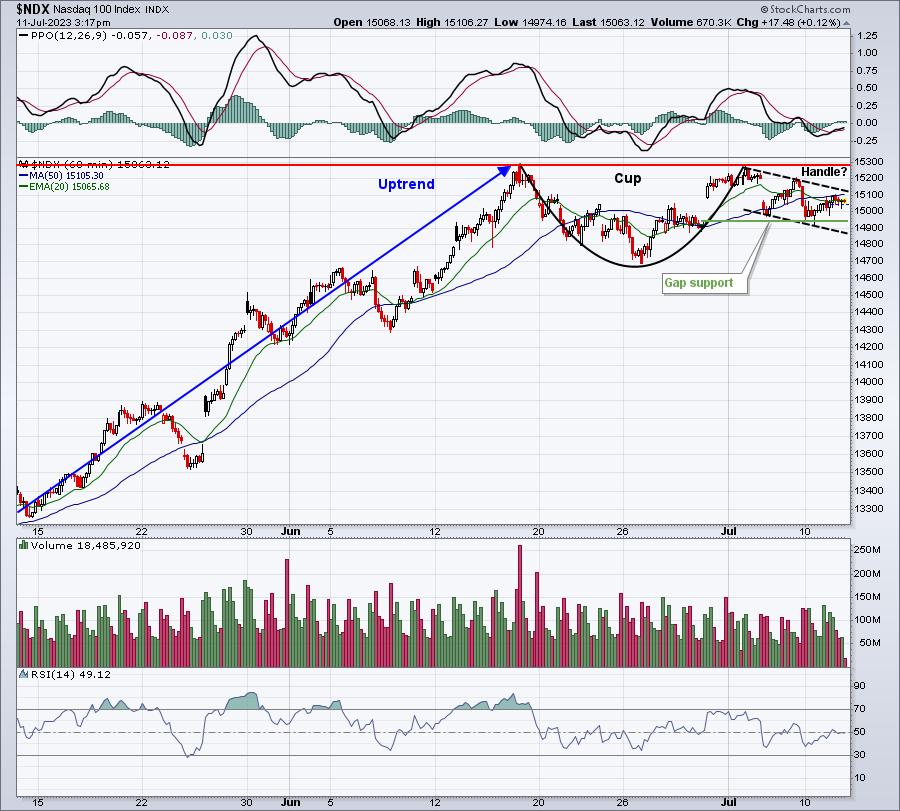
So the bearish argument talks about the negative divergence. Well, the bullish argument points out this cup with handle, which is a bullish continuation pattern. Personally, I don't like betting against a bull market, so I'd avoid shorting. A move above 15300 would confirm this bullish pattern, with a measurement to nearly 16000.
Personally, I've moved away from all leverage heading into tomorrow's key June CPI report. I expect the number to be relatively tame, but the risk is certainly elevated. LABU (biotech bull ETF 3x) was unable to penetrate its 20-day EMA, so I decided to exit there. Meanwhile, the IWM, which I'm quite bullish, is up against very big price resistance as this inflation report looms. I've exited my TNA and have moved those proceeds entirely into the IWM. I believe it's going higher, but it's too risky to ride the TNA into tomorrow's action - at least it's too risky for me. If we break out into today's close or tomorrow after the report, I'll be happy riding the IWM. I can revisit opportunities to use leverage with the group at a later time.
Sector/Industry Focus
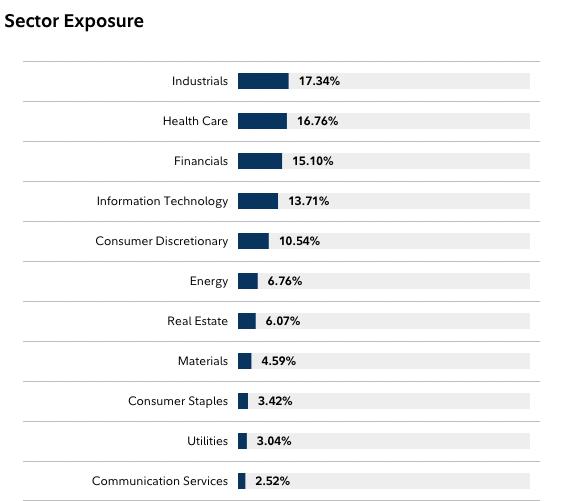
It's important to understand what makes the small caps tick. They've lagged badly in 2023 mostly due to the lagging industrials sector (XLI). The XLI makes up the following percentages of our 3 key index ETFs:
- QQQ: 3.91%
- SPY: 8.47%
- IWM: 17.34%
Also, the narrow leadership among large cap names like Apple (AAPL), Microsoft (MSFT), NVIDIA Corp (NVDA), Tesla (TSLA), Amazon.com (AMZN), etc., negatively impacts small caps that this asset class is VERY diversified with only one holding representing more than 0.3% of the entire ETF.
Here's how the IWM is broken down by sector representation:
If we look at sector performance over the past week, industrials and financials (XLF) are among the leaders:
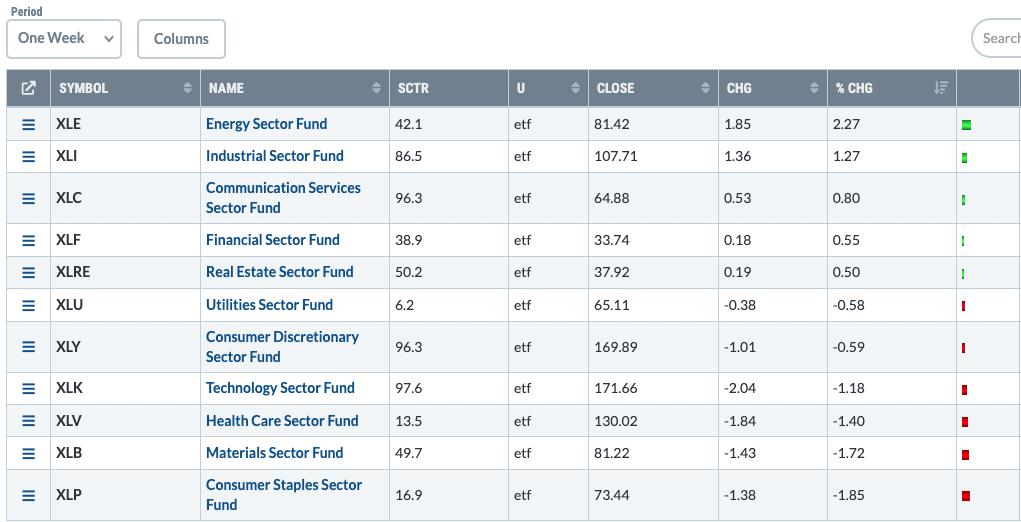
The fact that energy (XLE) is leading also helps the IWM performance vs. both the SPY and QQQ as the IWM is represented more heavily by energy names.
All of this helps to explain why the IWM:QQQ ratio looks like this over the past week:
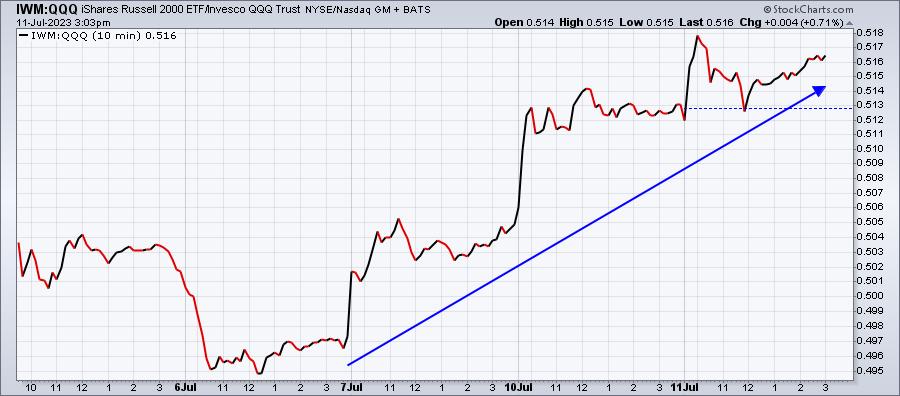
We're likely in a short-term period where the IWM outperforms. I expect the QQQ will take over again as leader, but I'd respect this relative uptrend until it changes.
ChartLists/Strategies
Here are how the Top 20 Strong Earnings ChartList (SECL) stocks, based on SCTR score, are performing today:
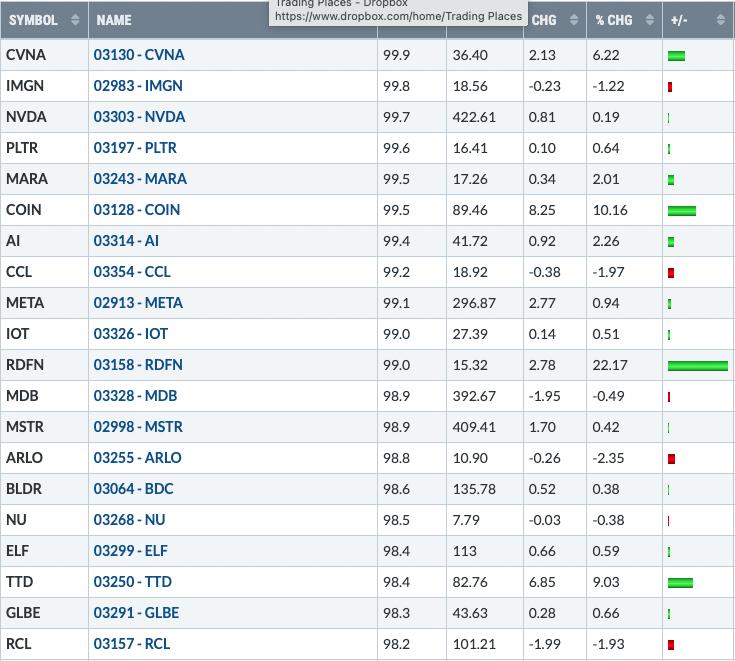
Now look at the Bottom 20 SCTRs on the SECL and check out their performance:
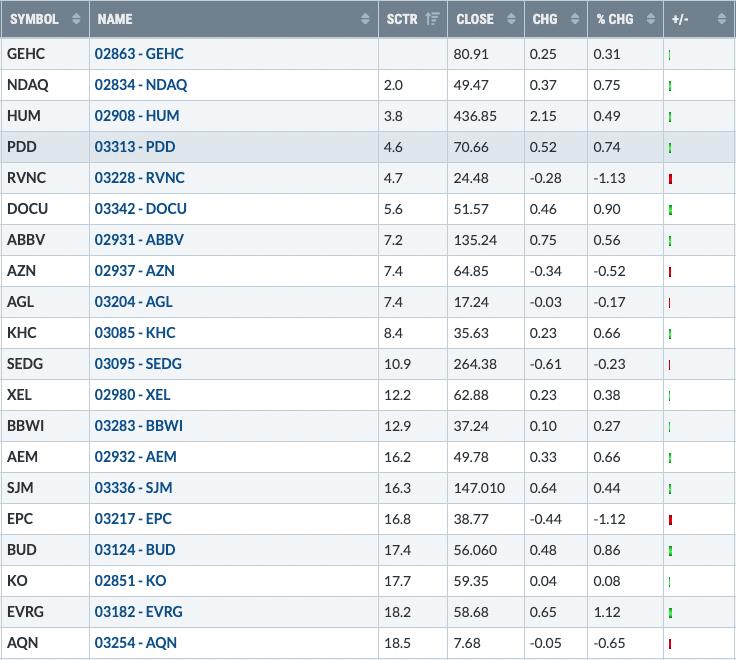
It's really hard to find winners when we're working off of the lowest SCTR scores, because these companies are among the worst in terms of relative strength. So while they did meet our filters for inclusion on the SECL, which is primarily fundamental-based, that does not necessarily justify buying any of them from a technical perspective.
Moral of the Story: Stick with the leaders.
Earnings Reports
Here are the key earnings reports for the next two days, featuring stocks with market caps of more than $10 billion. I also include notable companies with market caps below $10 billion. Finally, any portfolio stocks that will be reporting results are highlighted in BOLD. If you decide to hold a stock into earnings, please understand the significant short-term risk that you are taking. Please be sure to check for earnings dates for any companies that you own or are considering owning.
Tuesday, July 11:
None
Wednesday, July 12:
None
Economic Reports
None
Happy trading!
Tom